Pulsating young brown dwarfs
We present the results of a nonadiabatic, linear stability analysis of models of very low-mass stars (VLMSs) and brown dwarfs (BDs) during the deuterium burning phase in the center. We find unstable fundamental modes with periods varying between 5 hr for a 0.1 star and 1 hr for a 0.02 BD. The growth time of the instability decreases with decreasing mass and remains well below the deuterium burning time scale in the mass range considered (0.1–0.02 M⊙). These results are robust against variations of the relevant input physics in the evolutionary models. We identify possible candidates for pulsational variability among known VLMSs and BDs in nearby star forming regions whose location in the HR diagram falls within or close to the boundary of the instability strip. Finally, we discuss the possibility that the variability observed in a few objects with periods of 1 hr can be interpreted in terms of pulsation.
Key Words.:
Stars: low-mass, brown dwarfs - Stars: pulsation - Stars: HR diagram1 Introduction
Stellar pulsation represents a unique probe to study the internal structure and evolution of stars. This technique has been applied to many classes of stars, both on the main sequence and in earlier/later stages of their evolution (e.g., Gautschy & Saio 1995, Marconi & Palla 1998). New classes of pulsators are being discovered across the HR diagram from ground-based observations and with the advent of space missions (MONS, COROT) the potential of discovering solar-like oscillations in other stars promises a major improvement in our understanding of stellar interiors (e.g., Thompson, Cunha & Monteiro 2003).
In this Letter, we propose the identification of a new class of pulsators,
VLMSs and BDs, in which the instability is induced by deuterium (D-) burning
in their centers. Due to the high sensitivity of nuclear reactions on
temperature, fully convective stars can become pulsationally unstable during
the burning phases. Gabriel (1964) was the first to suggest that such
mechanism, called -mechanism, would make low-mass stars on the main
sequence vibrationally unstable.
Later on, Toma (1972) showed that
pre–main-sequence (PMS) stars in the range 0.2–2.0 could also
become pulsationally unstable during the D-burning phase and suggested a
possible relation of this phenomenon with the observed variability of T Tauri
stars. In both cases, however, and for different reasons, the suggestion has
not met with success and to date there is no observational evidence for the
-mechanism in any class of pulsating star where the destabilization
is mainly induced by opacity effects in ionization regions near the
stellar surface (the -mechanism).
Indeed, no periodic variability, which could be interpreted as
pulsation, has been reported up to now in main sequence low-mass stars,
which may not be surprising, given
the weak dependence of the -chains on temperature and the resulting long
-folding times for the -mechanism.
For young PMS stars, the main difficulty to confirm observationally
the results of Toma (1972) is due to the very short D-burning time scale,
Myr, for stars with mass 0.2 . Moreover,
the results obtained by Toma (1972) are optimised, in terms
of D-burning time scale and e-folding time for the pulsation, since
he adopted an initial D-abundance
about ten times higher than the currently measured interstellar
value and ignored
D-depletion during protostellar accretion that can substantially reduce its
abundance at the beginning of the PMS phase of low-mass stars.
As we will show below, VLMSs ( 0.1 ) and BDs in the
earliest evolutionary stages have the appropriate physical conditions to
circumvent the limitations of previous attempts.
2 Instability induced by D-burning in VLMSs and BDs
BDs are expected to begin the PMS phase with convective interiors and with the full amount of interstellar deuterium since during the preceding phase of protostellar accretion their centers are too cold to start any nuclear reaction. The ignition of deuterium requires temperatures around K that can only be reached in protostars more massive than 0.1–0.2 , depending on the mass accretion rate (Stahler 1988). Thus, very low-mass objects need to contract somewhat in the PMS phase before deuterium can start burning and being depleted. Once the critical temperature is achieved, the D-burning phase occurs on a time scale that varies between 2.5 Myr for a 0.1 star and 20 Myr for a 0.02 brown dwarf (Chabrier et al. 2000).
Since the energy generation rate, , scales approximately with the 12-th power of the temperature, the rate of combustion is slower for the lowest mass objects. The same temperature sensitivity of is at the root of the instability induced by any temperature variation: since , a small T-perturbation induces a variation of which is an order of magnitude bigger. (Note that is also linearly proportional to density, but no destabilizing effect is expected from variations in this quantity). In terms of pulsation analysis, the time scale for the growth of the instability, , is inversely proportional to and should be shorter than the D-burning time for the -mechanism to operate. Therefore, in order to test its viability, it is important to follow numerically the growth of the instability in time since the onset of the D-burning phase.
3 Evolutionary models and pulsation analysis
Our analysis focuses on objects in the mass range 0.1–0.02 , close to the minimum value for D-burning (0.013 , Chabrier et al. 2000). The evolutionary models are based on the input physics described in Baraffe et al. (1998) and on the so-called “NextGen” grainless atmosphere models (Hauschildt et al. 1999). Models are calculated for a solar metallicity, with an initial deuterium mass fraction , characteristic of the local interstellar medium (Linsky 1998), and with mixing length parameter equal to the pressure scale height. During the early phase of D-burning, brown dwarfs are relatively hot, with , and their atmospheric properties are still well described by dust-free models.
3.1 Linear stability analysis results
We performed a non-adiabatic linear stability analysis of the model structures during the D-burning phase, searching for the presence of unstable radial eigen modes. Unstable modes characterize oscillations around the hydrostatic equilibrium configuration. If perturbations have time to grow, they could reach large amplitudes and result in periodic phases of expansion and contraction, with a pulsation period related to the dynamical time scale of the object . References on the pulsation code used for the present purpose can be found in Lee (1985) and Baraffe et al. (2001). In all models analyzed, we find unstable fundamental modes, the results being rather robust against variations of the relevant input physics (see Sect. 3.2). We also find unstable first overtones, but their stability properties are sensitive to the input physics and their growth rate is usually smaller than that of the fundamental mode. Higher overtones remain stable during the whole D-burning phase. We thus restrict the rest of our study to fundamental modes.
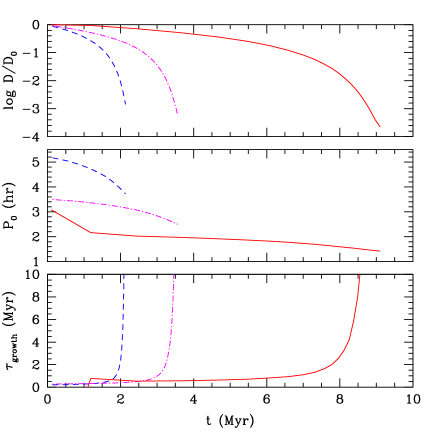
In the mass range of interest, fundamental mode periods vary between 1hr and 5 hr, close to . For a given mass, decreases during the D-burning phase, since contraction proceeds and increases. This is illustrated in Table 1 which summarizes the characteristics of VLMSs and BDs and their main pulsation properties during the D-burning phase for different masses. We define as the e-folding time characterizing the growth time scale of the pulsation amplitude for the fundamental mode. Fig. 1 displays and for a 0.1 VLMS, and 0.06 and 0.03 BDs. Figure 1 and Table 1 show that at the beginning of the D-burning phase, is shorter, by at least a factor 10, than the D-burning time scale , which is 2.5, 4.2 and 9.3 Myr for 0.1, 0.06 and 0.03 , respectively. Note that only unstable models are shown in Fig. 1, since the structure becomes stable again before complete depletion of D. It remains small during a significant fraction of the D-burning phase in the lowest mass BDs, indicating that the perturbations may have time to grow to reach significant amplitudes. The location of the D-instability strip in the HR diagram is shown in the top panel of Fig. 2, along with evolutionary tracks of selected masses and isochrones. The curves of constant period cut the strip almost horizontally (nearly constant luminosity) and the shortest periods are found for the least massive BDs. Note that our models can also provide the locus of the D-instability strip in the color-magnitude diagram (CMD) for different bands for comparison with observations. We plan to present such diagrams in a forthcoming paper.

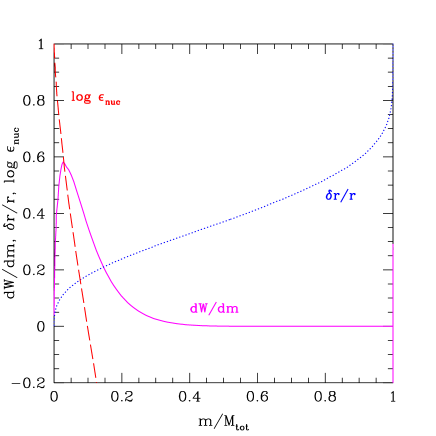
Inspection of the differential work integral dW/dm throughout the structure of D-burning objects reveals the exciting (positive dW/dm) and the damping (negative dW/dm) zones. This quantity is plotted in Fig. 3 for the 0.03 BD at the beginning of the D-burning phase. The positive work in the central region is due to the perturbation of the nuclear energy generation rate and characterizes the -mechanism. As a rough approximation, the work integral in the central region follows
| (1) |
with the nuclear energy generation rate and . The source of nuclear energy is due to the reaction with in our objects, at temperatures K. It is the combination of such high sensitivity of the nuclear energy generation rate with temperature, and the fully convective structure of low-mass objects, which yields a less centrally condensed structure, that allows the excitation by the -mechanism. Indeed, VLMSs and BDs are characterized by a low central condensation with a ratio of central to mean density . This ratio decreases with mass and for a given mass it remains nearly constant with age. The -mechanism is usually unimportant for radial pulsation in stars because of the small amplitudes that can develop in dense central regions where nuclear burning occurs. However, stars less centrally condensed are thought to be potential sites for the -mechanism (Gabriel 1964). Finite amplitudes of the eigenfunctions can indeed be expected in the central regions, as illustrated by the behavior of the pulsation amplitude displayed in Fig. 3.
3.2 Uncertainties of the results
In order to analyze the sensitivity of the present instability to input physics, we have computed evolutionary models using atmosphere models based on different molecular linelists for TiO and H2O (see Chabrier et al. 2000 for more details). The main effect is a change of the effective temperature (by 100 K), and of the D-burning time scale. As a test on the initial conditions, we have constructed evolutionary sequences starting at temperatures K before central D-ignition. Moreover, we have explored the effect of the mixing length (), since it can affect the early evolution of VLMSs and BDs (see Baraffe et al. 2002). All these variations yield only small quantitative differences, mainly in the D-burning lifetime and the pulsation growth time scale. However, the instability of the fundamental mode survives in all cases, with during most of the D-burning phase. Finally, adopting for the reaction the rate of Caughlan & Fowler (1988) or that of the NACRE compilation (Angulo et al. 1999) has no consequence.
An important uncertainty stems from the treatment of convection, which is assumed frozen in the linear stability analysis, having neglected the perturbation of the convective flux in the linearized energy equation. Such standard approximation is only justified by the argument that the convective time scale in the inner structure of our objects ( s ) is significantly larger than the pulsation periods ( s). Analysis of the effect of convection on the perturbation is beyond the scope of this study and in any case can only be qualitative given our poor knowledge of the interaction between convection and pulsation.
4 Discussion
Our results show that the perturbations excited in the center of D-burning VLMSs and BDs have smaller growth time scale than that of the D-burning phase and may thus have time to grow to the level of observable amplitudes. Unfortunately, our linear models cannot be used to estimate the amplitude of the pulsations. More theoretical work is required and we hope that these initial results will stimulate the development of non-linear calculations in order to estimate pulsation amplitudes and of fully hydrodynamical models to construct synthetic light curves for comparison with observations. In any case, it is important to realize that it may be difficult to distinguish pulsations from other sources of photometric variability, such as rotation and spots or atmospheric events, that occur in VLMSs and BDs on similar time scales. Fortunately, numerous candidates exist which could provide good targets for detailed observational studies.
As an illustration, the lower panel of Fig. 2 displays the location in the HR diagram of 25 spectroscopically confirmed VLMSs and BDs drawn from larger surveys in Taurus and Chamaeleon I (Briceño et al. 2002, Comerón et al. 2000, Luhman et al. 2003, Luhman 2004). The rather large error bars indicate the current uncertainties in the conversion from spectral types to effective temperatures (see discussion in, e.g., Luhman 2004), but the overall distribution closely matches the predicted position of the instability strip down to the lowest masses with the shortest pulsational periods.
Evidence for photometric variability of young VLMSs and BDs both in the field and in young clusters has been already obtained by several groups in the last few years (Bailer-Jones & Mundt 2001, Joergens et al. 2003, Zapatero Osorio et al. 2003). The amplitude of the observed variations vary between tens of mmag in the optical to 0.05–0.2 mag in the near-IR where these cool objects emit most of their energy. In several cases, periodic variability has been reported with tentative periods in the range from half an hour to several hours. Very interesting results have been found in the Orionis clusters (age 3 Myr) where two objects (S Ori 27 and S Ori 28) have periods around 3 hr and even shorter in the case of S Ori 31 (2 hr) and S Ori 45 (0.75 hr) (Bailer-Jones & Mundt 2001, Zapatero-Osorio et al. 2003). The minimum fundamental periods that we find are close to 1hr, corresponding to the lowest mass studied (cf. Table 1). Although the period of S Ori 45 is slightly shorter than 1 hr, it is compelling that this object has precisely a mass which could be as low as 0.02 (Béjar et al. 1999). Several other candidates in the Orionis cluster appear to share similar properties (Scholz & Eislöffel 2004). So far, the observed variability has been interpreted in terms of rotation periods, presence of photospheric cool or hot spots, interaction with accretion disks, and/or atmospheric events. For objects with the shortest periods (1 hr), the inferred rotational velocities would exceed 100 km s-1 at or above breakup (e.g., Joergens et al. 2003). The pulsational instability induced by D-burning thus offers a new interpretation that relies on fundamental (sub)stellar properties. It also has the potential of providing direct information on the otherwise inaccesible internal structure of VLMSs and BDs. More fundamentally, it could provide the first evidence for the existence of the -mechanism.
| M | age | |||||
|---|---|---|---|---|---|---|
| (Myr) | (K) | () | (hr) | (Myr) | ||
| 0.02 | 2.22 | 0.982 | 2540 | 2.516 | 1.67 | 3.03 |
| 15.9 | 0.054 | 2450 | 2.801 | 1.18 | 2.49 | |
| 18.9 | 0.002 | 2390 | 2.927 | 1.04 | 25.1 | |
| 0.03 | 1.18 | 0.936 | 2710 | 2.138 | 2.16 | 0.78 |
| 6.60 | 0.121 | 2690 | 2.271 | 1.77 | 0.94 | |
| 8.49 | 0.004 | 2680 | 2.380 | 1.52 | 8.02 | |
| 0.04 | 1.23 | 0.66 | 2790 | 1.915 | 2.52 | 0.41 |
| 3.71 | 0.148 | 2790 | 1.985 | 2.26 | 0.65 | |
| 5.16 | 0.004 | 2780 | 2.092 | 1.92 | 5.92 | |
| 0.06 | 0.86 | 0.644 | 2890 | 1.567 | 3.41 | 0.31 |
| 2.16 | 0.218 | 2890 | 1.616 | 3.15 | 0.43 | |
| 3.36 | 0.005 | 2890 | 1.728 | 2.63 | 4.10 | |
| 0.08 | 0.65 | 0.642 | 2950 | 1.322 | 4.25 | 0.26 |
| 1.39 | 0.315 | 2940 | 1.356 | 4.02 | 0.32 | |
| 2.54 | 0.006 | 2940 | 1.475 | 3.27 | 3.32 | |
| 0.1 | 0.56 | 0.618 | 3010 | 1.125 | 5.04 | 0.23 |
| 1.11 | 0.307 | 3000 | 1.162 | 4.77 | 0.29 | |
| 2.00 | 0.008 | 3000 | 1.281 | 3.92 | 2.40 |
References
- (1) Angulo C., Arnould M., Rayet M., et al. 1999, Nucl. Phys. A, 656, 3
- (2) Baraffe I., Chabrier G., Allard F., Hauschildt P.H. 1998, A&A, 337, 403
- (3) Baraffe I., Chabrier G., Allard F., Hauschildt P.H. 2002, A&A, 382, 563
- a (1) Baraffe I., Heger A., Woosley S. E. 2001, ApJ, 550, 890
- (5) Béjar, V.J.S., Zapatero Osorio, M.R., Rebolo, R. 1999, ApJ, 521, 671
- (6) Briceño C., Luhman K.L., Hartmann L., et al. 2002, ApJ, 580, 317
- (7) Caughlan G.R., Fowler W.A. 1988, Atomic Data and Nucl. Data Tables, 40, 283
- (8) Chabrier G., Baraffe I., Allard F., Hauschildt P.H. 2000, ApJ, 542, 464
- (9) Comerón F., Neuhäuser R., Kaas A.A. 2000, A&A, 359, 269
- (10) Gabriel, A. 1964 Ann. Astrophys., 27, 141
- (11) Gautschy A., Saio H. 1995, ARAA, 33, 75
- (12) Hauschildt P.H., Allard F., Baron E. 1999, ApJ, 512, 377
- (13) Joergens V., Fernández M., Carpenter J.M., Neuhäuser R. 2003, ApJ, 594, 971
- (14) Lee, U. 1985 PASJ, 37, 261
- (15) Linsky, J. 1998, Space Science Reviews, 84, 285 A&A 416, 555
- (16) Luhman K.L. 2004, ApJ, in press
- (17) Luhman K.L., Briceño C., Stauffer J.R., et al. 2003, ApJ, 590, 348
- (18) Marconi M., Palla F. 1998, ApJ, 507, L141
- (19) Scholz A., Eislöffel J. 2004, A&A, 419, 249
- (20) Stahler S.W. 1988 ApJ 332, 804
- (21) Thompson M.J., Cunha M.S., Monteiro, M.J.P.F.G. 2003, Asteroseismology across the HR diagram, Kluwer Acd. Publ.
- (22) Toma E. 1972, A&A 19, 76
- (23) Zapatero Osorio M.R., Caballero J.A., Béjar V.J.S., Rebolo R. 2003, A&A, 408, 663