Post Bag 3, Ganeshkhind, Pune - 411007, India
GMRT Observations of the Group Holmberg 124: Evolution by Tidal Forces and Ram Pressure ?
We report radio continuum and 21cm HI observations using the Giant Metrewave Radio
Telescope (GMRT) of the
group Holmberg 124 (Ho 124) comprising four late-type galaxies,
namely NGC 2820, Mrk 108, NGC 2814 and NGC 2805. The three galaxies, NGC 2820, Mrk 108
and NGC 2814 which are closely located in the sky plane have clearly undergone
tidal interactions as seen from the various morphological tidal signatures and debris.
Moreover we note various features in the group members which we believe might be due to
ram pressure.
In this paper, we describe four interesting results
emerging from our observations: a) detection
of the tidal radio continuum bridge at 330 MHz connecting the galaxies NGC 2820+Mrk 108 with NGC 2814.
The radio bridge was discovered at 1465 MHz by van der Hulst & Hummel (hulst (1985)).
We find that the bridge has a fairly steep spectrum with a spectral index
() of which is
much steeper than the quoted by van der Hulst & Hummel (hulst (1985)).
b) Detection of other tidal features like the tilted HI and radio continuum
disk of NGC 2814, a HI streamer and a radio continuum tail arising from the south of NGC 2814.
We also report the detection of a possible tidal dwarf galaxy in HI.
c) Sharp truncation in the HI distribution in the south of NGC 2820 and in the HI &
radio continuum distribution in the north of NGC 2814. The optical disks in both the
cases look undisturbed.
As pointed out by Davis et al (davis (1997)), ram pressure affects
different components of the ISM in varying degrees.
Simple estimates of pressure in different components of the interstellar medium
(radio continuum, H and HI) in NGC 2820 indicate that ram pressure will significantly
influence HI.
d) Detection of a large one-sided HI loop to the north of NGC 2820. No radio continuum
emission or H emission is associated with the HI loop. We discuss various scenarios
for the origin of this loop including a central starburst, ram pressure
stripping and tidal interaction.
We do not support the central starburst scenario since it is
not detected in ionized gas. Using the upper
limit on X-ray luminosity of Ho 124 (Mulchaey et al. mulchaey (2003)), we estimate
an upper limit on the IGrM density of cm-3.
For half this electron density, we estimate the ram pressure force of
the IGrM to be comparable to the gravitational pull of the disk of NGC 2820.
Since tidal interaction has obviously
influenced the group, we suggest that the loop could have formed by ram pressure
stripping if tidal effects had reduced the surface density of HI in NGC 2820.
From the complex observational picture of Ho 124 and the numerical estimates, we suggest that the evolution of the Ho 124 group may be governed by both tidal forces due to the interaction and the ram pressure due to motion of the member galaxies in the IGrM and that the IGrM densities should not be too low (i.e. ). However this needs to be verified by other observations.
Key Words.:
Galaxies: interaction – Radio continuum: galaxies – Radio lines: galaxies1 Introduction
In an ongoing project of studying the radio emission from disk galaxies using the GMRT, the poor group of galaxies known as Ho 124 has been observed. Ho 124 consists of four galaxies: an inclined SBc galaxy, NGC 2820 (UGC 4961), a Markarian galaxy, Mrk 108 (NGC 2820a), an IO galaxy, NGC 2814 and an almost face-on Sc galaxy, NGC 2805 (UGC 4936). Since the first three galaxies lie within a few arc minutes of each other, we refer to them as the triplet in the paper. NGC 2805 lies about to the south-west of the triplet.
This group is an interesting multiple interacting system. It was the first system in which a radio continuum bridge was detected (van der Hulst & Hummel hulst (1985)). Although HI bridges and optical bridges had long before been detected, no radio continuum emission had been detected leading to the belief that magnetic fields play little role in confining the bridges. Since then many other interacting galaxies have shown the presence of radio bridges, e.g. the Taffy galaxies (Condon et al. condon (1993)). Bridges, tails and arcs have been detected from many other interacting systems. Following Toomre & Toomre (toomre (1972)), two long tails are expected if two galaxies of comparable masses interact A bridge extending from one galaxy to other is expected if one galaxy is massive and the other has a fraction of mass of the massive partner
Many of the interacting systems occur in groups of a few galaxies, also known as poor groups. Moreover, although the gravitational interaction and ram pressure stripping of gas in members of clusters has been fairly well-studied, less is known about these processes in groups. The IGrM densities are at least an order of magnitude lower than the intracluster medium (ICM). Hence, processes like ram pressure stripping and galaxy harrassment which play an important role in the cluster evolution are not expected to be important in groups (Mulchaey mulchaey4 (2004)). The first X-ray detection of the IGrM was made only a decade ago by Mulchaey et al. (mulchaey1 (1993)). A more extensive X-ray survey of groups using ROSAT data was carried out by Mulchaey et al. (mulchaey2 (1996)) from which emerged the result that groups with at least one early-type galaxy have higher X-ray luminosities than groups with only late-type galaxies. Mulchaey et al. (mulchaey2 (1996)) gave some possible reasons including that the IGrM of groups with only late-type members had either lower temperatures or lower densities. In this paper, we present radio continuum observations at 240, 325, 610 and 1280 MHz and HI 21 cm observations using GMRT of one such group Ho 124 which consists of only late-type galaxies. No X-ray emission was detected from this group by Mulchaey et al. (mulchaey2 (1996), mulchaey (2003)). We show that the IGrM densities in the group Ho 124 consistent with this upper limit could still be sufficient to determine the evolution of the members via ram pressure stripping.
Additionally, we report the detection of a tidal bridge connecting the triplet in radio continuum at 325 MHz and marginal detection at 240 MHz and 610 MHz. We also detect HI 21 cm emission from the bridge and a large one-sided HI loop to the north of NGC 2820. Bosma et al. (bosma (1980)) have studied this group in radio continuum, 21cm HI and in the optical band whereas Artamonov et al. (artamonov (1994)) have studied the group using UBV photometry. Optical properties of the group members can be found in Table 1 of Bosma et al. (bosma (1980)) and in Table 1 of Artamonov et al. (artamonov (1994)).
The plan of the paper is as follows. In section 2, we discuss the observations, data analysis and results. In section 3, we discuss the various morphological features in the group which we believe are due to the tidal interaction and in section 4, discuss various possible scenarios for the origin of the HI loop in NGC 2820. In section 5, we present a discussion of our results and in section 6 we present a summary.
2 Observations, Data analysis and Results
| Parameter | 1280 MHz | 610 MHz | 330 MHz | 240 MHz | HI |
|---|---|---|---|---|---|
| Date of observation | 16/7/2002 | 6/9/2002 | 19/8/2002 | 6/9/2002 | 28/10/2003 |
| On-source telescope time | 4 hrs | 2.5 hrs | 3.3 hrs | 2.5 hrs | 5 hrs |
| Effective bandwidth | 9.3 MHz | 4 MHz | 9.3 MHz | 4 MHz | 64 kHz |
| Phase calibrator | 0834+555 | 0834+555 | 0834+555 | 0834+555 | 0834+555 |
| Flux density of ph cal | Jy | Jy | Jy | Jy | Jy |
| Synthesized beam1 | & | ||||
| PA | & | ||||
| Continuum/line rms | 0.09 mJy/b & 0.08 mJy/b | 0.4 mJy/beam | 1 mJy/beam | 1.9 mJy/beam | 0.2 mJy/beam |
1 this is the effective beamwidth of the images used in the paper and in most cases is larger than the best achievable.
2.1 Radio Continuum
The multi-frequency radio observations at 240, 330, 610 and 1280 MHz were conducted using the GMRT (Swarup et al. swarup (1991), Ananthakrishnan & Rao ananth (2002)) which consists of 30 antennas of 45m diametre each scattered over a 25 km region. The observational details are listed in the first four columns of Table 1. These observations followed the sequence of interspersing 20 minutes on-source scans by a 5 minutes scan on the phase calibrator. The bandpass-cum-amplitude calibrator (3C 147) was observed in the beginning and at the end for half an hour each.
The data was imported as a FITS file to NRAO AIPS software for further analysis. The general procedure followed at all bands included editing out corrupted data, gain calibration of one spectral channel data, bandpass calibration and channel averaging to obtain the continuum database. These were then imaged and CLEANed to obtain the final image. Wide-field imaging was used at 610, 330 and 240 MHz. We divided the primary beam into 9 facets for 610 MHz, and into 25 facets at 330 MHz and 240 MHz. The data were also 3-d self-calibrated. We used a uv taper of and a uv range of with robust weighting (ROBUST=0). Natural weighting did not seem to improve the image quality at these three frequencies, but degraded the beam and hence was not used. The 330 MHz and 240 MHz images are dynamic range limited. We have obtained a dynamic range of 2500 at 330 MHz. At 1280 MHz, a maximum uv baseline of 60 was used with natural weighting. We expect the flux density errors at all frequencies to be less than 10 %. All the images have been corrected for the gain of the primary beam.
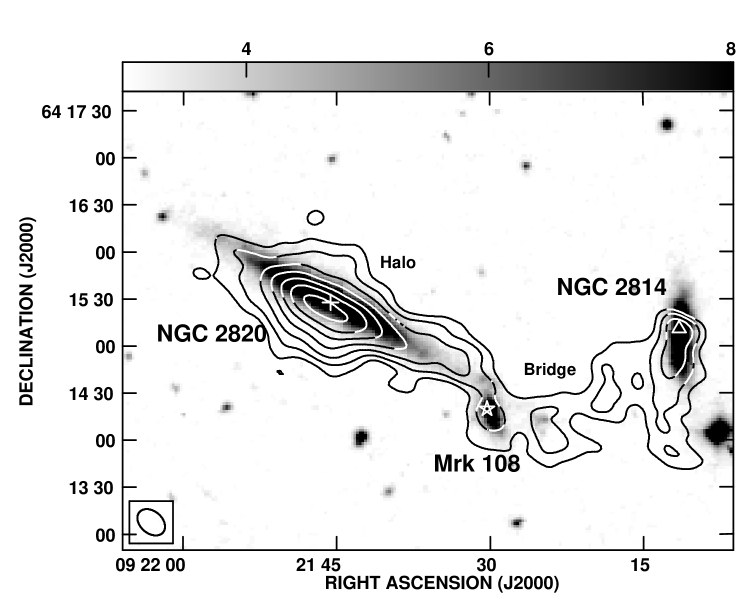
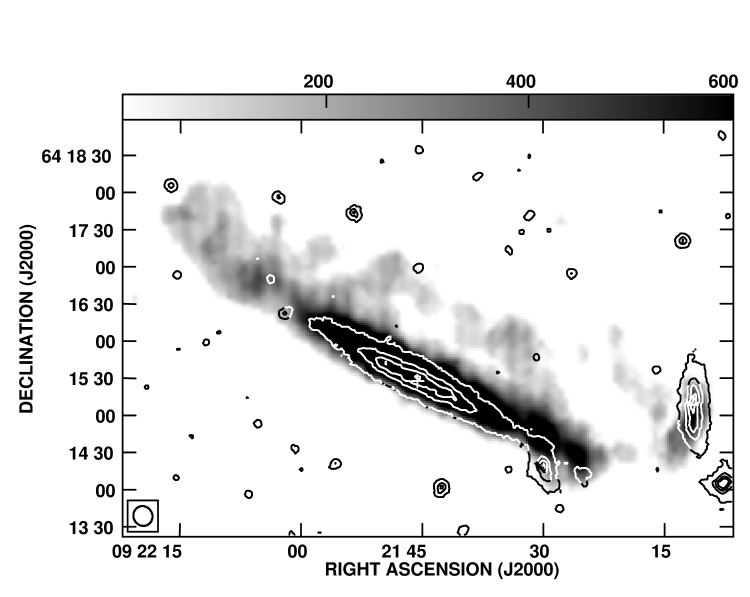
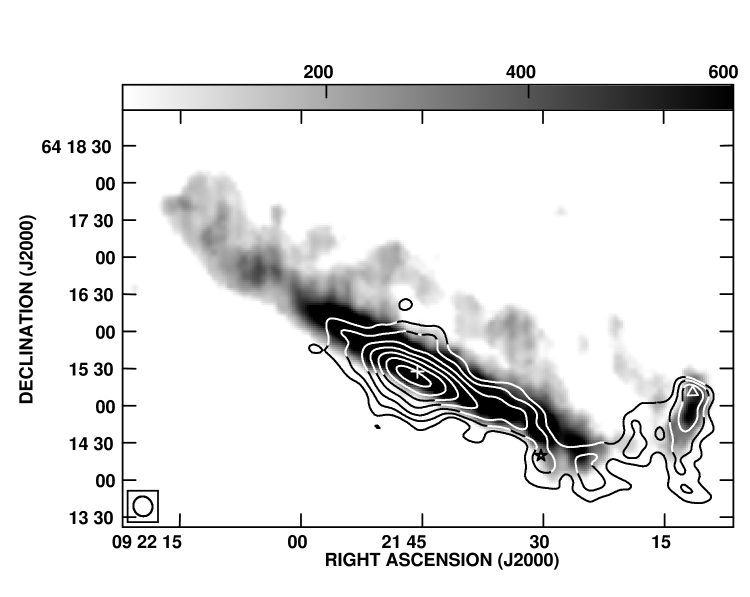
The low resolution image at 330 MHz clearly showing the bridge and the high resolution image at 1280 MHz showing fine structure in the galaxies are shown in Fig 1. The images at 240 and 610 MHz look fairly similar to the 330 MHz map and hence are not presented. We have used maps of similar resolution at 610 MHz and 330 MHz for estimating the spectral index.
We have detected the triplet in radio continuum at all the observed frequencies. Additionally, a bridge connecting the triplet is also detected at 330 MHz. This bridge was first reported by van der Hulst and Hummel (hulst (1985)) at 1465 MHz. We have marginal detection of the bridge at 610 and 240 MHz. We have verified that although some short spacings are missing at 1280 MHz, this does not completely resolve out the bridge. However, alongwith the low brightness sensitivity, this made it difficult to detect the bridge with the present data. Faint radio emission is detected at 330 MHz from NGC 2805 (see Fig 5 (b)). This emission bears little resemblance to the optical emission (see Fig 5 (b)).
The radio centre of NGC 2820, an almost edge-on galaxy with inclination (Hummel & van der Hulst hummel (1989)), coincides with the optical centre within (see Fig 1 (a)). The flux densities of the galaxies at different frequencies and the galaxy-integrated spectral index between 330 and 610 MHz are listed in Table 2.
| Galaxy | S mJy at MHz | ||||
|---|---|---|---|---|---|
| 12801 | 610 | 330 | |||
| 1 | NGC 2820+ | 35 | |||
| Mrk 108 | (4) | (4) | |||
| 2 | NGC2820 | 19.9 | 27 | ||
| peak | (0.7) | (1) | |||
| 3 | NGC 2814 | 6.7 | |||
| (1.6) | (6) | ||||
| 4 | NGC 2814 | 5.2 | 7.5 | ||
| peak | (0.7) | (1) | |||
1 the flux density of NGC 2820 at 1280 MHz that we find is lower than the value quoted by others.
Hummel & van der Hulst (hummel (1989)) estimate a flux density of mJy at 1.465 GHz
with the VLA whereas Bosma et al. (bosma (1980)) have estimated a flux density of mJy
at 21cm using the WSRT. Condon et al. (condon90 (1990)) find a flux
density of 64.2 mJy at 1.49 GHz. Since the flux density, we estimate, is lower
we do not quote the image errors which are comparatively insignificant.
Halo emission is detected around NGC 2820 at all the observed frequencies and is prominent at 330 MHz (see Fig 1 (a)) which is our most sensitive low frequency. In their study of radio emission from six edge-on galaxies, Hummel & van der Hulst (hummel (1989)), found that NGC 2820 had a radio halo with the largest z-extent (10% peak height of about 3.4 kpc) which they attributed to gravitational interaction with its companions. We find the 10% peak flux level z-extent of the radio halo is 4.2 kpc. The half power thickness of the halo is 2.2 kpc which is double the typical value. We estimated the spectral index between 330 and 610 MHz (from similar angular resolution maps) at a few positions in the halo and find it to be .
NGC 2814 shows halo emission which is tilted with respect to the stellar disk traced by the DSS optical image (see Fig 1(a)). We find that the global spectral index of the galaxy is whereas that of the radio peak is (see Table 2). It is difficult to separate the halo emission from the disk emission for this relatively small galaxy.
The radio power of NGC 2820 is Watt-Hz-1 and that of NGC 2814 is Watt-Hz-1 (estimated at 330 MHz). We also estimated the q factor which gives the ratio of FIR flux density to the radio continuum flux density at 1.4 GHz for NGC 2820 following Helou et al. (helou (1985)). We find that q for NGC 2820. This value is consistent with the quoted value for spiral galaxies of q with a rms scatter of 0.2 (Condon condon1 (1992)). Thus, NGC 2820 follows the FIR-radio correlation.
2.2 21 cm HI
The details of the 21cm HI observations are listed in Table 1. These data were initially analysed in a way similar to the continuum data sans self calibration. The continuum emission from the line data was removed and spectral channels imaged to generate a cube. We used a uv taper of and uv range of with robust weighting (ROBUST = 0) to obtain the final cube. The beamwidth is with a PA which greatly improves on the arcmin resolution of Bosma et al. (bosma (1980)).
.
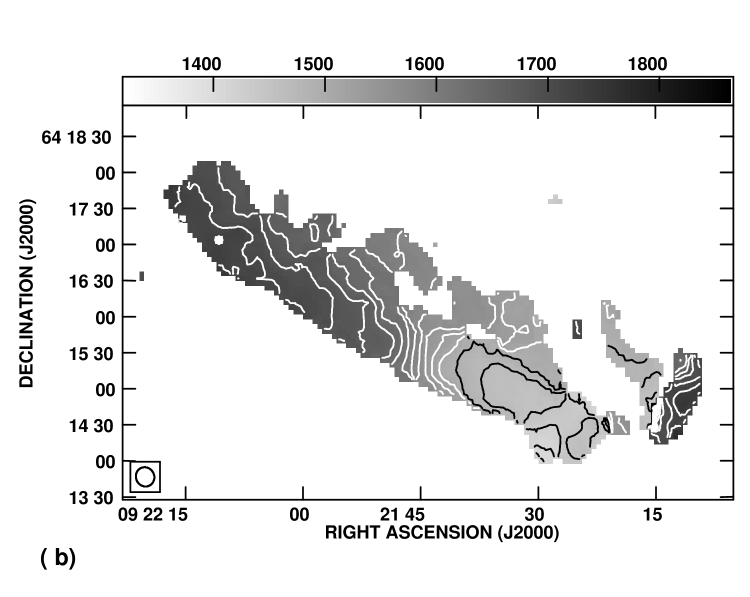
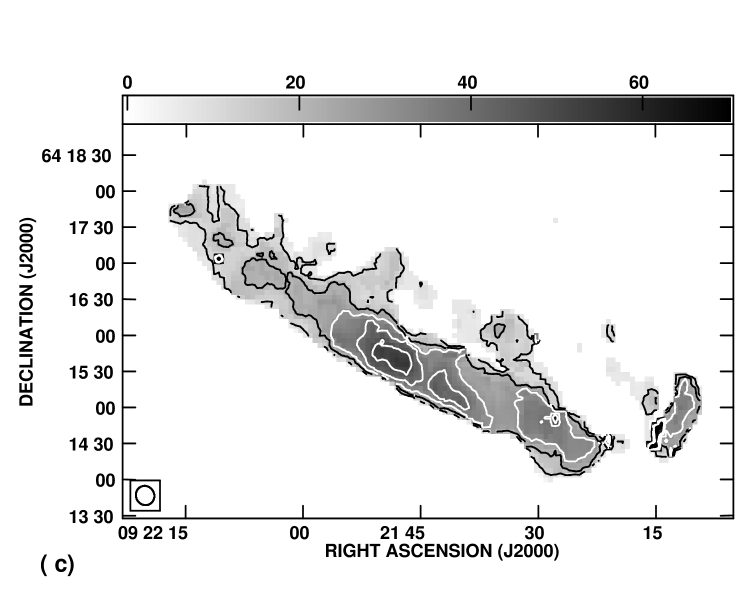
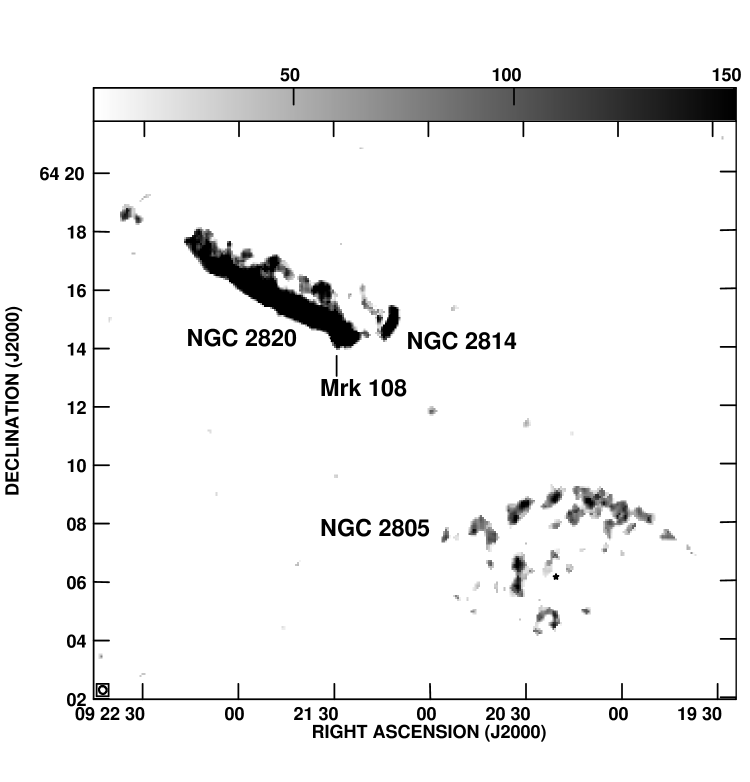
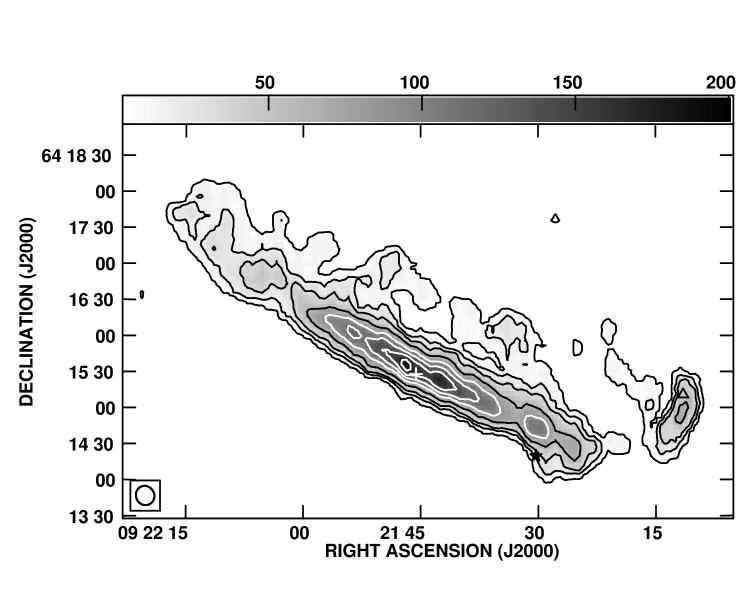
We detected HI from all members of the group. The channel maps showing HI line emission detected at different velocities for the triplet are shown in Fig 2. The column density map of the group (estimated assuming HI is optically thin along the line of sight) is shown in Fig 3. A zoomed-in HI column density map for the triplet is shown in Fig 4 (a). The first and second moment maps of HI for the line emission are shown in Figs 4 (b) and (c).
The channel maps (see Fig 2) clearly show the rotation in the disk of NGC 2820. The HI disk extends more to the northeast than in the southwest. The velocity of the gas in NGC 2820 varies from km s-1 in the north-east to km s-1 in the southwest (see Fig 4 (b)). Since the systemic velocity of the galaxy is 1577 km s-1, this gives a difference velocity of 133 km s-1 in the northeast and 134 km s-1 in the southwest. The rotation speed of the gas is fairly symmetric over the centre unlike what Bosma et al. (bosma (1980)) found. This is probably because the velocity of the HI gas in Mrk 108, which we can clearly distinguish in our maps (see Fig 2 - last two panels) due to our higher angular resolution is around 1410 km s-1 and was presumably included within the Bosma et al. (bosma (1980)) beam. It is of interest to note the nature of the isovelocity contours. In Fig 4 (b), it is seen that the contours in the northeast are different from those in the southwest and appear to be kinematically disturbed. It appears that the HI gas in the northeast has been affected by the interaction more than in the southwest. A ring of HI surrounds the optical center (see Fig 4 (a)). HI condensation is also seen near Mrk 108 and it is likely associated with a star forming region seen in the H image (see Fig 7 (c)), possibly triggered by the interaction.
HI is detected from the bridge except for a small region. The mean HI column density in the bridge is atoms cm-2.
HI emission shows interesting extraplanar features in NGC 2820. A symmetric HI loop is observed to the north of the galaxy - the channel maps (Fig 2) between 1633 km s-1 and 1525 km s-1 clearly show the presence of extraplanar features. The loop opens at the top giving it an appearance of an outflow and then seems to turn back as if the HI gas is falling back towards the disk. The loop has enormous dimensions with a width parallel to the galactic disk of about 17.5 kpc () and a height of about 4.9 kpc (). No detectable radio continuum emission is associated with the HI loop. Moreover there are a couple of other protrusions visible to the east of the large HI loop. Interestingly, no HI filaments or protrusions are observed arising from the southern side of NGC 2820 and the HI shows a smooth boundary. Similarly, we find that the HI disk and radio continuum disk of NGC 2814 are sharply truncated in the north of the galaxy whereas the optical emission extends beyond. The HI disk of NGC 2814, like the radio continuum disk, is inclined to the optical disk. A high velocity streamer is seen emerging, almost perpendicularly, from the south of NGC 2814. This streamer is fairly long, extending to the northeast. The heliocentric velocity of NGC 2814 is 1707 kms-1 whereas the streamer has a line of sight velocity range of kms-1 to kms-1. The velocity difference between the streamer and NGC 2814 is more than 200 kms-1. The streamer velocity is more in tune with the velocity field seen in the southern parts of NGC 2820.
| Parametre | NGC 2820 | Mrk 108 | NGC 2814 | NGC 2805 | streamer | HI ’blobs’ | HI Loop |
|---|---|---|---|---|---|---|---|
| Heliocentric velocity () | 1577 | 1417 | 1707 | 1745 | 1493 | 1725 | 1566 |
| Half-power width () | 350 | 52 | 136 | 99 | 72 | 42 | 137 |
| Rotation velocity () | 175 | - | - | - | - | - | |
| Inclination (∘) | 74 | - | - | 201 | - | - | - |
| Position angle (∘) | 66 | - | - | - | - | - | |
| Dynamical centre (J2000) | 09h21m45.6s | - | - | - | - | - | |
| 64d15m31s | - | - | - | - | - | ||
| Linear size () | 47.6 | 3 | 10.4 | 60 | 12.7 | 3.5 | 17.5 kpc |
| HI mass () | 6.6 | 0.061 | 0.34 | 0.13 | 0.11 | 0.6 | |
| Dynamical mass () | 170 | 0.94 | 22 | 584 | - | 1.4 | - |
| (%) | 3.9 | 6.5 | 1.5 | - | - | 7.9 | - |
The HI distribution of NGC 2805 (see Fig 5 (a)) is asymmetric with larger column densities and higher radial velocities in the northern regions as compared to the southern parts. Since this galaxy was close to the half power point of the GMRT primary beam in our 21cm HI image, we cross checked the observed morphology with the Bosma et al. (bosma (1980)) images. We find the two maps correlate well and the paucity of HI in the southern parts is real and not an artifact of the primary beam cutoff. However we are insensitive to the large scale HI emission seen from the face-on disk by Bosma et al. (bosma (1980)).
Global HI line profiles were obtained for all the galaxies and HI features. A gaussian function was fitted to the observed profiles (except for NGC 2820 which shows a classical double-humped HI profile with a sharp fall-off) and the resultant parameters were used to derive various physical quantities (Table 3). The systemic velocity, rotation velocity, inclination and dynamical centre of NGC 2820 are results from running the task, GAL in AIPS on the velocity field of the galaxy. We model the observed data with a Brandt curve purely as a fit; it reproduces the solid body rotation in the central regions fairly well. We obtain a rotation velocity of 175 km s-1 for NGC 2820. The rotation curve is shown in Fig 8. The HI mass was calculated from the velocity-integrated line strength whereas the dynamical mass was estimated using . We find that the rotation curve fit gives an inclination of and position angle of for NGC 2820. The optical heliocentric velocity of NGC 2820 is 1577 km s-1 which is in good agreement with the value of km s-1 quoted by Bosma et al. (bosma (1980)). About 4% of the total mass of NGC 2820 is in HI whereas 6.5% mass of Mrk 108 appears to be in the form of HI (Table 3). For the HI blobs, we find that about 8% of its dynamical mass is seen in the form of HI. We find that NGC 2805 is massive with a total dynamical mass of M⊙.
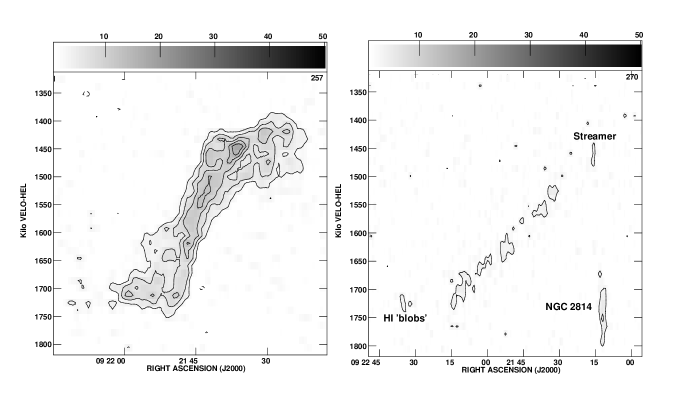
The position-velocity (PV) curves plotted along and parallel to the major axis of NGC 2820 are shown in Fig 9. Fig 9(a) shows that the gas in the central 5.8 kpc of NGC 2820 exhibits solid body rotation. Some asymmetry is visible between 1600 and 1650 km s-1. The HI blob, NGC 2814 and the streamer are shown in the PV diagram (see Fig 9 (b)) of a slice parallel to the major axis of the galaxy. The streamer is seen to be kinematically independent of NGC 2814.
3 Tidal Effects
NGC 2820 appears to have had a retrograde interaction with NGC 2814 and the two galaxies presently have a relative radial velocity of 130 km s-1. Various morphological signatures which are likely due to the tidal interaction between NGC 2820, Mrk 108 and NGC 2814 are seen in our HI moment zero and radio continuum maps. The dominant signatures in HI are the streamer apparently emerging from NGC 2814 (but showing a different velocity field), the inclined disk of NGC 2814, the bridge between NGC 2820 and NGC 2814 and the detection of HI blobs to the north-east of NGC 2820. Star formation seems to have been triggered in the disk of NGC 2820 close to Mrk 108, in Mrk 108 and in a small tail of NGC 2814 by the tidal interaction as can be identified on the H image of the triplet (see Fig 7 (c)). Moreover, Artamonov et al (artamonov (1994)) from their UBV photometric observations, report enhanced star formation in Ho 124 due to tidal interaction. The tidal features which are readily discernible in the 330 MHz map are the steep spectrum radio bridge, the tilted radio disk of NGC 2814 and a radio tail issuing from NGC 2814 and extending southwards. However, the tidal origin of HI features like the HI loop arising from the northern side of NGC 2820 and the small HI protrusions is not clear. We discuss the origin of the loop in the next section.
In this section, we briefly elaborate on some of the clear signatures of tidal interaction discernible in our images.
3.1 Tidal Bridge
van der Hulst & Hummel (hulst (1985)) were the first to detect a radio continuum bridge connecting the triplet in Ho 124 at 1465 MHz. Since then radio bridges have been detected in many other systems; a famous one being the Taffy galaxies (Condon et al. condon (1993)) in which one-half the total radio synchrotron emission of the system arises in the bridge.
As shown in Fig 1(a), we have detected the bridge connecting the triplet at 330 MHz. Using the 1465 MHz result of van der Hulst and Hummel (hulst (1985)) along with our data at 330 MHz we estimate a spectral index of for the bridge. This spectral index is much steeper than the value of quoted by van der Hulst and Hummel (hulst (1985)) which might possibly have been corrupted by disk emission at their lower frequency. At 610 MHz and 240 MHz, we report marginal detection of the bridge and the brightness of the bridge is consistent with the estimated spectral index.
We estimated the size of the bridge from our 330 MHz image. The projected linear extent of the bridge is 5.4 kpc. Our estimate of the projected length of the bridge is less than what van der Hulst & Hummel (hulst (1985)) estimated. This is likely because we have not included the source west of Mrk 108 which we believe is part of the disk of NGC 2820 and not the bridge. The width of the bridge in the sky plane is 2.1 kpc. We assumed a similar extent for the bridge along the line-of-sight. Using equipartition and minimum energy arguments, we estimated a magnetic field of G, and a minimum energy density of ergs cm-3. The minimum energy in the bridge is ergs. The magnetic pressure of the bridge is about 2600 K cm-3. We have assumed that there is 100 times more energy in protons than electrons for the above calculations. A few possible scenarios for confining the bridge were described in Ananthakrishnan et al. (ananth1 (2003)).
We detected HI in the bridge except for a small region (see Fig 4 (a)). This HI is moving at a line-of-sight velocity of about 1545 km s-1 which is different from the HI in the disk of NGC 2820 nearest to the extension of 1445 km s-1 (see Fig 4 (b)). However the velocity of HI in the bridge is closer to the systemic velocity of NGC 2820. If the gas in the bridge is moving with a velocity of 100 km s-1 (ie. km s-1) with respect to the gas in NGC 2820, then the kinematic age of the bridge is 46 million years. If the gas is moving with a velocity larger than 100 km s-1, the kinematic age will be lower. The mean column density in the bridge is cm-2. Using a line-of-sight depth of 2.1 kpc for the bridge, we find that the atomic density in the bridge is cm-3. If we assume a kinetic temperature of 5000 K, the thermal pressure of the gas in the bridge would be only 30 K cm-3 which is much less than the magnetic pressure of the bridge. We obtain a result similar to van der Hulst & Hummel (hulst (1985)) in that the magnetic field and relativistic particles moving in it seem to dominate the bridge energetics. It appears likely that the bridge is confined by an ordered magnetic field. No H emission is detected from the bridge (Gil de Paz et al. gil (2003)) (see Fig 7 (c)) indicating that star formation has not been triggered in the bridge. This is not surprising since the column density of neutral atomic matter in the bridge is fairly low. Little molecular gas is therefore likely to be present in the bridge.
3.2 Tidal Effects on NGC 2814
The disk of NGC 2814 has obviously been affected by tidal forces in its encounter with NGC 2820. The optical disk is aligned almost north-south whereas the radio continuum and HI disks are inclined towards the bridge clearly showing that they have been affected by tidal forces (see Fig 1(a) and Fig 7(a)) Also note the ’comma’-shaped HI disk and H emission of NGC 2814. The H image of NGC 2814 (see Fig 7 (c)) shows enhanced star formation in a small tail which is likely triggered by the tidal interaction. Star formation, triggered by the tidal interaction is also observed in and close to Mrk 108. A tail is observed in the radio continuum issuing and extending to the south of NGC 2814 (see Fig 1 (a)). The spectral index of this tail is and the tail is likely a result of the tidal interaction.
3.3 Tidal streamer
A HI streamer is observed to arise from the southern end of NGC 2814 and extend towards the north-east (see Fig 4 (a)) but which is kinematically distinct from the galaxy. The different velocities (difference of about 200 kms-1) support a projection effect. A velocity gradient of about 5.3 km s-1 kpc-1 is observed along the streamer. We note that the velocity field seen in the streamer matches the velocities seen on the closer side of NGC 2820 and intriguingly the shape of the tail matches the outer edge of NGC 2820. We believe that the streamer is HI gas which has been stripped off NGC 2820 during the tidal interaction. Since we do not see an extra radial velocity that the streamer might have picked up during the tidal encounter, it might be in motion in the sky plane. If we assume that the streamer was dislocated from NGC 2820 and picked up a velocity of km s-1 due to the tidal interaction, then it would have taken about 40 million years for the streamer to be at its current position. The average column density in the streamer is cm-2 and the mass is . The length of the streamer in the sky plane is about 12.6 kpc.
3.4 A tidal dwarf galaxy ?
The HI blobs (see Fig 6 (a)) detected to the north-east of NGC 2820 contain about of HI. One possibility to explain these blobs is that it is a tidal dwarf galaxy. It would be interesting to obtain a deep H image of this region and check this possibility. The spectrum integrated over the blobs is shown in Fig 6(b). No rotation is discernible in the blobs. We do not find any optical counterparts to the blobs in the DSS images. The HI velocity field of the blobs is a continuation of the velocity field seen in the north-east tip of NGC 2820 probably indicating its origin. The blobs are located about 11.5 kpc away from the north-east tip of NGC 2820.

4 The HI Loop

A large one-sided HI loop is detected to the north of NGC 2820. The loop extends out to about 4.9 kpc along the rotation axis of the galaxy and has a lateral dimension of about 17.5 kpc. No counterpart is detected in the south of the galaxy. Moreover, we do not detect any radio continuum from the loop and no H emission is seen to be associated with the loop. In this section, we examine three possible scenarios for the origin of the HI loop, namely a) starburst driven superwind b) ram-pressure stripped HI and c) tidally stripped HI. We look for an origin which can explain the observed constraints: 1) the absence of H and radio continuum in the loop 2) the one-sided nature of the loop 3) the symmetry of the loop about the rotation axis. Study of the velocity field of the HI loop gives the following inputs to the above scenarios: 1) The HI loop is trailing the disk rotation. The radial velocity at the top of the loop is close to the systemic velocity of the galaxy (see Fig 4 (b)). 2) The line width increases along the loop and is largest at the top of the loop (see Fig 4 (c)). 3) The global HI profile and the HI profile of the loop are centred on the systemic velocity of the galaxy and show no tail-like feature indicating that no gas is moving along the line of sight.
4.1 Starburst driven superwind
Gas is driven out of the disk by the underlying starburst to tens of kpc from the disk along the minor-axes and is known as superwind. Superwind cones are commonly observed in X-rays, radio continuum and H but infrequently in HI. In case of NGC 253, HI has been observed to be confined within the optical disk and to outline the superwind cone of ionized gas in one half of the galaxy (Boomsma et al. boomsma (2004)). Another study has shown that significant amounts of HI is observed to be in the halos of spiral galaxies with active star formation Fraternali et al. (fraternali (2001)). In case of NGC 2820, the HI halo is not observed to be significantly larger than the optical disk (see Fig 7(a)). Anyway, here, we examine the possibility of the large HI loop that we observe in NGC 2820 being a superwind and estimate its energetics.
The mass of the HI loop is and the full width at zero intensity of the HI line is 160 km s-1. Assuming HI to be flowing along the surface of a superwind bi-cone of half angle , the deprojected outflow velocity is 113 km s-1. The kinetic energy contained in the outflowing HI is ergs and the dynamical age of the outflow is 34.7 million years.
We compare this with the energy contained in the supernovae in NGC 2820 to examine the feasibility of this scenario. We follow Condon (condon1 (1992)) and use the non-thermal radio continuum emission from the central parts of NGC 2820 to estimate a supernovae rate of per year. This rate is fairly low compared to typical superwind galaxies e.g. 0.1 supernovae per year in NGC 1482, M82 and 0.1 to 0.3 in NGC 253.
If the kinetic energy imparted to the interstellar medium by a single supernova explosion is ergs, then the kinetic energy available during the dynamical age of the outflow is ergs. However, note that the starburst would also drive other phases of the interstellar medium into the halo and hence only about of the estimated kinetic energy will be seen in HI. In this case, the energy available in the supernovae is at best comparable to the kinetic energy of the HI loop. We arrive at a kinetic energy within a factor of few higher from the above if we include the energy due to the stellar winds from massive young stars. This was estimated from the total FIR luminosity of NGC 2820 following the method by Heckman et al. (heckman (1990)).
Even if the energetics just about satisfy the starburst-driven origin of the loop, we note several reasons below why we do not favour this scenario: (a) No H emitting gas is found along the HI loop unlike superwind galaxies. (b) NGC 2820 is not classified as a starburst galaxy and does not show any obvious signatures of being a starburst galaxy. (c) No HI loop of such large dimensions appears to have been observed in any superwind galaxy. (d) The HI loop is one-sided. The starburst process which can drive such a large loop in one direction should be energetic enough to drive it in the other direction also.
4.2 Ram pressure stripping
In this subsection, we examine the scenario of the observed HI loop as being the stripped HI from NGC 2820 due to ram pressure (Gunn & Gott gunn (1972)) exerted by the IGrM. The reason we examine this possibility is the presence of a few interesting features in the group members. Firstly the southern edge of NGC 2820 shows a sharp cutoff in HI whereas the radio continuum extends beyond this cutoff (see Fig 7 (b)). Secondly the northern part of NGC 2814 shows a sharp cutoff both in radio continuum and HI whereas the optical disk does not show any such effect. Since ram pressure is expected to distort the various disk components differently (Davis et al. davis (1997)) and the sharp edges can be caused by swept-back material due to ram pressure, we tend towards interpreting the above features to be a signature of ram pressure of the IGrM.
Thus it appears that ram pressure could have played an important role in the evolution of the group. Hence, we examine the case of the HI loop seen to the north of NGC 2820 being a result of ram pressure stripping. We compare the pressure due to the IGrM as the galaxy moves in it and the gravitational pressure of the disk of NGC 2820. The relevant equation given by Gunn & Gott (gunn (1972)) is
(kg m-1 s-2)
where is the IGrM mass density, is the velocity dispersion of the group, G is the gravitational constant, is the surface mass density of stars, is the surface mass density of gas. The line of sight velocity dispersion (Osmond & Ponman osmond (2004)) of this group is km s-1. No X-ray emission has been detected from this group and the upper limit on the bolometric X-ray luminosity is erg s-1 (Mulchaey et al. mulchaey (2003)). If we assume that the temperature of the IGrM in this late-type group is K (Mulchaey et al. 1996b ) and the medium is distributed over a sphere of radius 50 kpc, then we arrive at upper limits on the electron density of cm-3 and mass of M⊙. We assume a IGrM density of cm-3 (well within the upper limit) and using v (Sarazin sarazin (1986)) we calculate a ram pressure of kg m-1 s-2.
We find an average stellar mass density of 133 pc-2 in the central 10 kpc region of NGC 2820 using the inclination-corrected total B-band magnitude and the average (light to mass ratio) factor given by Binney and Merrifield (binney (1998)). For cm-2, the surface mass density of HI is 0.32 pc-2. These give the gravitational pressure of the disk to be to be kgm-1s-2. This is comparable to the ram pressure acting on the system. If we estimate the gravitational pressure of the disk in the outer regions by using the stellar mass density at the 25 mag-asec-2 diametre (15.25 M⊙ pc-2), which is close to where the loop is seen to emerge from the disk, then we find that the ram pressure exceeds the gravitational pressure of the disk by a factor of few. However this does not take into account the influence of dark matter in the outer regions.
Mulchaey et al. (mulchaey2 (1996), mulchaey (2003)) have concluded from their X-ray observations of many poor groups that the X-ray luminosity of the IGrM of groups with only late-type galaxies is lower than if the group has at least one early-type member. They infer that the late-type-only groups might have a lower temperature or a lower density. Our results seem to indicate that the IGrM should have densities that are almost sufficient to morphologically influence NGC 2820. Thus, the densities should not be too low () to be inconsequential.
Assuming ram pressure has played a role in giving rise to the loop, we outline two possible ways in which the loop could have formed.
Model 1:
NGC 2820 has been classified as a barred galaxy (Bosma et al. bosma (1980)). Many barred galaxies show concentration of HI at the edge of the bar and the loop like structure could be due to the neutral gas from this region being stripped off in its interaction with the IGrM. In this scenario, the stripped HI lies well within the disk, just below the loop. The rotation of the disk causes a twist in the flow. Since HI in this region is likely to be strongly bound to the disk, this model requires extensive help from tidal effects in reducing the surface density of the neutral gas. The kinematic features can be explained as: the trailing velocity field could be due to a combination of vertical motion of gas stripped from different regions in the disk combined with twisting due to galactic rotation. The wider lines at the top of the loop could be because of gas acquiring higher random motions. The central hole in the loop is expected since ram pressure cannot strip the high density neutral gas in the central regions.
Model 2:
The alternate scenario is that HI has been stripped from the edges of the outermost spiral arms - one towards us and the other away from us. Since NGC 2820 is an almost edge-on galaxy, this model is not distinguishable from the above. This model can also explain the observed kinematic features of the loop. The trailing velocity field will be due to the rotation velocity of the gas in the outer spiral arms which might not be the tangent points for those lines of sight. The large line widths would again result from increased random motion as the stripped gas meets the IGrM. However given sufficient time, the central hole in HI should get filled up in this model.
With the present data, we cannot distinguish between the two models.
We estimate a velocity width of about 80 km s-1 along the loop. This radial velocity is possibly dominated by rotation since NGC 2820 is a highly inclined galaxy. However, if we assume this to be the outflow velocity then for a loop height of 4.9 kpc, this translates to an age of 60 million years.
Notice that the HI after reaching a certain height seems to be falling back towards the disk (see Fig 4 (a)). Vollmer et al. (vollmer (2001)) in their simulations for investigating the role of ram pressure stripping in the Virgo cluster have found that ram pressure can cause a temporary increase in the central gas surface density and in some cases even lead to a significant fraction of the stripped off atomic gas to fall back onto the disk. Such a process could be active in the case of NGC 2820.
4.3 Tidal stripping
Interaction usually creates irregular morphology and tidal tails that can stretch the spiral arms. The shape of the parent galaxy and the tidal tails can assume a variety of shapes after the interaction (for example, see simulations by Toomre & Toomre toomre (1972), Barnes barnes (1988), Howard et al. howard (1993)). The members of Ho 124, especially the triplet, have undergone close encounters which is evident from the numerous tidal features seen in the system as described in section 3. However it is not clear how tidal interaction alone can give rise to the HI loop as observed in NGC 2820. If one assumes that all the HI features seen to the north of the disk of NGC 2820 ie. the warped extension, the small protrusions, the loop and the streamer are parts of a tidal tail, it is difficult to explain the origin of such a large distortion (stripped HI mass M⊙) due to a retrograde interaction with a galaxy (NGC 2814) whose HI content is less than that in the HI loop. Moreover no such tail is visible in the opposite direction which such a strong tidal interaction should have produced. Thus, it appears unlikely that the loop is a result of tidal interaction alone. But on the other hand evolution of the system has obviously been affected by tidal interactions e.g. Artamonov et al. artamonov (1994) note enhanced star formation due to the tidal interaction. Hence any model that explains the HI loop should include tidal interaction. However it is beyond the scope of this paper to make any quantitative estimates of the tidal interaction which require detailed simulations.
We suggest that the loop could have been created by the combined effect of ram pressure and tidal forces acting on NGC 2820.
5 Discussion
In this paper, we have described four main results arising from our observations, (i) the steep radio continuum bridge between the triplet, (ii) the sharp cutoffs in different galactic constituents observed in three members of the group, (iii) one-sided HI loop in NGC 2820 and (iv) various signatures left behind by the tidal interaction. HI is detected from the bridge with a mean column density of cm-2. The bridge has a steep synchrotron spectrum with a spectral index of and hence has large energy losses caused by synchrotron and/or inverse Compton processes or a steep electron spectrum. From equipartition arguments, we find that relativistic particles and magnetic field dominate the bridge evolution. It contains a small fraction of the total sychrotron emission in the system and it is interesting to contrast it with the Taffy galaxies in which the bridge emission constitutes half of the total synchrotron emission in the system (Condon et al. condon (1993)).
A sharp cutoff in HI (see Fig 3 & Fig 5 (a)), radio continuum (see Fig 1 (a)) or optical blue band (see Fig 5) is clearly evident in three members of Ho 124. The fourth member (Mrk 108) is small and too tidally disrupted. The above is schematically summarized in Fig 10. We suggest that the sharp boundaries are caused by motion of the galaxies in the IGrM. In the case of NGC 2814, the optical disk appears to be viewed edge-on with zero position angle and the compression in radio continuum and HI is seen to be perpendicular to the major axis of the disk in the north in the sky plane. Moreover the radio continuum and HI are confined to well within the optical disk. In NGC 2820, the HI in the southern side is sharply truncated. The interaction between the triplet appears to have left behind a trail of tidal debris like the streamer, the HI blobs and the radio continuum tail of NGC 2814. The HI loop could be a result of both tidal effects and ram pressure. If the tidal effects have reduced the surface density of HI in the disk of NGC 2820, then ram pressure of the IGrM should have been able to strip the outlying HI giving rise to the HI loop. The solid arrows near NGC 2820 and NGC 2814 in Fig 10 indicate the direction of motion of those galaxies as we can deduce in the sky plane from the sharp truncations. However, the ambiguity of the sharp cutoff in HI in the north and the enhanced star formation in the south of NGC 2805 makes its direction of motion in the IGrM ambiguous. If we interpret the star formation ridge to be due to the interaction with IGrM, then NGC 2805 appears to be moving towards the south-west. If this is true then the three galaxies seem to be moving in different directions. However if we interpret the sharp HI boundary in the north of NGC 2805 as due to ram pressure, then the galaxy is moving towards the north. In short, we cannot comment on the direction of motion of NGC 2805 from the existing observations.

We compared the ram pressure and the equivalent pressure in the different phases of the interstellar medium in NGC 2820 to examine its effect on different constituents of the medium which show distinct morphologies and hence understand the observational picture sketched in Fig 10. Assuming a typical particle density of cm-3 for the IGrM, we estimated a ram pressure of 4170 cm-3 K for the IGrM. We estimate a magnetic pressure cm-3 K in the radio continuum halo. The two pressures are comparable. For the H seen in the extended-diffuse ionized gas (e-DIG), Miller & Veilleux (miller (2003)) estimate an emission measure of about 8 pccm-6 and a size of 2 kpc. If we assume a filling factor of 0.1 (see Fig 10 in Miller & Veilleux (miller (2003))) for e-DIG then for a temperature of K, the pressure in the gas is 2000 cm-3 K and the difference by a factor of two could easily be due to an incorrect filling factor assumed by us. The pressure in the e-DIG is also comparable to the ram pressure. Lastly we estimate the pressure in the HI gas. Since the sharp edge in HI is unresolved by our beam, we used a column density of cm-2 (the second contour) to estimate an atomic density of cm-3 for a volume filling factor of 0.4 (taken from our Galaxy for warm neutral medium). If we use a temperature of 5000 K which is typical of the warm neutral medium in our Galaxy, then the pressure is 100 cm-3 K. The HI pressure is significantly lower than the ram pressure due to the IGrM. Thus we can understand the observed picture where HI has a swept-back appearance in the south of NGC 2820 which could be due to ram pressure affecting whereas the radio continuum and H seem to extend out beyond HI and are either expanding or in pressure equilibrium with the IGrM. For this the galaxy should be in motion along the south-west as shown by the solid arrow in Fig 10.
The HI distribution in NGC 2805 is asymmetric with enhanced column densities in clumps towards the north (see Fig 5 (a)). The HI is extended east-west along the highly-disturbed northern optical spiral arm and is confined to the optical disk. The radio continuum emission in NGC 2805 is fairly weak (see Fig 5 (b)), with localised peaks in the south and northeast, and bearing little resemblance either to the optical or to the HI distribution. The central region of the galaxy is bright in the JHK near-IR bands and in the optical band but faint in radio continuum (Fig 5 (b)) which is intriguing. In short, this massive galaxy appears to be highly disturbed, the reason for which is not clear from existing observations.
Thus, we end with a picture (somewhat speculative) of this group as derived from the present and other existing observations as shown in Fig 10. NGC 2820 has probably undergone a retrograde tidal encounter with NGC 2814 which has left behind a trail of tidal debris. A HI streamer probably detached from NGC 2820 is seen projected onto NGC 2814 (see Fig 10) but is kinematically distinct from NGC 2814. The interaction has also probably given rise to a bridge connecting the two galaxies and a tail of radio continuum emission in the south of NGC 2814. Star formation has been triggered in south-west parts of the disk of NGC 2820, in Mrk 108 and in the southern parts of NGC 2814 (see Fig 7 (c)). Using about half the upper limit on the electron density estimated from the upper limit on the X-ray emission (Mulchaey et al. mulchaey (2003)), we estimate the ram pressure force of the IGrM to be comparable to the gravitational pull of the disk of NGC 2820. Since tidal interaction has obviously influenced the group, we suggest that the loop could have formed by ram pressure stripping if tidal effects had reduced the surface density of HI in NGC 2820. We suggest that the HI loop which is several kpc high and across could have been produced by the combined effects of ram pressure and tidal forces. Moreover we find sharp truncations to the HI in some of the group members which we believe supports the ram pressure explanation. If we assume that this is true then NGC 2814 is probably moving towards the north and NGC 2820 towards moving in the south-east direction (solid arrows in Fig 10). From the existing observations there is ambiguity in the direction of motion of NGC 2805. Considering all this, we suggest that the group evolution is being influenced by both tidal forces due to the mutual interactions and ram pressure due to the motion of the galaxies in an IGrM.
Since the IGrM is not detected in X-rays (Mulchaey et al. mulchaey (2003)) but we tend to believe shows detectable effect on the galaxies in Ho 124, we suggest that the IGrM densities in this group should not be too low. Mulchaey et al. (mulchaey2 (1996),mulchaey (2003)) have suggested that the non-detection of X-rays in late-type groups could be due to lower temperatures or densities. The detection of a 0.2 keV (Wang & McGray wang (1993)) IGrM in the Local group which is a late-type group indicates that such groups do have a IGrM. It is more difficult to detect lower temperature gas in groups for several reasons like the enhanced absorption of such soft X-rays by galactic HI and the increased strength of the X-ray background. One clearly needs to explore other avenues of detecting this gas.
6 Summary
-
•
We detect the faint radio continuum bridge at 330 MHz connecting NGC 2820+Mrk 108 with NGC 2814 which was first detected by van der Hulst & Hummel (hulst (1985)) at 1465 MHz. The bridge has a a spectral index of which is steeper than the quoted by van der Hulst & Hummel (hulst (1985)). HI is detected from most of the bridge at a velocity close to the systemic velocity of NGC 2820 and has a mean column density of cm-2. No H emission is associated with the bridge.
-
•
We detect radio contiuum from all the members of the group. A radio halo is clearly detected around NGC 2820 in the radio continuum with a peak flux density extent of 4.2 kpc at 330 MHz and a spectral index of . A radio halo is also detected around NGC 2814. The radio continuum at 330 MHz from NGC 2805 is fairly weak bearing little resemblance to either the HI distribution or the optical emission. The centre of the galaxy is intriguingly faint.
-
•
HI is detected from all the galaxies in the group. The heliocentric systemic velocity of NGC 2820 is 1577 km s-1 and its rotation velocity is 175 km s-1. The linear extent of the HI disk of NGC 2820 is about 48 kpc and its HI mass is M⊙. The HI emission associated with Mrk 108 is clearly detected at 1417 km s-1 and it encloses a HI mass of M⊙.
-
•
We detect various tidal features close to NGC 2814. The radio continuum disk and HI disk of NGC 2814 are tilted with respect to the optical disk. A HI streamer is seen to emerge from the south of NGC 2814 but the two are are kinematically distinct. The velocity field of the streamer is similar to parts of NGC 2820 close to it. The streamer has a sky plane extent of 12.6 kpc and encompasses an HI mass of M⊙. A tail emerging from the south of NGC 2814 and extending westwards is detected in the radio continuum. The tail has a spectral index of .
-
•
We detect HI gas located about 11.5 kpc to the north-east of NGC 2820 whose dynamical mass is M⊙ and which might possibly be a tidal dwarf galaxy. However, deep H observations are required to confirm this. The velocity of this gas is similar to the velocity field of the part of NGC 2820 closest to it.
-
•
We observe a sharp cutoff in HI on the southern rim of NGC 2820 and a sharp truncation in HI and radio continuum to the north of NGC 2814. We suggest that these features could be a result of ram pressure due to motion of the galaxies in the IGrM along the solid arrows shown in Fig 10 since simple estimates of pressure in different components of the interstellar medium in NGC 2820 suggest that ram pressure exceeds the pressure in HI by a factor of many. However this needs to be verified.
-
•
We report detection of a gigantic HI loop arising to the north of NGC 2820. The loop is kpc across and rises up to kpc. It encompasses an HI mass of M⊙. No radio continuum or H emission is associated with this loop. We present possible origin scenarios which include a central starburst, ram pressure stripping and tidal stripping. We do not favour a central starburst mainly because of the absence of detectable ionized gas in the loop. We tend to favour the ram pressure scenario. Using the upper limit on the X-ray luminosity from Ho 124 (Mulchaey et al. mulchaey (2003)), we estimate an upper limit on the electron density of cm-3. Our calculations using half this electron density show that ram pressure force of the IGrM is comparable to the gravitational pull of the disk. Hence we suggest that this loop could have been formed due to ram pressure stripping if tidal forces had reduced the surface density of HI in NGC 2820.
-
•
The group under study exhibits multiple signatures of tidal interaction and possibly ram pressure. Thus, we suggest that the evolution of Ho 124 may be governed by both tidal interaction and ram pressure due to the motion of the galaxies in the IGrM.
Acknowledgements.
We thank the staff of the GMRT that made these observations possible. GMRT is run by the National Centre for Radio Astrophysics of the Tata Institute of Fundamental Research. This research has made use of the NASA/IPAC Extragalactic Database (NED) which is operated by the Jet Propulsion Laboratory, California Institute of Technology, under contract with the National Aeronautics and Space Administration. The Digitized Sky Survey was produced at the Space Telescope Science Institute under U.S. Government grant NAG W-2166. The images of these surveys are based on photographic data obtained using the Oschin Schmidt Telescope on Palomar Mountain and the UK Schmidt Telescope. The plates were processed into the present compressed digital form with the permission of these institutions. NGK acknowledges a discussion with Amitesh Omar. We thank D. J. Saikia for going through the manuscript and providing useful inputs. We thank the anonymous referee for comments which have helped improve the paper.References
- (1) Ananthakrishnan, S., Kantharia, N. G., Nityananda, R., 2003, BASI, 31, 421
- (2) Ananthakrishnan, S., & Rao, A. P. 2002, Multicolour Universe. In International conference on Multi Colour Universe, ed. R. Manchanda & B. Paul, 233
- (3) Artamonov, B. P., Bruevich, V. V., Popravko, G. V. 1994, A Rep, 38, 597
- (4) Barnes, J. E. 1988, ApJ, 331, 699
- (5) Binney, J. & Merrifield, M. 1998, Galactic Astronomy, Princeton University Press
- (6) Bland, J. & Tully, R. B. 1988, Nature, 334, 43
- (7) Boomsma, R., Osterloo, T. A., Fraternali, F., van der Hulst, J. M., Sancisi, R. 2004, astro-ph/0410055.
- (8) Bosma, A., Casini, C., Heidmann, J., van der Hulst, J. M., van Woerden, H. 1980, A&A, 89, 345 astro-ph/0406169
- (9) Braine, J., Davoust, E., Zhu, M., et al.. 2003, A&A, 408, l13
- (10) Clemens, M. S., Alexander, P., Green, D. A. 2000, MNRAS, 312, 236
- (11) Condon, J. J. 1992, ARA&A, 30, 575
- (12) Condon, J. J., Helou, G., Sanders, D. B., Soifer, B. T. 1990, ApJS, 73, 359
- (13) Condon, J. J., Helou, G., Sanders, D. B., Soifer, B. T. 1993, AJ, 105, 1730
- (14) Davis, D. S., Mulchaey, J. S., Henning, P. A., 1997, AJ, 114, 613
- (15) Fraternali, F., Oosterloo, T. A., Sancisi, R., van Moorsel, G. 2001, ApJ, 562, L47
- (16) Gil de Paz, A., Madore, B. F., Pevunova, O., 2003, ApJS, 147, 29
- (17) Gunn, J. E., & Gott III, J. R. 1972, ApJ, 176,1
- (18) Heckman, T. M., Armus, L., Miley, G. K., 1990, ApJS, 74, 833
- (19) Helou, G., Soifer, B. T., Rowan-Robinson, M. 1985, ApJ Lett., 298, L7
- (20) Howard, S., Keel, W. C., Byrd, G., Burkey, J. 1993, ApJ, 417, 502
- (21) van der Hulst, J. M., & Hummel, E. 1985, A&A, 150, l7
- (22) Hummel, E., & van der Hulst, J. M. 1989, A&AS, 81, 51
- (23) Miller, S. T. & Veilleux, S. 2003, ApJS, 148, 383
- (24) Mulchaey, J. S., David, D. S., Mushotzky, R. F., Burstein, D. 1993, ApJ, 404, L9
- (25) Mulchaey, J. S., David, D. S., Mushotzky, R. F., Burstein, D. 1996, ApJ, 456, 80
- (26) Mulchaey, J. S., Mushotzky, R. F., Burstein, D., David, D. S. 1996b, ApJ, 456, L5
- (27) Mulchaey, J. S., David, D. S., Mushotzky, R. F., Burstein, D. 2003, ApJS, 145, 39
- (28) Mulchaey, J. S. 2004, in Clusters of Galaxies: Probes of Cosmological Structure and Galaxy Evolution from the Carnegie Observatories Centennial Symposia, Carnegie Observatories Astrophysics Series, Vol 3 ed: J. S. Mulchaey, A. Dressler, A. Oemler, Cambridge Univ. Press, 354
- (29) Osmond, J. P. F., & Ponman, T., 2004, MNRAS, 350, 1511
- (30) Sarazin, C. L. 1986, Revs of Mod Phys, 58, 96
- (31) Swarup, G., Ananthakrishnan, S., Kapahi, V., et al. 1991, Current Science, 60, 95
- (32) Toomre, A., & Toomre, J. 1972, ApJ, 178, 623
- (33) Vollmer, B., Cayatte, V., Balkowski, C. 2001, ApJ, 561, 708
- (34) Wang, Q. D. & McCray, R. 1993, ApJ, 409, L37