The Broad-Band Spectrum and Infrared Variability of the Magnetar AXP 1E 1048.15937
Abstract
We present photometry of the Anomalous X-ray pulsar 1E 1048.15937 in the infrared and optical, taken at Magellan and the VLT. The object is detected in the I, J and K bands under excellent conditions. We find that the source has varied greatly in its infrared brightness and present these new magnitudes. No correlation is found between the infrared flux and spin-down rate, but the infrared flux and X-ray flux may be anti-correlated. Assuming nominal reddening values, the resultant spectral energy distribution is found to be inconsistent with the only other AXP SED available (for 4U 0142+61). We consider the effect of the uncertainty in the reddening to the source on its SED. We find that although both the X-ray and infrared fluxes have varied greatly for this source, the most recent flux ratio is remarkably consistent with what is is found for other AXPs. Finally, we discuss the implications of our findings in the context of the magnetar model.
1 Introduction
Over the last decade or so, evidence has been mounting for the existence of a class of neutron stars called the magnetars (Thompson & Duncan, 1996). They have enormous external magnetic fields of order G (and even larger internal field), the decay of which powers luminous high energy radiation. Examples of this type of astrophysical source are the Soft Gamma-ray Repeaters (SGRs), which give sporadic bursts of hard X-ray/soft gamma rays as well as rare, very luminous (erg) “giant flares”; and the Anomalous X-ray Pulsars (AXPs), so called because their luminosity far exceeds the spin-down value, and no binary companion is seen. This implies that the source of power cannot be rotational energy and that accretion is excluded. Both the SGRs and AXPs have spin periods of order s and derivatives , and are inferred to be young from their energetics and spin-down, and from supernova remnant associations in some cases. The two groups have been linked by the discovery of persistent emission from SGRs that is similar to the AXPs and bursting behaviour in the AXPs. See Woods & Thompson (2004) for a review.
It is with the discovery of optical and infrared counterparts (Hulleman et al., 2000) that models for AXPs other than the magnetar became untenable. Hulleman et al. (2004) were the first to produce a spectral energy distribution for the AXP 4U 0142+61, showing an intriguing hint of a spectral feature: a sharp break in the optical. Furthermore, Kern & Martin (2002) discovered, optical pulsations with pulsed fraction of the order 25%, modulated at the X-ray period.
Although in the magnetar model all the details are not yet ironed out, it does explain how such emission can arise from cyclotron emission by ions in the outer magnetosphere (Thompson, 2004, priv. comm.; Thompson, Lyutikov & Kulkarni, 2002). From the magnetar theory, it is not entirely clear whether one would expect the X-ray and infrared fluxes to be correlated. Such a relationship has been seen for the AXP 1E 2259+586, which has recently been shown to have correlated X-ray and infrared fluxes following an X-ray bursting episode (Tam et al., 2004). The return to the quiescent flux was found to occur on the same time-scales in both bands, and the flux ratio to remain roughly constant throughout the active episode.
1E 1048.15937, is a 6.4s AXP in the field of the Carina Nebula, one of the two AXPs to have shown SGR-like outbursts to date and also the most noisy in terms of its timing characteristics (Kaspi et al., 2001; Gavriil, Kaspi & Woods, 2002). This, as well as its relatively hard spectrum, make it the most SGR-like of the AXPs (Woods & Thompson, 2004). A possible infrared counterpart to 1E 1048.15937 was observed by Wang & Chakrabarty (2002; henceforth WC02), who found the magnitudes: , and . Intriguingly, the source was not detected by Israel et al. (2002) down to limits of , and . Ergo the object is highly variable, and therefore of particular interest.
Here we present further deep photometry in both the optical and the infrared, showing detections in three bands at levels far fainter than those of WC02, but consistent with Israel et al.’s limits. It may be that WC02 observed the object in a state similar to 1E 2259+586 in which its infrared flux was enhanced because of a preceding outburst. If so, this work probably shows the spectral energy distribution of the object in its quiescent phase.
Below, we will first present imaging observations performed at the VLT and Magellan, and describe their analyses. Next, we describe the implications of these in three main areas: the variability, spectral energy distribution, and X-ray to infrared flux ratio. We conclude with a brief discussion.
2 Observations and Analysis
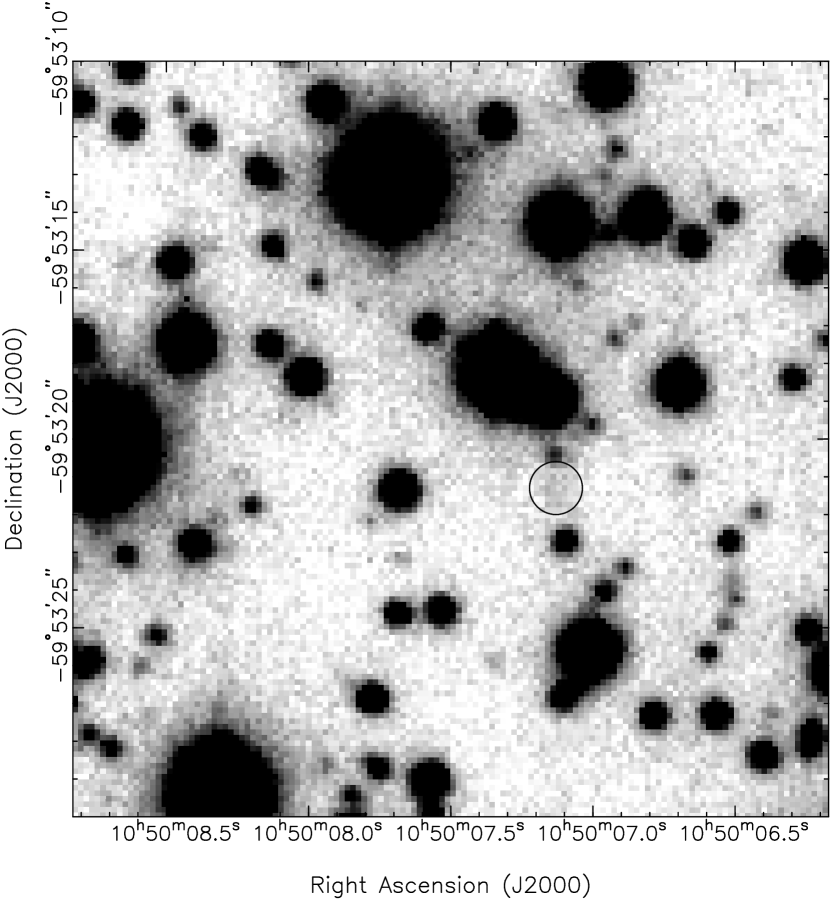
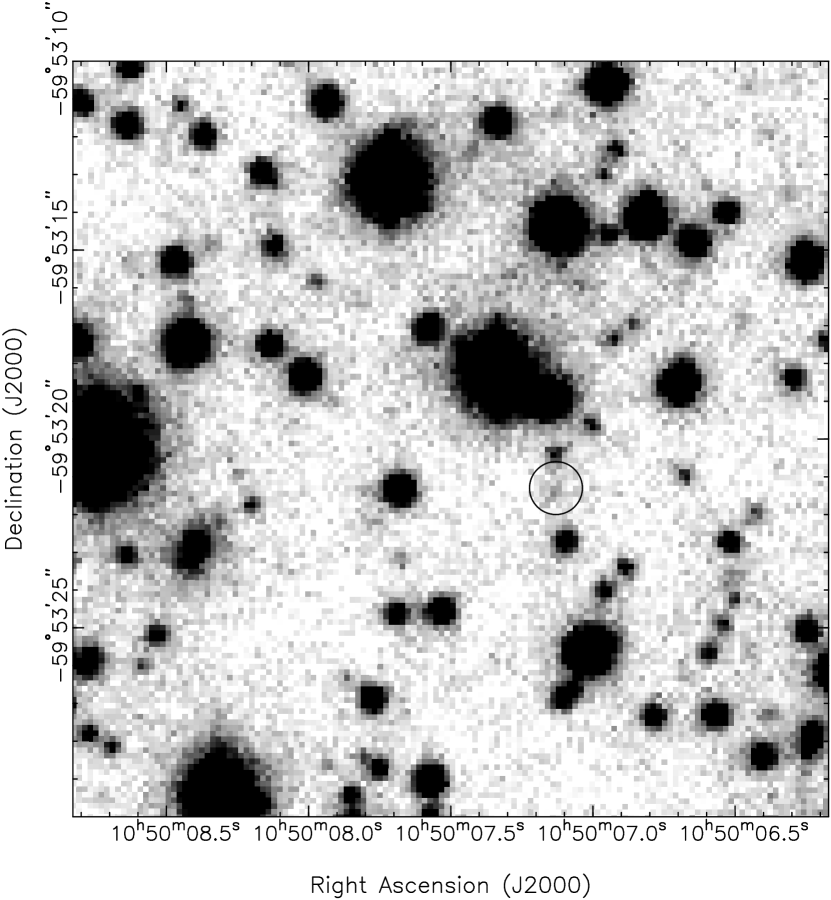
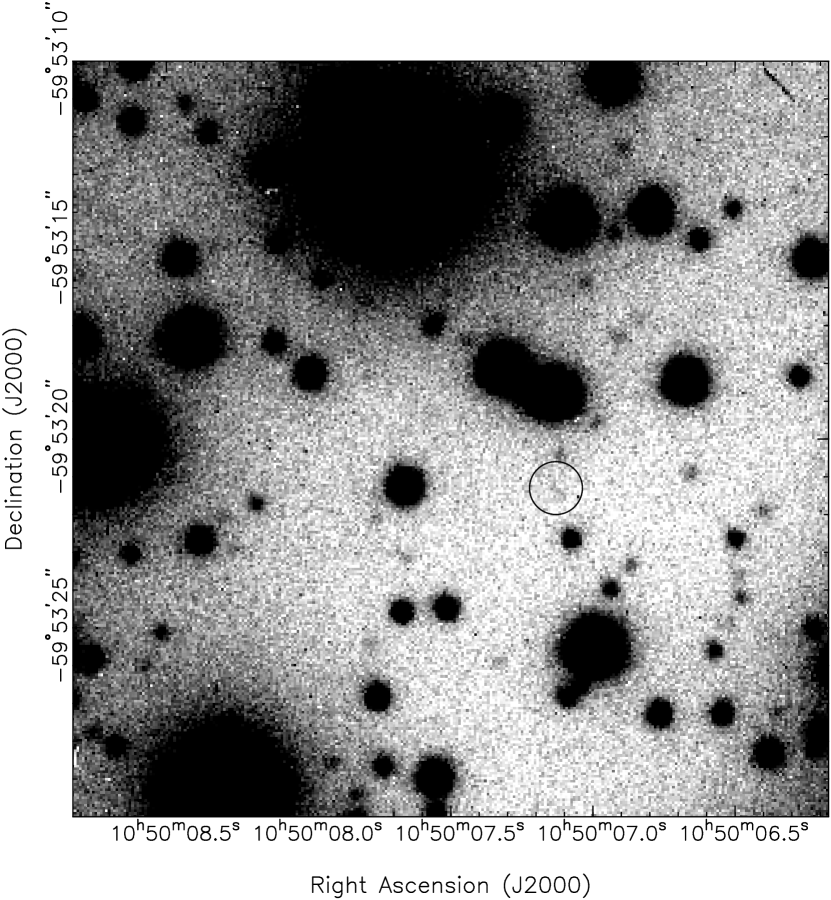
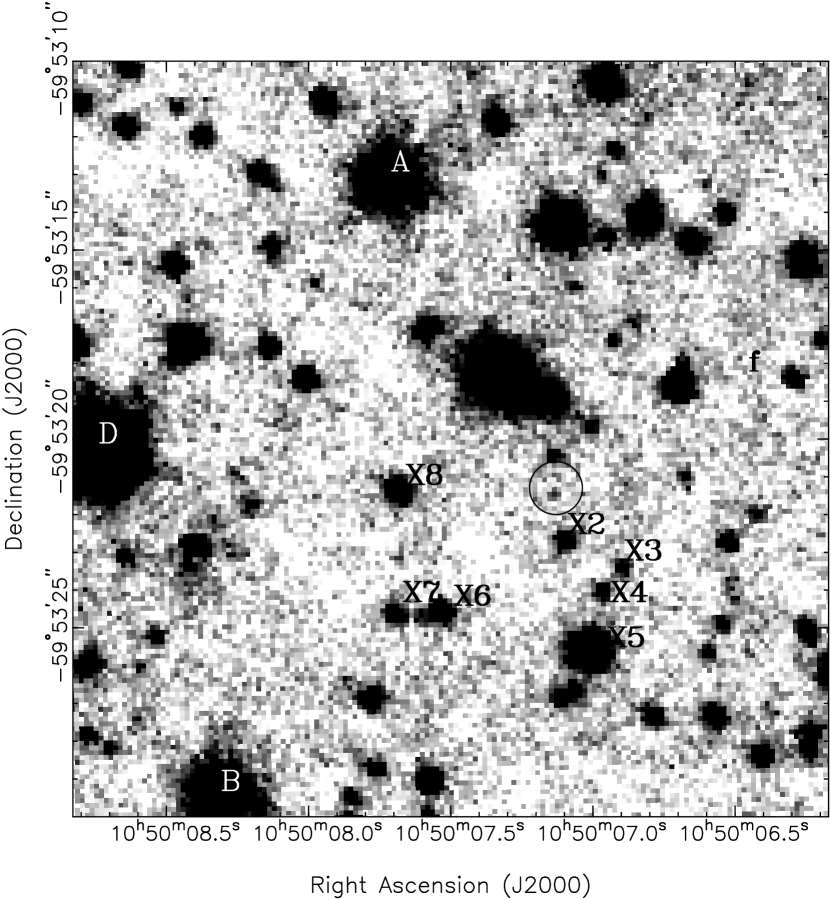
Infrared imaging (J, H and K bands) was performed of the field of AXP 1E 1048.15937 using ISAAC at the VLT. At Magellan, further imaging data were taken both in the optical (I, z′ and a wide ‘VR’ filter) and infrared (J and K) using MagIC and PANIC, respectively. See Table 1 for a list of observations and the conditions for each, and Figure 1 for images of each of the detections.
| Date | Telescope, | Mid-exposure | Band | Integration | Seeing aaFull width at half maximum. | Magnitude | |
|---|---|---|---|---|---|---|---|
| instrument | (UT) | time (s) | (arcsec) | (erg s-1 cm-2) | |||
| 24 April 2003 | VLT | 01:40bbThe VLT images were taken alternating between the filters, hence the close mid-exposure times. | K | 2772 | 0.34 | 21.3(3) | |
| ISAAC | 01:45bbThe VLT images were taken alternating between the filters, hence the close mid-exposure times. | H | 1848 | 0.47 | 21.3 | ||
| 02:15 | J | 3255 | 0.43 | 23.4(4) | |||
| 6 June 2003 | Magellan | 03:50 | I | 7200 | 0.33 | 26.2(4) | |
| MagIC | 05:35 | VR | 2700 | 0.45 | 26.0ccThis is on a Vega-like magnitude scale, with erg s-1 cm-2 Hz-1 (see text). | ||
| 06:30 | z′ | 2700 | 0.44 | 24.2ddThis magnitude is not on the Vega, but on the AB-system (see text). | |||
| 7 June 2003 | Magellan | 03:30 | K | 2300 | 0.38 | 20.9 | |
| PANIC | 06:00 | H | 3780 | 0.34 | 20.8 | ||
| 05:00 | K | 1375 | 0.30 | 21.5(4) |
.
Note. — Limits are at 95% confidence levels.
2.1 Astrometry
The images below were referenced to the International Celestial Reference System through identifying stars in the USNO B1.0 catalogue on a short (30s) I-band image. Sixty-five stars were cross-identified, and a solution found with RMS deviations in each coordinate (after rejecting objects with residuals greater than , leaving 49 good matches), and thus an astrometric error of in connecting to the USNO reference frame. This in turn has a systematic uncertainty of (Monet et al. 2003) in connecting to the ICRS. Thus the total uncertainty in astrometry is in each coordinate.
The uncertainties in connecting the coordinates of the short I-band exposure to the rest of the frames are negligible in comparison with the above errors. The error radius, at 90% confidence, in the Chandra position of 1E 1048.15937 (Zombeck et al., 1995; WC02) combined in quadrature with the astrometric error above, corresponds to an error of on any of the images in Figure 1.
2.2 VLT/ISAAC
On the night of 23 April 2003, infrared images of the field of 1E 1048.15937 were taken with ISAAC (Infrared Spectrometer And Array Camera; Moorwood, 1998) on Antu, unit telescope 1 of the Very Large Telescope. We used the Long Wavelength (LW) arm with the Aladdin 1k1k InSb infrared array, with pixel size . Seeing conditions were excellent. See Table 1 for a list of integration times and seeing for each image. The source was detected in the long J- and K-, but not in the shorter H-band observations.
Standard reduction was carried out in order to subtract the dark current, flat field (using median averages derived from the science frames) and combine the frames using IRAF. Photometry was performed using DAOPHOT II (Stetson, 1987).
In order to calibrate the frames, aperture photometry was performed on short-exposure images of three standard stars obtained on the same night. The aperture size was set large enough to include the majority of the flux from the star, as the sky noise was negligible in comparison; this established the magnitude zero point for each of the frames. The airmass of these exposures was in every case within 0.1 of the science exposures, so an atmospheric extinction correction was not necessary. Colour terms were negligible. In order to find the magnitude of the stars in the science field, the aperture correction was calculated using the difference between the magnitudes produced by the allstar task and those derived using the same large aperture used for the standards for several bright, relatively isolated stars in the frame (after the removal of fainter neighbours). See Table 2 for a list of the magnitudes of field stars around the AXP, with the numbering scheme as in WC02.
The errors on measurements, and also the limiting magnitudes where the source was not detected, were determined empirically. A routine was run which inserted stars of known magnitude (scaled from the PSF) into areas of the image free of stars, and then the new image was passed through the same analysis procedure as for the science frame and the standard deviation of the measured magnitudes was calculated for the inserted stars. The latter is used as the measurement error for that known magnitude. It incorporates the fact that fainter stars will be spread over a wider magnitude range as measured, and that near the magnitude limit the faintest stars will not be measured at all. The method gets around any assumptions of the flat field accuracy or profile errors, which are assumed constant parameters in the error model used by DAOPHOT. Whilst such parameters could be fitted for each image in turn, and then used to determine the errors, we found that in every case the function of error versus magnitude found by DAOPHOT deviated both from our standard deviations and from photon noise whatever the choice of flat-field and profile error. This turned out to be significant at the very bright end and near the magnitude limit.
We find, in the manner described above, the following magnitudes for the star X1, the AXP counterpart: , , . The limit in H corresponds to 95% confidence.
2.3 Magellan/PANIC
On the night of 6 June 2003, PANIC (Persson’s Auxilliary Nasmyth Infrared Camera; Martini et al., 2004), the 1k1k infrared imaging array with pixels on the Magellan Clay Telescope 111see http://www.ociw.edu/lco/magellan/instruments/PANIC/panic/, was used to acquire images of the field of 1E 1048.15937 in the H- and K-bands under good conditions. Two separate imaging runs were performed in the K-band through the night, resulting in two images for analysis. The AXP was detected in only one of the K frames and not at all in H; see table 1.
There was a roughly periodic pattern noise in the PANIC detector at this time. This noise was not reproducible, and its effect can be seen in our final processed images in Figure 1 as a band-like variation in the brightness of the sky.
The images were processed and analysed as above, unsing three standard stars. We find the following magnitudes for the AXP: , , and .
2.4 Magellan/MagIC
On 5 June 2003, MagIC (The Raymond and Beverly Sackler Magellan Imaging Camera222see http://occult.mit.edu/instrumentation/magic/; Shectman & Johns, 2003), a 2k2k CCD with quad readout amplifiers and pixels on the Clay Telescope, Las Campanas was used to image 1E 1048.15937 in the I- and z′-bands. A set of images were also taken using the custom ‘VR’ filter installed on MagIC (a wide, roughly rectangular pass band covering much of V and R; see Jewitt, Luu & Chen, 1996). For the I band, about 90% of the integration time was at excellent seeing conditions of , whereas the average seeing was in VR and in z′; see Table 1. The I-band images with the brightest sky and worst seeing were excluded from the stacking process, leaving a total of integration time of 7200s.
Again, the frames were processed and combined using IRAF-DAOPHOT II, with bias subtraction and trimming performed by the ccdmagic task provided by the observatory and flat fields again derived from the science frames (this proved more successful than screen flats). Magnitudes were calibrated using several standard stars and errors calibrated empirically as before (following the ISAAC experience above).
Seven photometric standard stars for this run were taken from the E5 field (Stetson, 2000), at an airmass close to the mean airmass of the science exposure. The I-band zero point was a simple average over the values inferred from the well exposed stars on the frame.
The source was not detected in the VR-band. For calibration of this non-standard filter, the E5 standard field was also imaged with the VR filter, and also the standard V and R filters to check for consistency. The VR zero point and effective wavelength were deduced in the following manner: the standard stars were assumed to have power-law spectra over their V…R range, so that the VR magnitude would be a simple interpolation, , where the parameter is to be found. Next, VR was defined to be such that the colour-term coefficient is zero: (where is the instrumental magnitude and the zero point). In effect, this makes this particular VR filter the prototype for this magnitude scale. Finally, the value of was found which minimised variance about an average value for the zero point. This minimum value was found to be , yielding the values: m, (for 1e-/s), and erg s-1 cm-2 Hz-1.
The z′ band is on the magnitude AB system, and is based on a different set of standard stars for its basic calibration. In order to find the zero point, well-known empirical transformations between z′ and the VRI bands were used (Smith et al., 2001) to find the magnitudes of each of the standard stars. These were compared with the measured magnitudes of the standard field with the z′ filter.
The AXP counterpart was found to have magnitudes , and .
| Star idaaAs labelled in WC02. Figure 1 shows the locations of some of these sources within the field. | I | J | H | K |
|---|---|---|---|---|
| X1 | 26.2(4) | 23.4(4) | 21.5 | 21.3(3) |
| X2 | 23.09(2) | 20.44(5) | 19.51(5) | 19.21(4) |
| X3 | 24.85(14) | 21.7(2) | 20.64(15) | 20.00(8) |
| X4 | 23.54(4) | 21.0(1) | 20.12(9) | 19.80(6) |
| X5 | 18.51(2) | 16.83(2) | 16.34(3) | 16.28(2) |
| X6 | 22.24(2) | 19.66(4) | 18.67(4) | 18.46(2) |
| X7 | 22.59(3) | 20.21(5) | 19.35(5) | 19.11(3) |
| X8 | 20.61(2) | 18.63(2) | 18.05(3) | 17.95(2) |
| f | 22.95(3) | 20.46(5) | 19.61(5) | 19.24(3) |
| A | 15.59(2) | 14.68(2) | 14.41(3) | 14.46(2) |
| B | 16.47(2) | 14.97(2) | 14.65(3) | 14.59(2) |
| CbbThere appears to have been an error in WC02, where the IR magnitudes for Stars C and D were switched (Wang, Z., 2005, priv. comm.) | 17.42(2) | 15.96(2) | 15.52(3) | 15.54(2) |
| DbbThere appears to have been an error in WC02, where the IR magnitudes for Stars C and D were switched (Wang, Z., 2005, priv. comm.) | 17.11(2) | 14.57(2) | 13.69(3) | 13.46(2) |
Note. — I-band magnitudes are from the Magellan data, the rest from the VLT.
3 Results and Implications
Figure 2 shows a colour-colour diagram for stars in the field of 1E 1048.15937. The AXP is clearly offset from the bulk of the stars. Its J-K colour is similar to that found by WC02 (who found J-K), despite the fact that it is mag fainter, and to that of the brightest AXP, 4U 0142+61. Given the variability and peculiar colours, we believe there is no longer any doubt that the source, labelled X1 by WC02, lying at the centre of the error circle derived from Chandra is indeed the infrared/optical counterpart to the AXP.
We now discuss the inferred spectral energy distribution, X-ray to infrared flux ratio and variability. The spectral energy distribution and X-ray to infrared flux ratio of the AXP depend on our assumption for the amount of reddening to the source. Our knowledge on this matter is discussed in Section 3.2.


3.1 Variability
As has already been noted by Israel et al. (2002), 1E 1048.15937 has shown large variability in its infrared flux. The K-band magnitudes presented here are much fainter than those given in WC02, but consistent with the limits found by Israel et al. This is illustrated in Figure 3.

1E 1048.15937 is currently part of a regular monitoring programme using the Rossi X-ray Timing Explorer (RXTE), and has been observed many times over the last two years, at particularly closely spaced intervals during the time of the observations above (Gavriil & Kaspi, 2004). Marked changes are seen during this period in pulsed flux333Due to nearby strong X-ray sources and the non-imaging nature of the RXTE observations, only the pulsed flux could be measured and spin-down rate (). The hardness ratio shows no clear variations during this time. Figure 4 shows the pulsed flux and spin-down rate, with K-band photometry points as a comparison. One sees a hint of anti-correlation between the X-ray and infrared fluxes, and no obvious relationship between the infrared flux and spin-down rate. As Gavriil & Kaspi (2004) stated, X-ray flux and spin-down rate are clearly not related.
For another source also in the RXTE monitoring programme, 1E 2259+586, recent results indicate that X-ray and infrared fluxes were correlated in the period following multiple X-ray bursts and increased activity (Tam et al., 2004) with both spectral bands showing increased persistent fluxes, which decayed towards the pre-burst values on the same time-scale. This suggests that the mechanism at work in 1E 2259+586 is different from that of 1E 1048.15937, possibly because of the bursting activity (note that bursting activity cannot be excluded by the RXTE observations of 1E 1048.15937).
3.2 Distance and Reddening
The intrinsic spectrum that we derive for the AXPs depends strongly on the value that we assume for the interstellar reddening along the line of sight. Since the reddening to all of the magnetars in the plane of the Galaxy have nominal reddening (which includes all of the AXPs, apart from the recently discovered CXOU J010043.1-721134, Majid et al., 2004), the extinction correction is huge and has a profound impact on the spectrum derived. As an example, the inferred optical spectrum of 4U 0142+61 changes from Raleigh-Jeans like to flat (in ) for a change to (Hulleman et al., 2004). It is therefore important to consider this as part of the analysis.
Usually, the model for the intrinsic X-ray spectrum is used to infer the amount of extincting material (given as the Hydrogen column, ), and assuming the relationship derived by Predehl & Schmitt (1995) to calculate the reddening due to dust.
For 1E 1048.15937, Tiengo et al. (2002) found an apparently featureless X-ray spectrum well-fitted by an absorbed power law (, ) plus blackbody ( keV). This model for the X-ray spectrum yields an extremely high value for the extincting column to the source of cm-2, comparable to values of total extinction seen through many lines of sight through the galactic plane (but see also below). In this way, values typically of order have been arrived at (WC02) for 1E 1048.15937. Comparing this estimate to the typical reddening to stars in the Carina nebula (), Seward et al. (1986) argued that the AXP must lie behind the Carina Nebula, and thus placed a lower limit on its distance of kpc.
There exist other independent methods for estimating the run of reddening with distance in any given line of sight. For our field, we found the following relevant measurements.
Neckel, Klare & Sarcander (1980) measured the average function of reddening with distance, , in many galactic-plane fields including one containing this source. They find that as a function of distance, the visual extinction is constant between 1.5kpc – 6kpc at . It should be stressed, however, that this value is an average over their field (size of order square degrees), and one could argue that measurement biases would favour a lower value of extinction at any given distance in an area of highly variable dust content.
Carrero et al. (2004) performed colour-magnitude studies of three nearby open clusters in the Carina complex (approximately from the region of interest). For the clusters Trumpler 16 and Trumpler 14, they find that 2.0(1) and 1.8(7) and distances of 3.9(5) and 2.5(3) respectively. This is in a region where the dust density is visibly greater than the surrounding sky; for 1E 1048.15937 to have a greater extinction, this suggests a more constraining lower bound on its distance. It should be noted however, that the authors of this study stress the variability of reddening from star to star in the clusters.
Finally, Merehgetti, Caravea & Bignami (1992) find that one of the brighter stars in the field is probably very highly redenned (), based on two interstellar absorption bands (4428 and 5778Å) in its spectrum. The distance to this star is unknown.
To summarise, there is reason to question our assumption that the value of gained through the fitting of the X-ray spectrum gives an appropriate value of reddening; such a suggestion has also arisen in the case of the brightest of the AXPs, 4U 0142+61. Hulleman, van Kerkwijk & Kulkarni (2004) suggest that values in the range are possible. A similar uncertainty was also suggested in the case of AXP 1E 2259+586 (from the measurements of optical filaments in its associated supernova remnant, Fesen & Hurford, 1995). As we see below, the value we use to de-redden flux measurements will alter the shape of the resultant spectrum drastically.
3.3 Spectral Energy Distribution
Figure 5 shows the inferred spectral energy distribution (SED), de-redenned using (the value derived from the X-ray spectral fit). As can be seen, a line of would be consistent with these points (the H-and VR-band limits are consistent with such a hypothesis).
Also on Figure 5 is plotted the SED of 4U 0142+61 (Hulleman, van Kerkwijk & Kulkarni, 2004), showing the optical and infrared regions for comparison, de-redenned with the nominal value for that source of . The inferred SEDs of the two AXPs are clearly inconsistent (see particularly the I-band point).

It is worth noting here, following from Section 3.2, that the reddening to both these objects is rather uncertain. With , 1E 1048.15937 has as SED with , . This changes to for . Hulleman, van Kerkwijk & Kulkarni (2004) suggest that for 4U 0142+61, values of reddening as low as are possible, based on the run of reddening with distance along the line of sight. Were one to take for 4U 0142+61, its SED would look much flatter and not unlike that which is shown for 1E 1048.15937 with . Thus it could indeed be that the two have similar intrinsic spectra but that the value assumed for reddening is wrong for either or both of the sources.
If we were to assume that the intrinsic spectra of the two AXPs 1E 1048.15937 and 4U 0142+61 are the same, then this allows us to calculate the relative reddening between the two objects, . This value enables a comparison between the two objects without knowledge of the specific reddening to either one. By comparing the colours of the two objects we find 1.2(5), implying . Thus, if the intrinsic spectra are indeed the same, 1E 1048.15937 would have and . These predictions can be tested.
3.4 X-ray to Infrared Flux Ratio
In Table 3 we list the currently known X-ray to infrared flux ratios of the AXPs, corrected for extinction using the nominal values of derived from fits to the X-ray spectra. Note that neither the 2…10keV range nor the K-band suffer considerable extinction, so these numbers are not heavily dependent on the values of reddening chosen. However, some of the sources have shown large variability in both their X-ray and infrared fluxes, and the numbers here represent values only at some particular time.
Given the variability, the flux ratios are remarkably consistent, except for that of 1RXS J170849400910. Interestingly, the counterpart for the latter is the least secure amongst the AXPs, as its association is based on astrometry and possible peculiar colours only (Israel et al., 2003). In fact, its inconsistency with the other sources in this table suggests that perhaps the other, fainter source within the Chandra error circle (named Star ‘B’ by these authors) could be the counterpart. The relative contributions of the sources to the J-band flux is unknown, and might account for the apparent strange colours of Star A.
1E 1048.15937 has varied in both its X-ray and infrared emission (see Section 3.1) by over a factor of 2, so the range which the flux ratio could take, when measured at some particular epoch is large. From Figure 4, we see that the ratio of pulsed X-ray flux to infrared flux has varied from … (in units of cts PCU-1 / erg cm-2) . On the one hand, then, the X-ray to infrared flux ratios of AXPs are similar, and for 1E 2259+586 the X-ray and infrared fluxes were correlated following an outburst. On the other hand, the infrared and X-ray fluxes of 1E 1048.15937 seem, if anything, to be anti-correlated. These two statements appear hard to reconcile with one-another.
| AXP | X-ray fluxaaUn-absorbed flux in the 2-10keV range. | bbApparent magnitude. | ccInferred from fits to the X-ray spectrum. | K-band fluxdd, de-redenned assuming (Predehl & Schmitt, 1995). | |
|---|---|---|---|---|---|
| (erg s-1 cm-2) | ( cm-2) | (erg s-1 cm-2) | /1000 | ||
| 1E 1048.15937 | 21.3 | 1.0 | 2.7 | ||
| 4U 0142+61 | 20.1 | 0.91 | 5.9 | ||
| 1RXS J170849400910 | 18.3 | 1.4 | 0.66 | ||
| 1E 2259+586 | 21.7 | 1.1 | 5.7 | ||
| XTE J1810197 | 20.8 | 1.1 | 2.7 |
Note. — Data from Woods & Thompson (2004) and references therein. The values are not thought to be within active periods.
4 Discussion
In this work, we have detected the likely quiescent counterpart to the AXP 1E 1048.15937. To summarise our findings, we have found large (2mag) variations in the infrared brightness of 1E 1048.15937 which suggest a possible anti-correlation with X-ray flux, but no clear relationship with spin-down rate. This variability is the largest that has been seen in the AXPs, but variability is not unique to this source. The anti-correlation between infrared and X-ray flux is opposite to the behaviour of 1E 2259+586, where a positive correlation was found (Tam et al., 2004).
The infrared spectrum has remained of a consistent shape with WC02. We find that the inferred spectral energy distribution of 1E 1048.15937 is inconsistent with that inferred for 4U 0142+61, but that they can be made consistent with an appropriate choice of relative reddening (for which there may be justification). We find that although both the infrared and X-ray for this source vary a large amount and are not correlated, that the X-ray to infrared flux ratio is consistent with the other AXPs. Perhaps this challenges our understanding of whether the AXPs do indeed have quiescent periods, and of the time-scales on which the magnetosphere reacts to internal magnetic changes. We now discuss what relationships might be expected from the magnetar model.
The model proposed for how infrared and optical emission might arise from a magnetar is as follows. The decay of the internal magnetic field of the magnetar induces a twist in the magnetosphere of the magnetar. This large-scale twist is supported by global, persistent currents, which exist out to large radii. These currents power the non-thermal X-ray and gamma-ray luminosity, and may also produce infrared and optical emission, through ion cyclotron radiation at large radii (Thompson, Lyutikov & Kulkarni, 2002).
In the case that the infrared radiation is indeed cyclotron emission by ions gyrating in the outer magnetosphere, the infrared flux and torque should be correlated because of the following argument. First, the number of ions travelling to large enough radii to have Landau transition energies in the optical/infrared range is a fixed fraction of the total electric current. The total current in the magnetosphere defines the amount of twist in the global magnetic field structure (that is, the departure from a pure dipolar field), which in turn affects the rate at which the field strength falls off with radius. Since the torque is caused by the field strength at the light cylinder, it must then be correlated to the ion population at large radii and so to the infrared flux (Thompson, Lyutikov & Kulkarni, 2002).
Whether the infrared and X-ray flux are expected to be correlated depends on the details of their respective emission mechanisms. Changes in X-ray flux would be possible, for example, from internal heating, which would not directly affect the infrared emission.
In order to constrain the emission mechanism for the infrared flux, it will be important to establish whether the anti-correlation between infrared and X-ray flux is indeed real, and whether the IR flux to torque correlation can really be ruled out. It would also be interesting to look for a correlation with the flux in the strong, hard X-ray tail of the spectrum that was recently discovered by Kuiper at al. (2004). Furthermore, it would be worthwhile to seek further spectral signatures, and to find or at least constrain the reddening and distance to the various sources.
Acknowledgements: MD would like to thank Cees Bassa for help with producing astrometric figures, Fotis Gavriil for providing XTE results, Chris Thompson for discussion, the VizieR Service (provided by CDS and ESA) and Victor at Las Campanas. This work is supported by NSERC.
References
- (1) Carraro, G., Romaniello, M., Ventura, P., Patat, F., 2004, A&A, 418, 525
- (2) Gavriil, F., & Kaspi, V., 2004, ApJ, 609, L67
- (3) Gavriil, F., Kaspi, V., & Woods, P., 2002, Nature, 408, 689
- (4) Hulleman, F., van Kerkwijk, M., & Kulkarni, S., 2004, A&A, 416, 1037
- (5) Hulleman, F., van Kerkwijk, M., & Kulkarni, S., 2000, Nature, 408, 689
- (6) Israel, G., Covino, S., Stella, L., Campana, S., Marconi, G., Mereghetti, S., Mignani, R., Negueruela, I., Oosterbroek, A., Parmar, A., Burderi, L., & Angelini, L., 2002, ApJ, 580, L143
- (7) Israel, G., Covino, S., Perna, R., Mignani, R., Stella, L., Campana, S., Marconi, G., Bono, G., Mereghetti, S., Motch, C., Negueruela, I., Oosterbroak, T., & Angelini, L., 2003, ApJ, 589, L93
- (8) Israel, G., Stella, L., Covino, S., Campana, S., Angelini, L., Mignanini, R., Mereghetti, S., Marconi, G., Penna, R., 2004, IAU Symposium 218
- (9) Kaspi, V., Gavriil, F., Chakrabarty, D., Lackey, J., & Muno, M., 2001, ApJ, 558, 253
- (10) Kern, B., & Martin, C., 2002, Nature, 417, 527
- (11) Martini, P., Persson, S., Murphy, D., Birk, C., Shectman, S., Gunnels, S., Koch, E., 2004, astro-ph/0406666
- (12) Mereghetti, S., Caraveo, P., Bignami, G., 1992, A&A, 263, 172
- (13) Monet, D. et al., 2003, AJ, 416, 1037
- (14) Moorwood, A., 1998, ESO Conference and Workshop Proceedings 55
- (15) Neckel, T., Klare, G., & Sarcander, M., 1980, A&AS, 42, 251
- (16) Predehl, P., & Schmitt, J., 1995, A&A, 293, 889
- (17) Shectman, S., & Johns, M., 2003, Proc SPIE, 4837, 910
- (18) Seward, F., Charles, P., & Smale, A., 1986, ApJ, 305, 814
- (19) Smith, J., Tucker, D., Kent, S., Richmond, M., Fukugita, M., Ichikawa T., Ichikawa, S., Jorgensen, A., Uomoto, A., Gunn, J., Hamabe, M., Watanabe, M., Tolea, A., Henden, A., Annis, J., Pier, J., McKay, T., Brinkmann, J., Chen, B., Holzman, J., Shimasaku, K., & York, D., , 2001, AJ, 123, 2121
- (20) Stetson, P., 1987, PASP, 99, 191
- (21) Stetson, P., 2000, PASP, 112, 925
- (22) Thompson, C. & Duncan, R., 1996, ApJ, 473, 322
- (23) Thompson, C., Lyutikov, M., Kulkarni, S., 2002, ApJ, 574, 332
- (24) Tam, C., Kaspi, V., van Kerkwijk, M., Durant, M., 2004, ApJ, accepted
- (25) Tiengo, A., Göhler, E., Staubert, R., & Mereghetti, S., 2002, A&A, 383, 182
- (26) Wang, Z. & Chakrabarty, D., 2002, ApJ, 579, L33
- (27) Woods, P., & Thompson, C., 2004, in “Compact stellar X-ray sources”, eds Lewin, W., van der Klis, M.
- (28) Zombeck, M., Chappell, J., Kenter, A., Moore, R., Murray, S., Fraser, G., & Serio, S., 1995, Proc. SPIE, 2518, 96