Density and Temperature Structure of TMC-1C from 450 and 850 µm Maps
Abstract
We have mapped the central 10′10′ of the dense core TMC-1C at 450 and 850 µm using SCUBA on the James Clerk Maxwell Telescope. The unusally high quality of the 450 µm map allows us to make a detailed analysis of the temperature and column density profiles of the core. We find that the dust temperature at the center of TMC-1C is 7 K, rising to 11 K at the edges. We discuss the possibility and effects of a variable emissivity spectral index on the derived mass profile. The low dust temperature of TMC-1C results in a high derived mass for the core, significantly larger than the virial mass estimated from the linewidth of the N2H+(1-0) transition. This result is valid within a wide range of dust properties and ellipticities of the core. The N2H+(1-0) spectra, taken with the IRAM 30m telescope, show signs of self-absorption, which provide evidence of sub-sonic infall motions. The derived density profile and infall velocity is compared to the predictions of several popular star formation models, and the Bonnor-Ebert model is the best fit analytic model.
1 Introduction
Prestellar cores are self-gravitating condensations in molecular clouds that are much denser and colder than their surrounding medium. These objects (such as L1544 and L1544F) are believed to be on the verge of collapse, and infall motions are not uncommon (Williams et al., 1999; Crapsi et al., 2004). Because prestellar cores are at a critical point on the way to becoming a star, their properties, such as density and temperature distribution, as well as their velocity field, are of particular interest. The density and temperature profiles for prestellar cores are difficult to obtain from molecular line data, because gases can deplete onto the dust grains at the high ( cm-3) densities and low temperatures ( K) present in the interiors of cores. A more accurate estimate can be obtained from measurements of the dust emission, which peaks at submillimeter wavelengths and is often optically thin. Observations at multiple submillimeter wavelengths can be used to determine such properties as the temperature, density, emissivity, and spectral index of the dust (Hildebrand, 1983). Kinematic information, such as infall, outflow, and rotation, can be determined by molecular line observations of carefully chosen high and low density tracers (Caselli et al., 2002b; Belloche et al., 2002; Di Francesco et al., 2001).
TMC-1C is a starless core in the Taurus molecular cloud complex, at a distance of 140 pc (Kenyon, Dobrzycka, & Hartmann, 1994). Taurus is known to be a site of low mass, somewhat isolated star formation. TMC-1C has previously been observed to be a “coherent core,” meaning that its velocity dispersion is constant, at slightly more than the sound speed, over a radius of 0.1 pc (Barranco & Goodman, 1998; Goodman et al., 1998). In addition, it shows a velocity gradient consistent with solid body rotation, at 0.3 km s-1 pc-1 (Goodman et al., 1993). Because TMC-1C is fairly nearby and has interesting kinematics, it is a good candidate starless core for further study.
In this paper we use continuum data taken with SCUBA at 450 and 850 µm to determine the temperature and mass distribution of the dust in TMC-1C, and spectral line maps from the IRAM 30m dish to provide velocity information. In Section 5.4 we note how changes in the assumed dust emissivity alter the conclusions of our analysis. In Section 5.6 we compare the mass derived from our multiwavelength observations to the mass we would have derived if only 850 µm data had been available to us. In Section 5.7, various collapse models for star formation are considered, and their predictions for infall speed and density profile are compared to observations. Finally, we conclude that for a wide range of assumptions, TMC-1C is a collapsing coherent core that is not especially well fit by any of the star formation models that we available.
2 Observations
2.1 Continuum
We observed a 10′10′ region of TMC-1C in Taurus with SCUBA (Holland et al., 1999) on the JCMT in exceptionally stable grade 1 weather. We used the standard scan-mapping mode, creating 850 µm and 450 µm maps simultaneously (Pierce-Price et al., 2000; Bianchi et al., 2000). Three chop throw lengths of 30″, 44″, and 68″ were used in both the right ascension and decination directions. The JCMT has beam widths of 7.5″ at 450 µm and 14″ at 850 µm which subtend diameters of 0.005 and 0.01 pc, respectively, at the distance of Taurus. Pointing during the observations was typically good to 3″ or better.
The data were reduced using the SCUBA User Reduction Facility (SURF) (Jenness & Lightfoot, 1998). The data were flatfielded, extinction corrected using skydips, despiked, baseline corrected, and had sky noise removed. Maps were then made using Emerson Fourier deconvolution (Emerson, 1995). The resultant maps were calibrated with the source CRL618, with uncertainties in the calibrator’s flux densities of 3.7% at 850 µm and 12.5% at 450 µm. The noise level of the 850 µm map is 0.009 Jy/beam, and 0.053 Jy/beam in the 450 µm map. Not that the scan-mapping mode is insensitive to structures on scales greater than a few times the largest chop throw. The flux maps can be seen in Figure 1.
2.2 Spectral Line
The 3 mm N2H+(1-0) observations shown in this paper were taken with the IRAM 30m telescope, and will be discussed in more detail in an upcoming paper (Schnee et al., 2005). A beam sampled map of the inner 2’ of TMC-1C was obtained in frequency switching mode with a spectral resolution of 0.06 km s-1. The data were reduced using the CLASS package developed jointly between Observatoire de Grenoble and IRAM. Second order polynomial baselines were subtracted from the data, and the seven hyperfine components of the N2H+(1-0) spectra were fit simultaneously with Gaussians for emission and absorption (Caselli, Myers, & Thaddeus, 1995). The properties of the N2H+(1-0) transition at the central position are shown in Table 1 and the spectrum at that position is shown in Figure 2.
3 Dust Properties
Thermal emission from dust can be used to determine such physical properties as temperature, density, and mass. However, the derivation of these quantities requires knowledge of the somewhat poorly known emission characteristics of the dust grains. In this section we discuss our assumptions and methods to derive the properties of TMC-1C from our sub-mm continuum observations.
3.1 Assumed Parameters
The dust is assumed to emit as a modified blackbody, with emissivity parameter . The flux coming from the dust at a particular wavelength is therefore given by (Mitchell et al., 2001)
| (1) |
where
| (2) |
and
| (3) |
In Equation 1, is the flux per beam; is the solid angle of the beam; is the black body emission from the dust at temperature ; cm2 g-1 is the emissivity of the dust grains at 1300 µm (Andre, Ward-Thompson, & Motte, 1996; Preibisch et al., 1993); is the mass of the hydrogen atom; is the mean molecular weight of interstellar material in a molecular cloud, and is the column density of hydrogen nuclei. For a true blackbody ; for amorphous, layerlattice material ; for metals and crystalline dielectrics , cf (Henning, Michel, & Stognienko, 1995). We assume the emission is optically thin at both 850 and 450 µm, which is justified for H2 column densities less than ( 500 magnitudes of visual extinction) (Zucconi, Walmsley, & Galli, 2001).
3.2 Derivation of Temperature
Because the thermal emission from cold (10 K) dust at 450 and 850 µm is both optically thin and near the peak of the modified blackbody spectrum, SCUBA is well-suited to observations of starless cores. A dust color temperature can be determined from the ratio of fluxes at two wavelengths. At temperatures near 10 K, the blackbody spectrum peaks around 300 µm, so for data taken at 450 and 850 µm the Rayleigh-Jeans approximation to the blackbody law cannot be used. The flux ratio therefore depends on the assumed emissivity spectral index and the temperature (Kramer et al., 2003) as:
| (4) |
where / is 17 K and 32 K at 850 and 450 µm respectively.
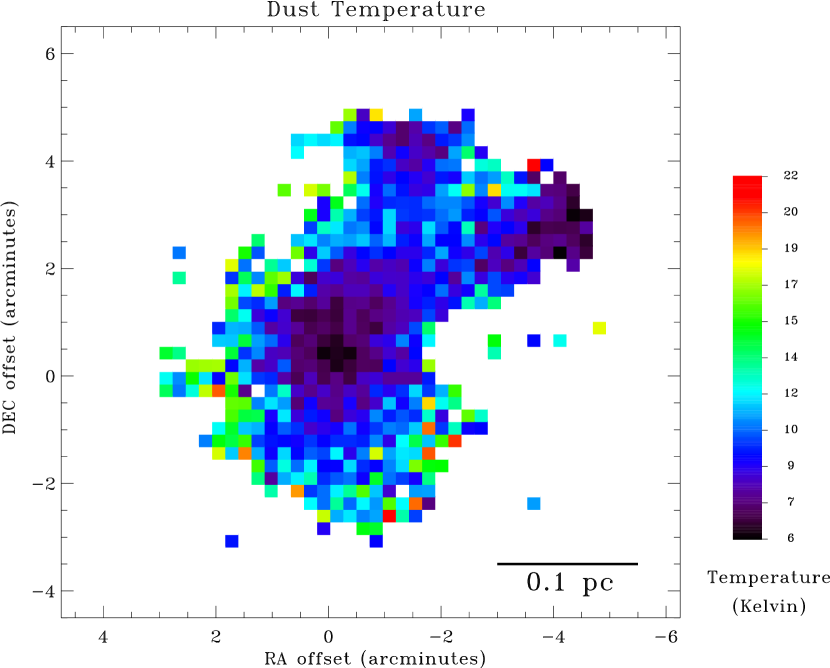
In order to derive the dust temperature in TMC-1C, we smoothed both SCUBA maps to the same 14″ resolution. Because the 450 and 850 µm SCUBA maps both have such high signal to noise, we were able to determine the temperature independently at each 14″14″ pixel and make a detailed temperature map, assuming a constant value for throughout the core111This restriction is relaxed in Section 3.4.. By estimating a temperature at each point in TMC-1C from our observations, we can calculate self-consistent profiles for column density and mass. A map of the derived dust temperature is shown in Figure 3. The derived dust temperatures range from 6 K to 15 K.
3.3 Calculation of Extinction
Given the dust color temperature at each position, the column density can be calculated from the observed flux, and from this, the equivalent visual extinction can be estimated. Equation 1 can be rearranged to determine the column density from the observed flux and derived temperature.
| (5) |
The equivalent extinction is given by
| (6) |
| (7) |
where cm-2 is the conversion between column density of hydrogen nuclei (for our assumed gas to dust ratio) and the selective absorption, and is the ratio of total-to-selective extinction (Mathis, 1990; Bohlin, Savage, & Drake, 1978). Note that this value of assumes a particular “color” for the absorbing dust, which may be different from core to core, or even within a single core. The extinction map created using these assumptions, and the value of in Section 3.1, is shown in Figure 4. The derived extinction reaches a value of 50 mag AV at the center of the map. A map of the derived column density is shown in Figure 4.
3.4 Derivation of the Emissivity Spectral Index
Instead of assuming a constant value of to calculate the temperature map as in Section 3.2, one can alternatively calculate the value of the emissivity spectral index at each point in the map by choosing a constant value for the temperature. Using multi-transition spectral line data, Tafalla et al. (2002) find that the core L1544 has a constant gas temperature of approximately 10 K (with spatial resolution of 0.03 pc), so experimenting here with calculations involving a constant dust temperature is justified. Because the emissivity spectral index appears in the equations used to derive the temperature and mass of a core, knowledge of its variability within a core is clearly valuable to the understanding of the physical properties of TMC-1C and cores in general. depends on the dust grain size distribution, the composition of the mantle, and the surface area to volume ratio of the dust particles, all of which can vary throughout a core (Ossenkopf & Henning, 1994).
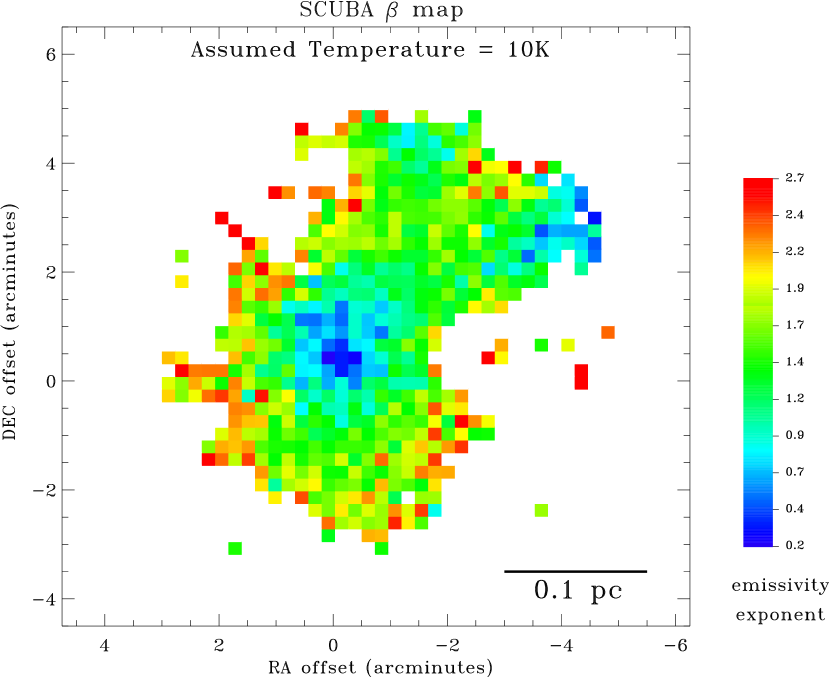
The derived emissivity spectral index map for K at all radii is shown in Figure 5. In the central 2 arcminutes (0.08 pc) of the TMC-1C core, the value of takes values in the physically plausible range . To self-consistently determine the column density, temperature, and emissivity spectral index of the dust simultaneously, we would need at least one more continuum map at another wavelength. For the remainder of this paper we will assume that has a constant value and that the dust temperature in TMC-1C is not fixed, unless stated otherwise, although we understand that both quantities are likely to vary throughout the core.
3.5 Calculation of Mass
For optically thin emission, Equation 1 can be rearranged to convert a measurement of dust emission to mass, so that
| (8) |
where is the mass of an emitting volume and is the distance to it. Using the conversions given above and assuming a distance to Taurus of 140 pc, this equation is equivalent to
| (9) |
or
| (10) |
The mass contained in each 14″14″ pixel is determined by Equations 9 and 10. Figure 6 shows the mass profile calculated by adding the mass in each pixel to annuli concentric around the peak column density. The mass in each pixel is determined using the 850 µm flux in each pixel and either the temperature assigned to each pixel shown in Figure 3 (the curve labeled “Actual Temperature Profile”), or a constant temperature assigned to every pixel. The total mass contained within a given radius of the TMC-1C column density peak can be converted into a density profile, assuming a three dimensional geometry, as discussed below.
3.6 Temperature and Density Profiles
Under the assumption of spherical symmetry, we can create three dimensional temperature and density profiles from the 850 and 450 µm maps. To make the profiles, we break up the inner 2.2 arcminutes of TMC-1C into 14″ wide concentric annuli, centered on the position of the extinction peak. The outermost annulus only has flux contributed to it by the outermost spherical shell, and its temperature and density can be calculated as in Sections 3.2 and 3.5. The next shell in recieves flux from the two outermost spherical shells. After subtracting the flux contributed from the outermost shell, whose temperature and mass has already been calculated, the remaining flux at 450 and 850 µm comes from the second spherical shell, allowing its temperature and density to be derived. In this manner we are able to work our way from the outside of TMC-1C in, finding the temperature and density of each spherical shell. The procedure is very similar to that described in David et al. (2001) for the Hydra A cluster of galaxies.
In Section 3.5, the mass was calculated for each element in the map independently of its neighbors by assuming that a single temperature could be assigned to the entire column of material. In this section, instead of dividing the central 2.2 arcminutes of TMC-1C into isothermal cylinders, we break it up into isothermal spherical shells. The temperature and density profiles are fit by broken power laws. Each broken power law is described by five parameters: two coefficients (for normalization), two exponents (the slopes), and the break radius (where the two lines meet). The temperature and density profiles created in this way are shown in Figure 7.
The derived temperature profile agrees well with the theoretical temperature profile of an externally heated Bonnor Ebert sphere presented in Gonçalves, Galli, & Walmsley (2004), as well as the observed dust temperature profile of L183 (Pagani et al., 2004). Outside the break radius, the density profile of TMC-1C derived from the SCUBA data is similar to density profiles derived from N2H+(1-0) data and continuum dust emission of other starless cores (Table Density and Temperature Structure of TMC-1C from 450 and 850 µm Maps). Inside the break radius, TMC-1C has a considerably shallower density profile than these other starless cores. The starless cores to which we are comparing TMC-1C did not have their density profiles determined with the same concentric ring algorithm as used here, because researchers lacked the data to make the detailed temperature map that we were able to get from SCUBA. The power law slopes of the density profiles of these other cores can be thought of as isothermal approximations to the “true” density profile. For comparison, the powerlaw fit to the density profile of TMC-1C under the assumption of a constant K and using only the 850 µm flux is also shown in Figure 8, with the broken powerlaw fit shown in Table Density and Temperature Structure of TMC-1C from 450 and 850 µm Maps.
4 Virial Mass and Infall
The balance between outward turbulent and thermal pressures and inward gravitational pull determines the stability of a dense core. In this section we derive the virial mass from N2H+(1-0) data and show that for a wide range of density profiles and shapes the virial mass is significantly lower than the mass derived from dust emission. The N2H+(1-0) emission peaks in the same place that the dust column density peaks, so using this line to estimate the virial mass is justified. The N2H+(1-0) self-absorption profile shows evidence of infall motions, further suggesting the gravitational instability of TMC-1C (Schnee et al., 2005).
4.1 Calculation of the Virial Mass
The virial mass of the inner core of TMC-1C can be estimated from the observed line width of the isolated component of the N2H+(1-0) spectra. The total velocity dispersion has a non-thermal and a thermal component, given by:
| (11) |
The thermal velocity dispersion is given by the gas temperature by:
| (12) |
The line width depends on the velocity dispersion as:
| (13) |
Where is the total velocity dispersion, is the non-thermal component of the velocity dispersion, is the thermal component of the velocity dispersion, is the Boltzmann constant, is the gas temperature (assumed to be 10 K, (Tafalla et al., 2002)), is the mass of the molecule (N2H+ or H2), and is the observed line width. Note that the dust temperature is below 10 K throughout most of the TMC-1C core, so the virial mass calculated for a 10 K gas is an upper limit, if the gas and dust temperatures are coupled.
The N2H+(1-0) spectra were annularly averaged with bins of 20″, and the line width was then determined as a function of distance from the core’s center. The N2H+(1-0) line width is 0.25 , and is very nearly constant at all radii (as expected for a coherent core). The virial mass of an ellipsoid with a power law density profile determined in this way is
| (14) |
where is the quadratic sum of the 10 K thermal line width of H2 and the non-thermal line width of N2H+(1-0), is a parameter than depends on the density profile, and is a parameter that depends on the ellipticity of the core. The virial mass is plotted as a function of radius in Figure 6, with the assumptions that the density profile is uniform () and the core is spherical (). More sophisticated geometric assumptions are discussed in Sections 4.1.1 and 4.1.2.
4.1.1 Dependence on the Density Profile
We have shown in Section 3.6 that the density in TMC-1C is not uniform, and our estimate of the virial mass should take this into account. For a given line width, a more centrally condensed cloud will have a lower virial mass than a uniform density cloud (Bertoldi & McKee, 1992). This can be parameterized for a power-law density distribution
| (15) |
(Bertoldi & McKee, 1992).
The dependence of the virial mass on the density power law is shown in Figure 9. For r-1 and r-2 density distributions, the corrected virial masses are 90% and 60% of the value calculated by Equation 15 for a uniform density profile. Thus, the steeper the density profile, the greater the imbalance between the virial mass and the dust derived mass for TMC-1C, making it more unstable.
4.1.2 Dependence on the Shape of the Core
Our estimate of the virial mass also depends on the shape of TMC-1C. It has been shown that many clouds are elliptical in projection, and usually prolate in three dimensions (Myers et al., 1991). Oblate clouds have slightly lower virial masses than a sphere whose radius is determined by the plane-of-sky dimension and a prolate cloud will have a larger virial mass than such a sphere. If the axial ratio, y, is less than 1 (an oblate cloud) then
| (16) |
If the axial ratio, y, is greater than 1 (a prolate cloud) then
| (17) |
(Bertoldi & McKee, 1992). The dependence of the virial mass on the axial ratio is shown in Figure 9. For axial ratios less than 10:1, the correction for the virial mass is less than a factor of 3. The virial mass as a function of shape and density profile for TMC-1C are shown in Figure 10, as are the masses derived from the dust emission for three representative values of . Notice that to make the virial mass equal to the dust-emission implied mass at 0.06 pc in TMC-1C (see Figure 6), a prolate core would need to have an axial ratio of 20:1. This is ruled out by our data, except for the very unlikely case where we are viewing a cigar end-on.
4.2 N2H+(1-0) Self-Absorption
N2H+(1-0) is typically used as an optically-thin, high-density, low-depletion tracer of the kinematics of the interior of cores (Williams & Myers, 1999; Caselli et al., 2002a, b). However, there is some evidence of N2H+(1-0) self-absorption in dense cores (Caselli et al., 2002b; Williams & Myers, 1999). In another paper we will show that N2H+(1-0) is a better match to the dust emission in TMC-1C than most carbon bearing molecules, which tend to deplete onto dust (Schnee et al., 2005). In this paper we show evidence of redshifted self-absorption in N2H+(1-0) at several positions near the peak of the dust emission.
To determine if the splitting of the N2H+(1-0) hyperfine components is due to self-absorption or two superimposed velocity components from different emission components along the same line of sight, the seven hyperfine components can be compared with each other to see if the location of the dip is constant amongst them. If this is the case, then kinematics are likely to be creating the non-gaussian spectra, if not (with the shift increasing with the statistical weight of the component), then self-absorption is probably the cause. The dip in the TMC-1C N2H+(1-0) spectra does shift with statistical weight in a way consistent with self-absorption, so we believe that the double peaked spectra are not the result of two kinematically distinct clouds. While N2H+(1-0) self-absorption is uncommon enough to be interesting on its own, we use the N2H+(1-0) data in this paper to determine infall velocity of material close to the center of the TMC-1C core.
The isolated component of each N2H+(1-0) spectrum (see Figure 2) was fit with two gaussians (one positive and one negative) to find the approximate velocities for the emission and absorption features, respectively. If the interior of the core is collapsing or flowing toward the center faster than the exterior, then radiative transfer models show that the spectra should have two peaks, with the blue peak higher than the red (Zhou, et al., 1993; Myers et al., 1996). Therefore, in an infalling region, the gaussian fit to emission will be bluer than the gaussian fit to absorption. In Figure 11 we show the histogram of the difference between the emission and absorption velocities for N2H+(1-0), where the absorption velocities are nearly all redshifted relative to the emission velocities, indicative of infall. Using the simple two layer radiative transfer model of a contracting cloud developed by Myers et al. (1996), we find that the infall velocity averaged over the central 0.05 pc of TMC-1C is 0.06 km s-1.
5 Discussion
5.1 450 and 850 µm Emission Maps
The 450 and 850 µm maps of TMC-1C look qualitatively different in the lower half of the maps. The 850 µm map has a peak at (-1’,1’), though the 450 µm map has no peak there. The 450 µm map peaks at (0’,-1.5’), where the 850 µm flux is comparatively weak. This suggests that the physical conditions in TMC-1C are different from the pre-protostellar cores L1544 and L1698B, in which the 450 and 850 µm fluxes are well correlated (Shirley et al., 2000).
5.2 Temperature Distribution
In order to compare the observed dust temperature in a starless core to theoretical models of externally heated cores, it is necessary to have high quality maps in at least two wavelengths. Our SCUBA maps of TMC-1C provide some of the best available submillimeter data of a starless core. In Figure 7 we show that the temperature profile is coldest at the center, with a temperature of 6 K. The temperature rises by 1 K out to 0.03 pc, after which it rises more quickly, to a 12 K at a radius of 0.08 pc.
Our observed dust temperture profile is a close match to that shown in Figure 2 of Gonçalves, Galli, & Walmsley (2004), in both temperature range and shape of the profile. Similarly, our dust temperature profile also matches that in Figure 4b of Evans et al. (2001). Both of these models simulate the temperature profile of externally heated starless cores with Bonnor-Ebert density distributions, which is a reasonable approximation of TMC-1C.
5.3 Dependence on
The parameters describing TMC-1C that we have derived above all assume a constant emissivity spectral index throughout the cloud, although a range of values of have been tested, between 1.0 and 2.0. We have found that constant values of smaller than 1.0, the mass derived from the temperature and the 450 µm flux is not consistent with the mass derived from the temperature and the 850 µm flux. In general, for fits with larger , the derived mass of the cloud increases and the temperature of the cloud decreases. For a low value of of 1.0, the virial mass for the inner 0.06 pc of a uniform density sphere is still 2.5 times less than the mass derived from dust emission (see Figure 6). So, although the dust derived mass varies strongly with , the conclusion that the virial mass is smaller than the dust derived mass of TMC-1C is robust (See Figure 10).
5.4 Dust Emissivity
The emissivity of dust has been measured with a combination of FIR flux maps and NIR extinction maps in the clouds IC 5146 and B68 (Kramer et al., 2003; Bianchi et al., 2003). Both studies find 850 µm fluxes consistent with cm2 g-1, with uncertainties in the range of 30% - 60%. TMC-1C is a starless core similar to B68 and those found in IC 5146, so we estimate that uncertainties in our 450 and 850 µm calibrations (see section 2.1) and emissivities result in a derived mass that is accurate to within a factor of 2 for a given emissivity spectral index and dust to gas conversion. The masses we derive from the dust emission are greater than the virial mass by more than a factor of two, so the uncertainty in the dust emissivity can not by itself change the conclusion that TMC-1C should be in a state of collapse. However, a perverse conspiratorial combination of , axial ratio, and could still result in a dust mass lower than the N2H+(1-0) derived virial mass. Figure 10 shows contours of the virial mass as a function of ellipticity and density profile, and also plots the mass derived from the 450 and 850 µm fluxes for representative values of . It is shown that for any density profile and any value of tested, TMC-1C is gravitationally unstable for a wide range of axial ratios. If TMC-1C has a nearly spherical geometry, then the dust emissivity we use would have to be low by an unlikely factor of 3-5 to make the virial mass and the dust derived mass approximately equal.
5.5 Emissivity Spectral Index
The emissivity spectral index, , can vary through a core, though it is often treated as a constant in papers on starless cores. By assuming a constant temperature (10 K) and using the 450 µm to 850 µm flux ratio, we have created a map of (Figure 5), in the same way in which the temperature map 3 was created. The values of are closer to zero (i.e. the dust emits more like a blackbody) towards the center of the core than towards the edges. This would be expected if the dust grains are larger at smaller radii in TMC-1C, which might be taken as evidence of grain growth (Testi, Natta, Shepherd, & Wilner, 2003). On the other hand, it is also plausible that the emissivity spectral index does not change much throughout the core, and instead the temperature of the dust is lower in the center of the TMC-1C than towards the edges (Zucconi, Walmsley, & Galli, 2001). This would be expected if interstellar radiation is able to heat the exterior of the core, but the extinction is too high in the center to allow for efficient heating there. Note the similarity in the dust temperature map (Figure 3) and the emissivity spectral index map (Figure 5). The emissivity spectral index for constant K has values in the physically plausible range of 0.5 to 2.0 (center to edge, respectively), making it hard to call either the constant or constant assumption unreasonable. In order to solve for the dust column density, temperature, and emissivity spectral index we would need a third wavelength in our SED.
5.6 Mass Estimates With and Without Maps at Multiple Wavelengths
In most SCUBA observations, non-ideal weather degrades the quality of 450 µm data significantly more than the 850 µm data. In such cases, the mass of a core is usually derived from just 850 µm data by assuming that the core is isothermal and assuming a temperature and emissivity spectral index. In TMC-1C, because we can derive a self-consistent temperature map (assuming a value for ) from 850 and 450 µm data, we can also derive the mass as a function of radius without assuming a constant temperature.
Here we compare the mass that we derive from our 450 and 850 µm emission maps with what would ordinarily have been derived from a single wavelength map. The mass that would have been derived from just our 850 µm data and a constant temperature is shown in Figure 6 for temperatures of 5, 7, 10, 15, and 20 K. Note that the “true” cumulative mass profile lies somewhere between the 5 K and 10 K constant temperature mass profiles. To constrain this range further, we use the mass profile, M(r), derived from both the 450 and 850 µm fluxes along with the observed 850 µm cumulative flux profile, F(r), to determine a self-consistent temperature profile, T(r), which is a constant temperature within R. This profile answers the question “Given the total 850 µm flux contained within a cylinder of radius and the mass contained within that radius, what isothermal temperature would one need to assume to make the mass and flux consistent with each other?” The result is shown in Figure 12. The values range from 7 K to match the inner 0.02 pc of a cloud to 11 K to match the mass out to 0.09 pc of a cloud. This tight range on the allowed values for a uniform temperature dust model to match the mass derived from multiwavelength data demonstrates the difficulty of correctly guessing an appropriate temperature for an isothermal core and shows the importance of having multiple wavelength bands of observations to derive it directly.
The range of isothermal temperatures typically assumed for cores which do not have multiwavlength data available lies between 30 Kelvin for cores in Orion (Johnstone et al., 2001; Mitchell et al., 2001) and Ophiuchus (Johnstone et al., 2000) to 10 for cold pre-protostellar cores (Shirley et al., 2000). Our analysis of TMC-1C shows that the interior temperature of molecular cloud cores can be significantly colder than these assumed temperatures, as has been recently shown to be the case for other cores as well (Evans et al., 2001). The mass of gas and dust in TMC-1C calculated from the 850 µm flux map for various isothermal cores is plotted in Figure 6. If we had assumed that the dust temperature was uniform at 20 K, then the mass derived from the dust emission would be smaller than the virial mass for any of the values of that we considered. A 15 K cloud would have a dust mass nearly equal to the virial mass for , and a 10 K cloud would have a dust mass considerably higher than the virial mass for all values of . Because the inferred gravitational stability of a molecular cloud core is highly dependent on the assumed temperature, observations should be made at two or more wavelengths to confidently describe the state of a core.
5.7 Observed and Model Profiles
Though we have nowhere required that the resulting temperature, density, or flux profiles of TMC-1C be well fit by powerlaws, for both the temperature and density profiles, broken power laws are good fits to the data222The radius of the innermost point is taken to be one half of the HWHM of the 850 µm beam. Though the location of this point is somewhat arbitrary, its influence on the goodness of fit to the various star formation models is minimal.. In section 4.2 we found the infall velocity implied by the N2H+(1-0) spectra, without an attempt to explain the physical significance of the fit parameters. In this section we compare the predictions of several popular analytical star formation models with the data in order to predict the evolution of the TMC-1C core. Each model considered is fit to the density shown in Figure 7. The fit is done by minimizing the sum of the squared errors between the data values at each radius, and the predicted density at that radius. We have shown that in TMC-1C the inner density profile n(r) r-0.8, the outer density profile is n(r) r-1.8, and the infall speed is 0.06 km s-1.
The inside out collapse model of a singular isothermal sphere (Shu, 1977) predicts a broken power law density distribution with an r-2 profile outside the infall radius, and a profile inside the infall radius asymptotically approaching r-1.5. Our observations also show a two-component density distribution, but the inner slope of the TMC-1C density profile is definitely shallower than predicted by the Shu model. To within the errors (see Table Density and Temperature Structure of TMC-1C from 450 and 850 µm Maps), the straight-forward inside-out collapse model can be ruled out by the density distribution. In addition, the infall velocity of the inside out collapse is predicted to be around the sound speed ( km s-1 for 10 K gas), while we have observed an infall speed of only 0.06 km s-1.
The logotrope describes a pressure-truncated, self-gravitating sphere with the equation of state (McLaughlin & Pudritz, 1996). This model predicts a density profile that goes as r-1 in the outer parts of cores and much shallower near the center while the core is in equilibrium. Once the cloud begins to contract, an r-1.5 profile develops inside the expansion wave. The density profile in TMC-1C outer portions of TMC-1C is considerably steeper than that predicted by the logotropic model, and it is therefore also inconsistent.
In many ambipolar diffusion models (Ciolek & Mouschovias, 1994; Basu & Mouschovias, 1994), the density of an axisymmetric magnetically regulated cloud can be described by a broken power law. In these models, there is an inner region with a uniform density profile, surrounded by an envelope that has a power law slope ranging from immediately outside the uniform density central region and flattening to a mean r-1.4 profile. This qualitatively agrees with our finding for TMC-1C, in that the inner region of the core has a flatter density profile than the outer region, though our derived inner powerlaw slope is significantly shallower than the ambipolar diffusion models predict. Certain ambipolar diffusion models developed to match the conditions (mass, density, rotation, magnetic braking) of the starless core L1544 do a slightly better job of describing TMC-1C than the untailored models. These models predict a steeper profile (r-1.8) outside the break radius and a flattened interior profile that match a large portion of the TMC-1C density distribution, but fail to match the inner density point by wide margin. (Crutcher et al., 1994; Safier, McKee, & Stahler, 1997). In the Crutcher model the infall speed is as low as 0.033 km s-1 at the boundary of the supercritical core, and as high as 0.133 km s-1 near the center (7 pc). The infall speed in the central arcminute of TMC-1C, as calculated by the N2H+(1-0) spectra, is roughly 0.06 km s-1, in agreement with this model.
The Larson-Penston model describes the uniform collapse of an isothermal cloud. Like the expansion wave solution of Shu, the density in the outer regions of the cloud goes as r-2, but it has a much flatter profile towards the center. This qualitatively agrees with the observed TMC-1C density profile. The infall velocity in the Larson-Penston model should be 3.3a, where a is the sound speed ( km s-1 for 10 K gas). The TMC-1C infall velocities are far smaller than the 0.7 km s-1 infall velocity predicted by the Larson-Penston model, and so it too is ruled out.
The Bonnor-Ebert model describes a pressure bounded isothermal sphere, with a density profile that is non-singular at the origin (Ebert, 1955; Bonnor, 1956). Bonnor-Ebert spheres have a density profile that is close to r-2 at large radii, and flattens at smaller radii, similar to the Larson-Penston model (Harvey et al., 2001) and qualitatively in agreement with the TMC-1C density profile. The collapse of a Bonnor-Ebert sphere has been studied numerically by Foster & Chevalier (1993). Once the cloud has begun to collapse, their model predicts an expanding region of supersonic inflow, which asyptotically converges to the Larson-Penston flow. TMC-1C has no evidence of supersonic inflow, so this model fails to describe the core, though a Bonnor-Ebert sphere that is just beginning to collapse would not necessarily be expected to have supersonic infall motions. Furthermore, the density profile of the Bonnor-Ebert sphere is the best fit to the dust-derived density profile for TMC-1C.
6 Summary
6.1 450 and 850 µm data
In sub-mm observations, 450 µm data are often degraded by weather far more than 850 µm emission. In this paper we have shown that obtaining high quality 450 µm data, giving us two wavelengths near the thermal peak of TMC-1C’s modified blackbody spectrum, is critical to determining the temperature and mass distribution within a pre-stellar core.
6.2 Low Temperature
The temperature map shows that TMC-1C has a strong temperature gradient if is roughly constant, with the inner regions of the core being colder than the outer by roughly a factor of two. This suggests that no point source has formed in TMC-1C to heat the cloud from the inside. The interior temperature of TMC-1C is significantly colder than 10 K for most values of , and rises to 15 degrees at a radius of 0.1 pc. This temperature range is lower than typically assumed for star forming cores, and leads to a much higher dust and implied gas mass than would have been derived making a “typical” assumption of constant of 15 or 20 K. The temperatures derived for TMC-1C are consistent with theoretical models of pre-protostellar cores heated by an external attenuated radiation field (with or without cosmic rays), which predict cores with a 7 K center heating up to 14 K at the edges (Zucconi, Walmsley, & Galli, 2001; Evans et al., 2001; Galli, Walmsley, & Gonçalves, 2002).
6.3 High Mass
The virial mass of TMC-1C has been calculated from the line width of the N2H+(1-0) transition averaged over several annuli. We show that the total core mass implied by sub-mm dust emission is significantly higher than the virial mass for a wide range of density distributions and axial ratios. The virial mass at a radius of 0.06 pc is shown in Figure 10 as a function of the exponent in the density power law and ratio of the axes.
If instead of deriving the temperature from multiwavelength SCUBA data we had used an assumed temperature of 15 K, this conclusion would be far less certain. An assumed constant temperature of 20 K would have led us to conclude that the virial mass is larger than the mass determined from dust emission.
6.4 The Effect of Varying Beta
For values of the emissivity spectral index in the range from 1 to 2, the mass of the central 0.06 pc of TMC-1C varies from 9 M⊙ to 15 M⊙, as determined by the same method used to create Figure 6. Choosing any value of in this range does not change the conclusion that the dust derived mass is much larger than the virial mass. Furthermore, changing the value of does not significantly change the shape of the broken power laws that we fit to the temperature and density profile, and therefore does not change our fits to various star formation models. Using different values of does change the absolute values of the temperature and density, however, as shown in Figure 7. If is allowed to vary with radius and if the temperature of TMC-1C is held constant at 10 K throughout the inner 0.06 pc of the core, then the value of needs to vary by over a factor of 3 to account for observations, increasing towards the edges (see Figure 5). In reality, it is likely that and Tdust and Ndust all vary with radius, but with only two wavelengths observed, we are forced to hold one quantity fixed to calculate the other two. With observations at a third wavelength, this restriction can be relaxed, and all three quantities (, Tdust, and Ndust) can be calculated simultaneously.
6.5 Infall Motions Detected
Self-absorbed N2H+(1-0) spectra show evidence of infall motions of roughly 0.06 km s-1 over a radius of 0.05 pc. We believe that N2H+(1-0) is a good tracer of infall in TMC-1C because it is a high density tracer, its shape matches the dust emission near the column density peak, and because it shows no evidence of being significantly depleted. We therefore conclude that the interior of TMC-1C is flowing inwards at about 0.06 km s-1.
6.6 Star Formation Model
TMC-1C is a starless core that is potentially beginning to collapse. Its virial mass is significantly lower than its dust derived mass, and N2H+(1-0) spectra show signs of sub-sonic infall. The derived density profile behaves qualitatively like that predicted by several star formation models in that it is consistent with an power law outside of its break radius and is shallower interior to the break radius. However, none of the models tested here convincingly match both the density profile and infall velocity that we have measured (see Table 3 and Figure 13).
A Bonnor-Ebert sphere provides the best fit to our dust-derived density profile, but even for that model the inner point is only barely within the error bars. Do our results mean that all extant detailed models of the collapse of a core into a star are “wrong”? Not completely. The mismatch between theory and observations here is likely caused both by none of the models, on its own, being exactly right, and remaining assumptions necessary in the data interpretation being imperfect. Perhaps incorporating elements of one theory into another (e.g. ambipolar diffusion in a Bonnor-Ebert sphere) will produce more realistic theories. And, perhaps adding (at least) another wavelength dust map will modify the , Ndust, and Tdust distributions (mildly), or other spectral lines tracing material even closer to the dynamical center of cores will reveal (slightly) higher infall speeds. The excellent weather in Hawaii the day we observed TMC-1C has given us some of the tightest constraints yet on the physics of isolated star formation in cores. Now we need to rise to the challenge offered by these fine data.
References
- Alves, Lada, & Lada (2001) Alves, J. F., Lada, C. J., & Lada, E. A. 2001, Nature, 409, 159
- Andre, Ward-Thompson, & Motte (1996) Andre, P., Ward-Thompson, D., & Motte, F. 1996, A&A, 314, 625
- Barranco & Goodman (1998) Barranco, J. A. & Goodman, A. A. 1998, ApJ, 504, 207
- Basu & Mouschovias (1994) Basu, S. & Mouschovias, T. C. 1994, ApJ, 432, 720
- Belloche et al. (2002) Belloche, A., André, P., Despois, D., & Blinder, S. 2002, A&A, 393, 927
- Bertoldi & McKee (1992) Bertoldi, F. & McKee, C. F. 1992, ApJ, 395, 140
- Bianchi et al. (2000) Bianchi, S., Davies, J. I., Alton, P. B., Gerin, M., & Casoli, F. 2000, A&A, 353, L13
- Bianchi et al. (2003) Bianchi, S., Gonçalves, J., Albrecht, M., Caselli, P., Chini, R., Galli, D., & Walmsley, M. 2003, A&A, 399, L43
- Bohlin, Savage, & Drake (1978) Bohlin, R. C., Savage, B. D., & Drake, J. F. 1978, ApJ, 224, 132
- Bonnor (1956) Bonnor, W. B. 1956, MNRAS, 116, 351
- Caselli, Myers, & Thaddeus (1995) Caselli, P., Myers, P. C., & Thaddeus, P. 1995, ApJ, 455, L77
- Caselli et al. (2002a) Caselli, P., Benson, P. J., Myers, P. C., & Tafalla, M. 2002, ApJ, 572, 238
- Caselli et al. (2002b) Caselli, P., Walmsley, C. M., Zucconi, A., Tafalla, M., Dore, L., & Myers, P. C. 2002, ApJ, 565, 331
- Ciolek & Mouschovias (1994) Ciolek, G. E. & Mouschovias, T. C. 1994, ApJ, 425, 142
- Crapsi et al. (2004) Crapsi, A., Caselli, P., Walmsley, C. M., Tafalla, M., Lee, C. W., Bourke, T. L., & Myers, P. C. 2004, A&A, 420, 957
- Crutcher et al. (1994) Crutcher, R. M., Mouschovias, T. C., Troland, T. H., & Ciolek, G. E. 1994, ApJ, 427, 839
- David et al. (2001) David, L. P., Nulsen, P. E. J., McNamara, B. R., Forman, W., Jones, C., Ponman, T., Robertson, B., & Wise, M. 2001, ApJ, 557, 546
- Di Francesco et al. (2001) Di Francesco, J., Myers, P. C., Wilner, D. J., Ohashi, N., & Mardones, D. 2001, ApJ, 562, 770
- Ebert (1955) Ebert, R. 1955, Zeitschrift fur Astrophysics, 37, 217
- Emerson (1995) Emerson, D. T. 1995, ASP Conf. Ser. 75: Multi-Feed Systems for Radio Telescopes, 309
- Evans et al. (2001) Evans, N. J., Rawlings, J. M. C., Shirley, Y. L., & Mundy, L. G. 2001, ApJ, 557, 193
- Foster & Chevalier (1993) Foster, P. N. & Chevalier, R. A. 1993, ApJ, 416, 303
- Galli, Walmsley, & Gonçalves (2002) Galli, D., Walmsley, M., & Gonçalves, J. 2002, A&A, 394, 275
- Gonçalves, Galli, & Walmsley (2004) Gonçalves, J., Galli, D., & Walmsley, M. 2004, A&A, 415, 617
- Goodman et al. (1993) Goodman, A. A., Benson, P. J., Fuller, G. A., & Myers, P. C. 1993, ApJ, 406, 528
- Goodman et al. (1998) Goodman, A. A., Barranco, J. A., Wilner, D. J., & Heyer, M. H. 1998, ApJ, 504, 223
- Harvey et al. (2001) Harvey, D. W. A., Wilner, D. J., Lada, C. J., Myers, P. C., Alves, J. F., & Chen, H. 2001, ApJ, 563, 903
- Henning, Michel, & Stognienko (1995) Henning, T., Michel, B., & Stognienko, R. 1995, Planet. Space Sci., 43, 1333
- Hildebrand (1983) Hildebrand, R. H. 1983, QJRAS, 24, 267
- Holland et al. (1999) Holland, W. S. et al. 1999, MNRAS, 303, 659
- Jenness & Lightfoot (1998) Jenness, T. & Lightfoot, J. F. 1998, ASP Conf. Ser. 145: Astronomical Data Analysis Software and Systems VII, 7, 216
- Johnstone et al. (2000) Johnstone, D., Wilson, C. D., Moriarty-Schieven, G., Joncas, G., Smith, G., Gregersen, E., & Fich, M. 2000, ApJ, 545, 327
- Johnstone et al. (2001) Johnstone, D., Fich, M., Mitchell, G. F., & Moriarty-Schieven, G. 2001, ApJ, 559, 307
- Kenyon, Dobrzycka, & Hartmann (1994) Kenyon, S. J., Dobrzycka, D., & Hartmann, L. 1994, AJ, 108, 1872
- Kramer et al. (2003) Kramer, C., Richer, J., Mookerjea, B., Alves, J., & Lada, C. 2003, A&A, 399, 1073
- Mathis (1990) Mathis, J. S. 1990, ARA&A, 28, 37
- McLaughlin & Pudritz (1996) McLaughlin, D. E. & Pudritz, R. E. 1996, ApJ, 469, 194
- Mitchell et al. (2001) Mitchell, G. F., Johnstone, D., Moriarty-Schieven, G., Fich, M., & Tothill, N. F. H. 2001, ApJ, 556, 215
- Myers et al. (1991) Myers, P. C., Fuller, G. A., Goodman, A. A., & Benson, P. J. 1991, ApJ, 376, 561
- Myers et al. (1996) Myers, P. C., Mardones, D., Tafalla, M., Williams, J. P., & Wilner, D. J. 1996, ApJ, 465, L133
- Ossenkopf & Henning (1994) Ossenkopf, V. & Henning, T. 1994, A&A, 291, 943
- Pagani et al. (2004) Pagani, L., et al. 2004, A&A, 417, 605
- Pierce-Price et al. (2000) Pierce-Price, D. et al. 2000, ApJ, 545, L121
- Preibisch et al. (1993) Preibisch, T., Ossenkopf, V., Yorke, H. W., & Henning, T. 1993, A&A, 279, 577
- Safier, McKee, & Stahler (1997) Safier, P. N., McKee, C. F., & Stahler, S. W. 1997, ApJ, 485, 660
- Schnee et al. (2005) Schnee, S., Arce, H., Ballesteros, J., Caselli, P., Goodman, A., & Kuchibohtla, K. 2005, In ApJ
- Shirley et al. (2000) Shirley, Y. L., Evans, N. J., Rawlings, J. M. C., & Gregersen, E. M. 2000, ApJS, 131, 249
- Shu (1977) Shu, F. H. 1977, ApJ, 214, 488
- Tafalla et al. (2002) Tafalla, M., Myers, P. C., Caselli, P., Walmsley, C. M., & Comito, C. 2002, ApJ, 569, 815
- Testi, Natta, Shepherd, & Wilner (2003) Testi, L., Natta, A., Shepherd, D. S., & Wilner, D. J. 2003, A&A, 403, 323
- Ward-Thompson et al. (1994) Ward-Thompson, D., Scott, P. F., Hills, R. E., & Andre, P. 1994, MNRAS, 268, 276
- Ward-Thompson, Motte, & Andre (1999) Ward-Thompson, D., Motte, F., & Andre, P. 1999, MNRAS, 305, 143
- Williams & Myers (1999) Williams, J. P. & Myers, P. C. 1999, ApJ, 511, 208
- Williams et al. (1999) Williams, J. P., Myers, P. C., Wilner, D. J., & di Francesco, J. 1999, ApJ, 513, L61
- Zhou, et al. (1993) Zhou, S., Evans, N. J., Koempe, C., & Walmsley, C. M. 1993, ApJ, 404, 232
- Zucconi, Walmsley, & Galli (2001) Zucconi, A., Walmsley, C. M., & Galli, D. 2001, A&A, 376, 650


| Transition | Frequency | Signal / Noise | Noise | VLSR | Line Width |
|---|---|---|---|---|---|
| GHz | Kelvin | km s-1 | km s-1 | ||
| N2H+(1-0) | 93.176 | 9.8 | 0.145 | -2.787 | 0.246 |
| Observation Type | Inner Exponent | Outer Exponent | Break Radius (pc) | Reference |
|---|---|---|---|---|
| N2H+(1-0) starless cores | 1.2 | 2 | 0.03 | 1 |
| L1696 sub-millimeter | 1.3 | 2 | 0.02 | 2 |
| L1689B sub-millimeter | 1.0 - 1.4 | 2 | 0.02 | 3 |
| Sub-millimeter starless cores | 1.25 | 2 | 0.02 | 4 |
| TMC-1C sub-millimeter (3D) | 0.8 0.1 | 1.8 0.1 | 0.02 | |
| TMC-1C sub-millimeter (3D, constant | 0.6 | 1.1 | 0.02 |
| Model | Density Profile | Infall Velocity |
|---|---|---|
| Bonnor Ebert Sphere | not ruled out | not ruled out |
| Inside Out Collapse | ruled out | ruled out |
| Larson Penston Model | ruled out | ruled out |
| Logotrope | ruled out | not ruled out |
| Ambipolar Diffusion | ruled out | not ruled out |