First VLBI mapping of circumstellar 29SiO maser emission
We report the first VLBI map of the =0 =1–0 maser line of 29SiO in the long-period variable star IRC +10011. We have found that this maser emission is composed of multiple spots distributed in an incomplete ring, suggesting that this maser is also amplified tangentially, as already proposed in other SiO circumstellar masers. We present also VLBI maps for the 7 mm 28SiO =1 and 2 =1–0 and the 3 mm =1 =2–1 lines. The 29SiO masing region appears to be located in a layer in between the 28SiO =1 =1–0 and 28SiO =1 =2–1 lines. In addition, we confirm that the 86 GHz maser =1 =2–1 forms in an outer region of the circumstellar envelope compared to the other 28SiO masers studied. Finally, we discuss the possible implications of the observational results on the SiO maser pumping theory.
Key Words.:
radio lines: stars – masers – technique: interferometric – stars: circumstellar matter – stars: AGB1 Introduction
SiO maser emission is found in the innermost shells of the circumstellar envelopes of Long-Period Variable (LPV) stars, evolving along the Asymptotic Giant Branch. To date, three different isotopomers of the SiO molecule are known to exhibit maser emission towards these objects: 28SiO, 29SiO and 30SiO, with relative abundances of [28SiO]/[29SiO] 20 and [28SiO]/[30SiO] 30 respectively.
Strong 28SiO maser lines have been detected, either by single-dish or interferometry techniques, in hundreds of evolved stars, from the =0 to the =4 levels and up to the rotational =8–7 transition (e. g. Pardo et al. pardo (1998)). In contrast, the 29SiO and 30SiO circumstellar emission has been less studied. In fact, maser amplification from these isotopomers has been measured in a few sources and a few rotational transitions. The first detection of a 29SiO maser line, the =0 =1–0, in a variable star was performed by Cho et al. (cho (1986)). Subsequent single-dish studies of the 0 =1–0 29SiO circumstellar masers revealed that this rare isotopomer emission also had some properties usually associated to the 28SiO lines, such as the correlation with the IR 8 m radiation or its time variability (Alcolea & Bujarrabal alcolea (1992)).
Our theoretical knowledge of these rare isotopomer emissions is still poor. Some pumping mechanisms have been proposed, but they do not compare well with observations. In order to constrain these models, we have studied several SiO maser lines in the OH/IR variable IRC +10011 (WX Psc) by means of Very Long Baseline Interferometry (VLBI) techniques. We present in this paper interferometric maps for the 7 mm =1, =2 =1–0 and 3 mm =1 =2–1 transitions of 28SiO, as well as the =0 =1–0 line of the 29SiO isotopomer. For the first time, we have been able to detect and map the 29SiO maser line at high spatial resolution (better than 1 mas). We focus on the comparison between the maps of the different maser transitions and discuss how these results may affect the overall theoretical SiO pumping scenarios.
2 Observations and data analysis
Using the NRAO111The National Radio Astronomy Observatory is a facility of the National Science Foundation operated under cooperative agreement by Associated Universities, Inc. Very Long Baseline Array (VLBA) we performed sub-milliarcsecond resolution observations of the SiO maser emission in the O-rich LPV star IRC +10011 on 2002 December 7.

The results in this paper correspond to the second epoch of observations for IRC +10011, as part of a VLBA multi-epoch/transitional study of the SiO maser emission in AGB stars (see for further details Soria-Ruiz et al. soriaruiz (2004)). The observed maser lines are summarized in Table 1. In this observational run all the SiO transitions were detected and mapped, including the 29SiO line. This is the first time that maser emission other than the main molecular species has been imaged using very long baseline interferometry.
The data were correlated in Socorro (New Mexico). In the 43 GHz observations, a bandwidth of 8 MHz was recorded and the correlator provided 256 frequency channels, thus achieving a spectral resolution of about 0.22 km s-1. For the 86 GHz transition, the bandwidth was 16 MHz and 512 spectral channels were used, being the resolution 0.11 km s-1. The calibration was done using the standard procedures for spectral line observations in the Astronomical Image Processing System (AIPS) package. For the final phase calibration we have used a strong maser component as reference, and therefore, all positions in the resulting maps are refered to the location of this spot, which is not the same for all the transitions.
Fig. 1 presents for each of the SiO transitions, the total power spectrum of Los Alamos antenna, which was used as reference in the data reduction process, and the spectrum of the flux recovered in the maps. The line profiles of the =1 and =2 =1–0 masers are similar although they differ from the other two transitions. About 75% of the =1 and =2 =1–0 maser emission was recovered after the calibration and imaging, while 10% and 25% of the emission was imaged for the 28SiO =1 =2–1 and 29SiO =0 =1–0 respectively.
| maser | restoring beam | ||
|---|---|---|---|
| transition | (MHz) | (mas) | size (mas) PA (°) |
| 28SiO =1 =1–0 | 43122.080 | 10.1 13.1 | 0.800.53 15.6 |
| =2 =1–0 | 42820.587 | 8.8 12.3 | 0.850.35 12.3 |
| 29SiO =0 =1–0 | 42879.916 | 11.8 15.3 | 0.970.73 7.7 |
| 28SiO =1 =2–1 | 86243.442 | 14.7 17.0 | 0.580.48 16.1 |
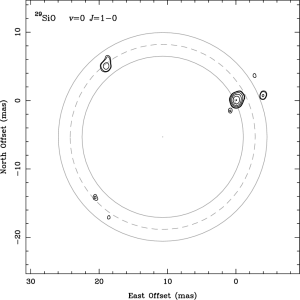
The integrated intensity maps are shown in Fig. 2. As can be seen in the upper panels, the spatial distributions of the 28SiO =1 and =2 =1–0 emissions appear to be similar, both are ring-like, with the =2 located in a slightly inner layer of the envelope. In contrast (see lower panels of Fig. 2), the 28SiO =1 =2–1 and 29SiO =0 =1–0 maser maps are composed of a fewer number of spots and the ring distribution is less clear. In order to study and compare more accurately the angular extent of the different masing regions, we fitted a ring to our observational data. To do this, we selected only the maser features with a signal-to-noise ratio larger than 6 in at least three consecutive spectral channels. These calculations give the center, the mean radius () and the width of the ring (, being twice the standard deviation of the sample). We have summarized in Table 1 for the transitions observed, the inner and outer radii derived from the fits (defined as and ) as well as the shape of the gaussian restoring beam at half power (major and minor axis and position angle of the major axis) of the resulting maps.


3 Results
Previous long baseline interferometric studies of the SiO masers demonstrated the existence of very compact emission distributed in ring-like structures (see e.g. Diamond et al. diamond (1994) and in IRC +10011 by Desmurs et al. desmurs (2000)). Those results are limited to the 28SiO transitions. Therefore, our new detection and mapping of the 29SiO =0 =1–0 illustrates for the first time the spatial distribution of this rare isotopomer emission in evolved stars.
The map of the 29SiO transition is composed of seven maser spots with velocities ranging from 5.7 to 11.3 km s-1. The brightest feature has an intensity of 1.77 Jy beam km s-1 (see bottom-right panel of Fig. 2). This 29SiO emission is the weakest among the four lines observed, with an intensity 6 or 7 times lower than the 28SiO =1–0 transitions. The emission forms a ring, though incomplete, with a mean radius of 13.5 mas, therefore this maser radiation is probably amplified tangentially, as other well studied 28SiO maser transitions; in Table 1 we show the inner and outer radii obtained from our maps following the method described in Sect. 2.
Both the =1 and =2 =1–0 28SiO emissions present a ring-like structure composed of 10–12 spots with a similar distribution. In IRC +10011, Desmurs et al. (desmurs (2000)) and Soria-Ruiz et al. (soriaruiz (2004)) found a systematic shift between these two emitting regions of about 1–3 mas, with the =2 radius being always smaller. We confirm this result since the =2 ring radius is also 1 mas smaller than the =1 one (see Table 1 and Fig. 2). We note that a similar trend has also been observed in other Mira variables in several epochs over a stellar period (Cotton et al. cotton (2004); Yi et al. yi (2005)). From the three existing maps of these 7 mm lines in IRC +10011 (Desmurs et al. desmurs (2000), Soria-Ruiz et al. soriaruiz (2004) and this work, which correspond to phases, 0.8, 0.1 and 0.5 respectively) changes of about 10% and 20% are derived for the sizes of the =1 and =2 =1–0 maser emitting regions respectively.
From our maps of rotational transitions within the same vibrational state, that is, the 28SiO =1 =1–0 and =2–1, we conclude that the latter maser is produced in a shell further away than the =1–0 one (see Table 1). Furthermore, the spatial distributions of the various components clearly differ (Fig. 2). A similar relative location of the 28SiO =1 =1–0 and =2–1 masing regions has been found in previous observations of IRC +10011 (Soria-Ruiz et al. soriaruiz (2004)). These authors have pointed out that there is a clear contradiction between the observational results, that is, the 3 mm transition in the =1 being produced in an outer region of the envelope than the corresponding 7 mm one, and the theoretical predictions, in which these two lines are spatially coincident (either radiative or collisional models). The authors conclude that this discrepancy can be overcome when the overlap between ro-vibrational transitions of H2O and 28SiO are introduced in the 28SiO excitation (see Soria-Ruiz et al. soriaruiz (2004)). Other comparisons of these 3 and 7 mm lines have been done by Doeleman et al. (doeleman (2004)) in the Orion KL nebula, finding a similar result, and by Phillips et al. (phillips (2003)) towards the AGB star R Cas. In this case, the authors claim a similar distribution of both emissions.
The 29SiO =0 =1–0 masing region appears in a layer located in between those of the 28SiO =1 =1–0 and the 28SiO =1 =2–1 emitting shells. This is in fact remarkable since these two =1 transitions require excitation temperatures of about 2000 K and the 29SiO maser is a low-excitation line [ (=1) 2 K]. Therefore, the obtained location of this masing region suggests that the rotational levels involved in the inversion are populated mainly via de-excitations from upper 0 states.
4 Discussion
Attempts to model the 29SiO maser amplification in evolved stars, and in particular the =0 =1–0 line, have been made using different excitation schemes. Robinson & Van Blerkom (robin (1981)) and Deguchi & Nguyen-Quang-Rieu (deguchi (1983)) proposed that the ground state 29SiO masers are produced if the vibrational transitions of this molecule present a significantly higher opacity along the radial direction than in the tangential one. This asymmetry with the direction is produced in slowly accelerated envelopes, yielding line profiles composed of two peaks separated by twice the expansion velocity of the envelope, similar to what is typically observed in circumstellar OH masers. These predictions are clearly in contradiction with the observations, since the line shapes of 29SiO masers are composed of narrow peaks near or at the stellar velocity (see also Alcolea & Bujarrabal alcolea (1992)). Moreover, the map for IRC +10011 shows a ring-like geometry, very probably indicating tangential amplification (as it happens in the 28SiO maser lines). Finally, a small velocity gradient is not expected for the inner region of the envelope where the 29SiO maser is produced.
The other proposed mechanism involves line overlaps between infrared transitions of 28SiO and 29SiO. This effect was first suggested by Olofsson et al. (olofsson (1981)) to explain the =0 =2–1 29SiO maser. Subsequent calculations by González-Alfonso & Cernicharo (gonzalez (1997)) suggest that the =0 =1–0 29SiO line can be efficiently pumped by the overlap between the 28SiO =2–1 =4–3 and the 29SiO =1–0 =1–0 ro-vibrational transitions.
These models do not provide calculations of the size and brightness distribution of the emitting regions, thus making it very difficult to conclude on the compatibility of the theory with the presented VLBI observations.
In any case, our observational results are in agreement with the predictions of the mechanism proposed by González-Alfonso & Cernicharo (gonzalez (1997)). For this model to work, the ro-vibrational transitions =2–1 of 28SiO must have relatively high opacities ( 1). This condition is also required for the arising of the strong 28SiO =1 and 2 masers (in both collisional and radiative excitation schemes). Therefore, the fact that the 29SiO emission arises in the same inner shell as the 28SiO =1 and 2 masers guarantees that the main requirement of the model by González-Alfonso & Cernicharo (gonzalez (1997)) is satisfied. (We also note that the 29SiO =1–0 =1–0 line also coincides in frequency, better than 2 km s-1, with the ro-vibrational line =2 – 1 72,6 – 83,5 of H2O.) Finally, as it has been mentioned in the previous section, overlaps also appear to be responsible for the discrepancies found between observations of some rotational lines of 28SiO and models (see also Bujarrabal et al. bujarrabal (1996), Herpin & Baudry herpin (2000)).
We are currently carrying out similar high resolution studies of maser lines of 28SiO and 29SiO in other evolved stars, to see if our results are reproduced in other targets, and especially the observed location of the emitting region and spatial distribution of the 29SiO =0 =1–0 line. A more extended sample will also contribute to a better understanding of which processes may be involved in the pumping and if the line overlaps play such an important role in the SiO excitation.
Acknowledgements.
This work has been financially supported by the Spanish DGI (MCYT) under projects AYA2000-0927 and AYA2003-7584.References
- (1) Alcolea, J., & Bujarrabal, V. 1992, A&A, 253, 475
- (2) Bujarrabal, V., Alcolea, J., Sánchez Contreras, C., & Colomer, F. 1996, A&A, 314, 883
- (3) Cernicharo, J., Alcolea, J., Baudry, A., & González-Alfonso, E. 1997, A&A, 319, 607
- (4) Cho, S.-H., Kaifu, N., Ukita, N., Morimoto, M., & Hayashi, M. 1986, Ap&SS, 118, 237
- (5) Cotton, W.D., Mennesson, B., Diamond, P.J., et al. 2004, A&A, 414, 275
- (6) Deguchi, S., & Nguyen-Quang-Rieu 1983, A&A, 117, 314
- (7) Desmurs, J.-F., Bujarrabal, V., Colomer, F., & Alcolea, J. 2000, A&A, 360, 189
- (8) Diamond, P.J., Kemball, A.J., Junor, W., et al. 1994, ApJ, 430, L61
- (9) Doeleman, S.S., Lonsdale, C.J., Kondratko, P.T., & Predmore, C.R. 2004, ApJ, 607, 361
- (10) González-Alfonso, E., & Cernicharo, J. 1997, A&A, 322, 938
- (11) Herpin, F., & Baudry, A. 2000, A&A, 359, 1117
- (12) Olofsson, H., Hjalmarson, A., & Rydbeck, O.E.H. 1981, A&A, 100, L30
- (13) Pardo, J.R., Cernicharo, J., Gonzalez-Alfonso, E., & Bujarrabal, V. 1998, A&A, 329, 219
- (14) Phillips, R.B., Straughn, A.H., Doeleman, S.S., & Lonsdale, C.J. 2003, ApJ, 588, L105
- (15) Robinson, S.E., & Van Blerkom, D.J. 1981, ApJ, 249, 566
- (16) Soria-Ruiz, R., Alcolea, J., Colomer, F., et al. 2004, A&A, 426, 131
- (17) Yi, J., Booth, R.S., Conway, J.E., & Diamond, P.J. 2005, A&A, in press