The extreme flare in III Zw 2:
A very detailed monitoring of a radio flare in the Seyfert I galaxy III Zw 2 with the VLA and the VLBA is presented. The relative astrometry in the VLBA observations was precise on a level of a few as. Spectral and spatial evolution of the source are closely linked and these observations allowed us to study in great detail a textbook example of a synchrotron self-absorbed jet. We observe a phase where the jet gets frustrated, without expansion and no spectral evolution. Then the jet breaks free and starts to expand with apparent superluminal motion. This expansion is accompanied by a strong spectral evolution. The results are a good confirmation of synchrotron theory and equipartition for jets.
Key Words.:
galaxies: active – galaxies: individual (III Zw 2) – galaxies: jets – galaxies: Seyfert –1 Introduction
The radio properties of quasars with otherwise very similar optical properties can be markedly different. There is a clear dichotomy between radio-loud and radio-quiet quasars in optically selected samples. The radio-loudness is usually characterized by the radio-to-optical flux ratio. In the PG quasar sample, which is probably the best studied quasar sample in the radio and optical (Kellermann et al. (1989); Boroson & Green (1992)), radio-loud and radio-weak quasars separate cleanly in two distinct populations (e.g. Kellermann et al. (1989)).
It is known that radio-loud AGN almost never reside in late type, i.e. spiral galaxies (e.g. Kirhakos et al. (1999); Bahcall et al. (1995)) whereas radio-quiet quasars appear both in spiral and in elliptical host galaxies. Furthermore, all relativistically boosted jets with superluminal motion and typical blazars have been detected in early type galaxies (e.g. Scarpa et al. (2000)). It is still unclear, why AGN in spiral galaxies, at the same optical luminosity as their elliptical counterparts, should not be able to produce the powerful, relativistic jets seen in radio galaxies.
However, a few sources with intermediate radio-to-optical ratios appear to be neither radio-loud nor radio-quiet. They form a distinct subclass with very similar radio morphological and spectral properties. They all have a compact core at arcsecond scales and a flat and variable spectrum in common. These properties are very similar to the ones of radio cores in radio-loud quasars, but their low radio-to-optical ratio and their low extended steep-spectrum emission is atypical for radio-loud quasars. ?) and ?) have identified a number of these sources, called “radio-intermediate quasars” (RIQs), and suggested that they might be relativistically boosted radio-weak quasars or “radio-weak blazars”. This would imply that most, if not all, radio-quiet quasars also have relativistic jets. In fact, Very Long Baseline Interferometry (VLBI) observations of radio-quiet quasars already have shown high-brightness temperature radio cores and jets (Falcke et al. (1996); Blundell & Beasley (1998)). A crucial test of the relativistic jet hypothesis is the search for apparent superluminal motion in these sources. A prime candidate for detecting this is the brightest radio source in the RIQ sample, III Zw 2, which we discuss in this paper.
III Zw 2 (PG 0007+106, Mrk 1501, ) was discovered by ?), classified as a Seyfert I galaxy (e.g., Arp (1968); Khachikian & Weedman (1974); Osterbrock (1977)), and later also included in the PG quasar sample (Schmidt & Green (1983)). The host galaxy was classified as a spiral (e.g. Hutchings & Campbell (1983)) and a disk model was later confirmed by fitting of model isophotes to near-IR images (Taylor et al. (1996)). A spiral arm was claimed (Hutchings (1983)) but recent observations suggest a tidal arm with several knots of star forming regions (Surace et al. (2001)). III Zw 2 is the brightest member of a group of galaxies and an extended low surface brightness emission surrounding all the galaxies suggests that there are perhaps interactions between the galaxies (Surace et al. (2001)).
The source has shown extreme variability at radio wavelengths with at least 20-fold increases in radio flux density within 4 years (Aller et al. (1985)). III Zw 2 is also known to be variable in the optical (Lloyd (1984); Clements et al. (1995)) and X-ray (Kaastra & de Korte (1988)). ?) compare the long term radio light curves of III Zw 2 with optical, IR and X-ray light curves and find indications for correlated flux variations from radio to X-ray wavelengths. Unfortunately, the time sampling at other wavelengths than radio is very poor.
III Zw 2 is a core-dominated flat-spectrum AGN with only a faint extended structure (see Unger et al. (1987) and Section 3.1). The weak extended radio emission and the host galaxy is quite typical for a Seyfert galaxy. Its [OIII] luminosity is a mere factor three brighter than that of a bright Seyfert galaxy like Mrk 3 (e.g. Alonso-Herrero et al. (1997)) which explains why it has been classified as either a Seyfert galaxy or a quasar. In this luminosity region a distinction between the two may not be of much significance.
Earlier VLBI observations of the source have only shown a high-brightness temperature unresolved core (Falcke et al. (1996), Kellermann et al. (1998)) and Millimeter-VLBI observations by ?) just barely resolved the source into two very compact components. A broadband radio spectrum showed a highly peaked spectrum which was well explained by a very compact source and synchrotron self-absorption.
The unique and simple structure and timescales of radio outbursts within 5 years makes III Zw 2 and ideal source to study radio-jet evolution relevant also to radio galaxies.
In section 2, we will describe our Very Large Array (VLA) and Very Long Baseline Array (VLBA) observations. before results from VLA monitoring are presented in sections 3.1 – 3.3. We then describe the results from VLBI observations in section 3.4. In section 4 we will discuss the results.
2 Observations
|
In 1996 III Zw 2 started a new major radio outburst and we initiated a target of opportunity program to monitor the spectral evolution of the burst with the VLA and its structural evolution with the VLBA with excellent relative astrometry of the component separation.
We observed III Zw 2 with the VLA 41 times from 1998 September until September 2001 in intervals of roughly one month. The observations were made at six frequencies ranging from 1.4 GHz to 43 GHz. Results from an observation on 1998 May 21 at 350 MHz and on 1999 July 7 at 327.5 MHz are also presented here. The source 3C48 was used as the primary flux density calibrator, and III Zw 2 was self-calibrated and mapped with the Astronomical Image Processing System (AIPS).
We also used the monitoring data at 8 and 15 GHz obtained with the Michigan 26 m telescope, and at 22 and 37 GHz from the Metsähovi radio telescope. The single dish data are important for placing the VLA and VLBA data in context, as they include a larger time window and are more closely spaced.
We observed III Zw 2 with the VLBA nine times over a period of 2.5 years at 15 and 43 GHz. Details of this observations are given in Table 1. In the last four epochs we included the background quasar J0011+0823 at 15 GHz as phase-reference source. For the second epoch, we used the Effelsberg 100 m telescope in combination with the VLBA. We observed four 8 MHz bands, each at right and left circular polarization. The initial calibration was performed with the AIPS package. A-priori amplitude calibration was applied using system temperature measurements and standard gain curves. Fringes were found in the III Zw 2 data on all baselines. The data were self-calibrated and mapped using the software package DIFMAP (Shepherd et al. (1994)). We started with phase-only self-calibration and later included phase-amplitude self-calibration with solution intervals slowly decreasing down to one minute. Results of the first five VLBA observations at 43 GHz were reported by ?).
3 Results
3.1 Extended emission of III Zw 2


?) discovered a weak radio component (23 kpc, with an angular size distance of Mpc; , as used in this paper) southwest of the nucleus. This detection was confirmed later (Kukula et al. (1998); Falcke et al. (1999)), but no additional extended radio emission was found.
To study the extended structure in more detail, we combined the raw data of eleven VLA observations. In the combined data we used data from the VLA in A, B, C and D configuration. Since the nucleus is highly variable, we subtracted it from the uv-data before combining the data. The combined data set was then self-calibrated and mapped. The combined VLA maps at 1.4, 4.8, 8.4 and 15 GHz are shown in Fig. 1 and 2. The 4.8, 8.4 and 15 GHz maps were convolved with a large beam of 22 arcseconds to detect faint extended structure. We detected the southwestern component at all four frequencies. This radio lobe or hotspot is connected to the nucleus with a jet-like structure visible at 1.4, 4.8 and 8.4 GHz. At 1.4 GHz one sees an indication that the jet is ejected in northwestern direction and gets deflected by almost towards the southwestern lobe. This is also in accordance with the direction of the jet on sub-parsec scales (see section 3.4).
We also discovered a weaker secondary radio lobe (32.6 kpc) on the opposite side of the galaxy at 1.4 to 8.4 GHz. If one assumes equal expansion velocities for both lobes, a simple time travel argument (e.g., Ryle & Longair (1967)) would suggest that the weaker northeastern lobe is approaching and the brighter southwestern lobe is receding. However, this scenario can not explain the differences in flux density between the two lobes. One would expect the approaching lobe to be brighter due to relativistic boosting of the emission.
Hence it is more likely that the armlength difference is explained by an asymmetric expansion of the the two lobes due to different intrinsic velocities or differences in the ambient medium, i.e. the medium in the southwest of III Zw 2 has a higher density than the medium in the northeast. This is supported by the fact that there is a close companion galaxy only to the south.

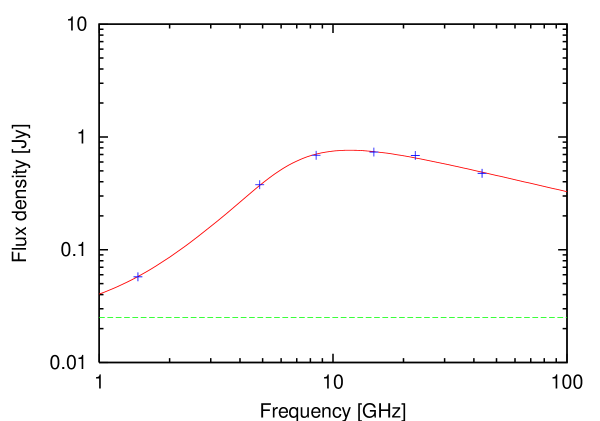
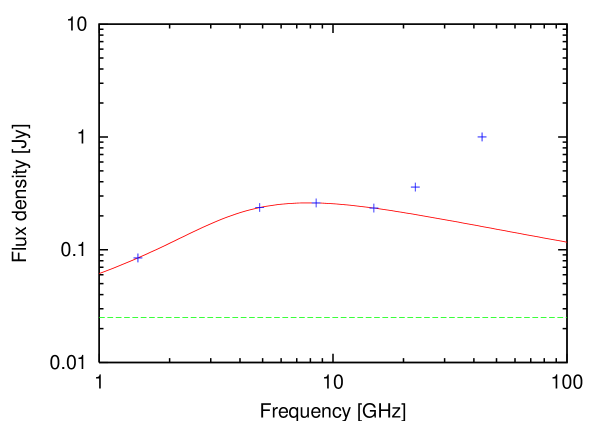
The spectra of the two radio lobes are shown in Fig 3. The 350 and 327.5 MHz data were from our observations on 1998 May 21 and 1999 July 7 respectively where we also detected the southwestern component. Both radio lobes have a steep spectrum with spectral indices of to . Values around -0.7 are typical for synchrotron emission of optically thin radio lobes of radio galaxies. There is no break or a steepening of the spectrum towards higher frequencies. This indicates that both radio lobes are still active and powered by the central engine. Otherwise, the high energy electrons would have lost most of their energy due to radiation losses. This would lead to a steepening in the spectrum at higher frequencies.
3.2 Variability


The core of III Zw 2 shows extreme variability at radio wavelengths. Long time radio light curves of this source spanning more than 20 years are shown in Fig. 4 using data from Michigan, Metsähovi, and the VLA. One can see major flares with 30-fold increases in radio flux density within two years. These major flares occur roughly every five years with sub-flares on shorter timescales.
The outburst discussed in this paper started in 1996 and we monitored this flare with the VLA. The good time sampling of one observation each month allowed us to study this outburst in great detail. Lightcurves from the most recent flare at six frequencies from 1.4 to 43 GHz are shown in Fig. 5 and 6 together with our best model fits to the data. Since the Michigan data at 8 GHz is rather noisy compared to the other frequencies and the VLA data, we used only our VLA monitoring data for the fits at this frequency. At 15, 22 and 37 GHz we used the VLA data as well as the Michigan and Metsähovi data.
First we fitted a linear rise and decay to the flare. The rise is consistent with a linear fit at all frequencies. The decay is also linear at 4.8 GHz. At higher frequencies, the decay is linear only for a short time period and deviates significant from a linear behavior at later times. Thus we used only the linear part of the lightcurves for our fits.


The decay at higher frequencies can be fitted much better with an exponential decay. Thus we fitted also an exponential rise and decay,
| (1) |
| (2) |
to the lightcurves. The fitting parameters are , the maximum amplitude of the flare and the flare rise and decay timescales and . The epochs of the flare maximum were taken from the observation with the highest flux density. The increase of the lightcurves can also be fitted by an exponential rise and the exponential decay fits the outburst until a new smaller flare starts.
The slopes of the linear rise () and decay (), the exponential rise and decay timescales and and the epoch of the flare maximum are listed in Table 2 for all six frequencies.
|
||||||||||||||||||||||||||||||||||||||||||||||||||
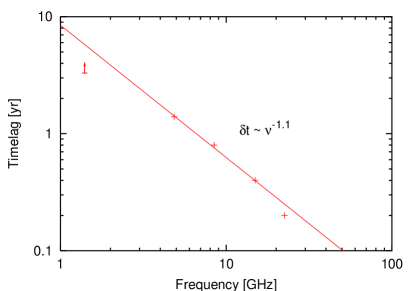
The lightcurve reaches its peak first at higher frequencies. The time-lag between the peak at 43 GHz and the peak at lower frequencies is shown in Fig. 7 and is best fit with a power law. The rise and decay are faster at higher frequencies than at lower frequencies. This behavior is typical for flares in AGN (e.g. Türler et al. (1999)).
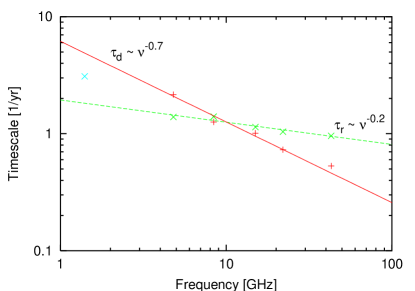
At 4.8 GHz the rise is faster than the decay, while at 15, 22 and 43 GHz the rise is slower than the decay. This is the case for the linear and the exponential fits to the flare. At 8.4 GHz the linear rise is slightly slower than the linear decay while the exponential rise slightly faster than the exponential decay is. The rise and decay timescales are plotted as a function of frequency in Fig. 8. The data can be fitted with power laws and . Only the rise timescale at 1.4 GHz deviates from this power law. However, the quiescence flux at 1.4 GHz is comparable to the flux density of the outburst and will affect this data point.
The small dependancy of the rise timescale on frequency indicates that optical depth effects are not very important during the rise. This is in contrast to the decay, where optical depth effects are clearly important.
?) modeled the radio lightcurves of flares at 22 and 37 GHz in 85 extragalactic radio sources. They fitted an exponential curve to the rise and the decay and found that in virtually all flares a good model-fit could be obtained using a constant ratio between decay and rise timescale of , i.e. the rise is faster than the decay. These flares can be identified with the ejection of new VLBI components in the jets.
The fact that the lightcurves of III Zw 2 at 15, 22 and 43 GHz show the opposite behavior with ratios of , i.e. the decay is faster than the rise, indicates that different physical processes are involved in this source. However, it can not be excluded that the flare is composed of two closely spaced flares.
3.3 Spectral evolution
During the outburst the spectrum of the source also showed variations. An almost simultaneous broadband radio spectrum from 1.4 to 660 GHz during the increase in flux density in May 1998 was presented in ?). The spectrum was highly inverted at centimeter wavelengths () with a turnover frequency around 43 GHz. At frequencies above 43 GHz the spectrum became steep with a spectral index of , i.e. a textbook-like synchrotron spectrum.
Our VLA monitoring of the spectral evolution started in September 1998. Four of the 41 epochs yielded no or bad data due to bad weather or hardware failure. We fitted the remaining spectra with a broken power-law plus a flat and constant quiescence spectrum ,
| (3) |
where and are the spectral indices of the rising and declining parts of the spectrum. and are fitting parameters and are not exactly equal to the maximum flux density and the peak frequency of the fitted spectrum.
We assume a flat spectrum for the quiescence flux which is typical for quiescent cores in active galactic nuclei. Since we could fit all epochs with a value of 25 mJy, we adopted this value for all epochs.
The approach with a broken power-law has the disadvantage, that there are ambiguities in the parameters if the peak of the spectrum falls beyond the frequencies covered in the observations.
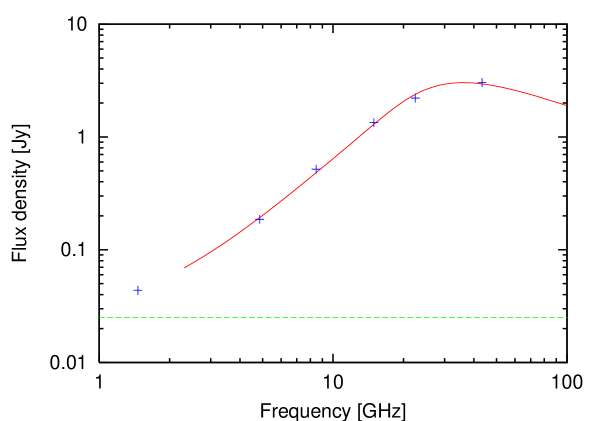
This situation was the case in our first three observations in September 1998, October 1998 and November 1998. The spectral shape in these three epochs was very similar to the May 1998 spectrum. Highly inverted at centimeter wavelengths, a flattening towards higher frequencies, and possibly a turnover around 43 GHz, but with higher flux densities (see Fig. 9, top). Thus we assumed the spectral index of the declining part of the spectrum to be , the value of the May 1998 observation. This is a reasonable assumption since the overall spectral shape did not change significantly between May 1998 and September 1998.
The temporal evolution of the fitting parameters , and can be seen in Fig. 10 and Fig 11. In some epochs we covered only 5 frequencies from 1.4 to 22 GHz. The absence of the 43 GHz flux density in these epochs could bias the results of the spectral fitting. Thus we marked the epochs with only 5 frequencies in Fig. 10 with triangles while the epochs with 6 frequencies are indicated by circles. One can see that the fits of both subsets are in good agreement.


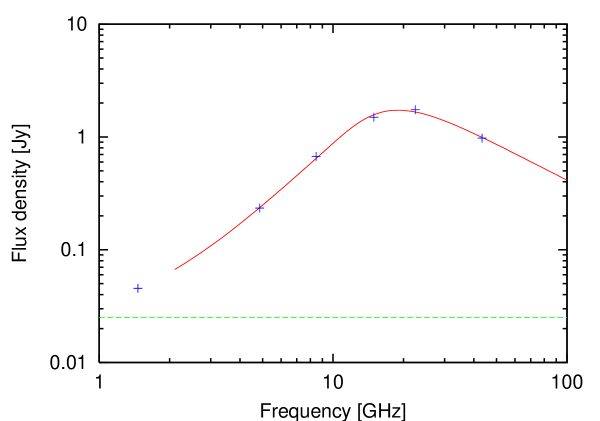
After November 1998 the spectrum underwent a dramatic change (see also Fig. 9). The turnover frequency , that stayed roughly constant at around 30 GHz from May 1998 until November 1998 dropped to 23 GHz in December 1998. In the following months, the turnover drops further until it reached 10 GHz in June 1999. During the next year the turnover frequency showed only smaller and slower variations and stayed roughly constant at GHz. The drop in turnover frequency to 4 GHz in the first months of 2000 can be explained by the onset of a new minor flare at high frequencies (see 43 GHz lightcurve in Fig. 6). The new flare caused a flattening of the optical thin part of the spectrum and a shift of the turnover to lower frequencies. The flattening can also be seen in Fig. 11 where the spectral index changes from to during that time.
The spectral index in the optical thick part of the spectrum stays at and slowly flattens towards later times.
A new strong outburst started at high frequencies in January 2001 (see 22 and 43 GHz lightcurves in Fig. 6) and one would have to model two independent broken power-laws to the spectrum. Since one broken power-law is characterized by four parameters , , and , our six data points in each spectrum are not sufficient to model two independent components with four parameters each. In the first two epochs of the new flare, only the 22 and 43 GHz data were affected and we fitted the broken power-law to the remaining four frequencies.
The fast change in peak frequency implies also a strong morphological change, i.e. a rapid expansion. This prediction was tested by VLBI observations which are described in the next section.
3.4 Structural evolution
3.4.1 43 GHz Results
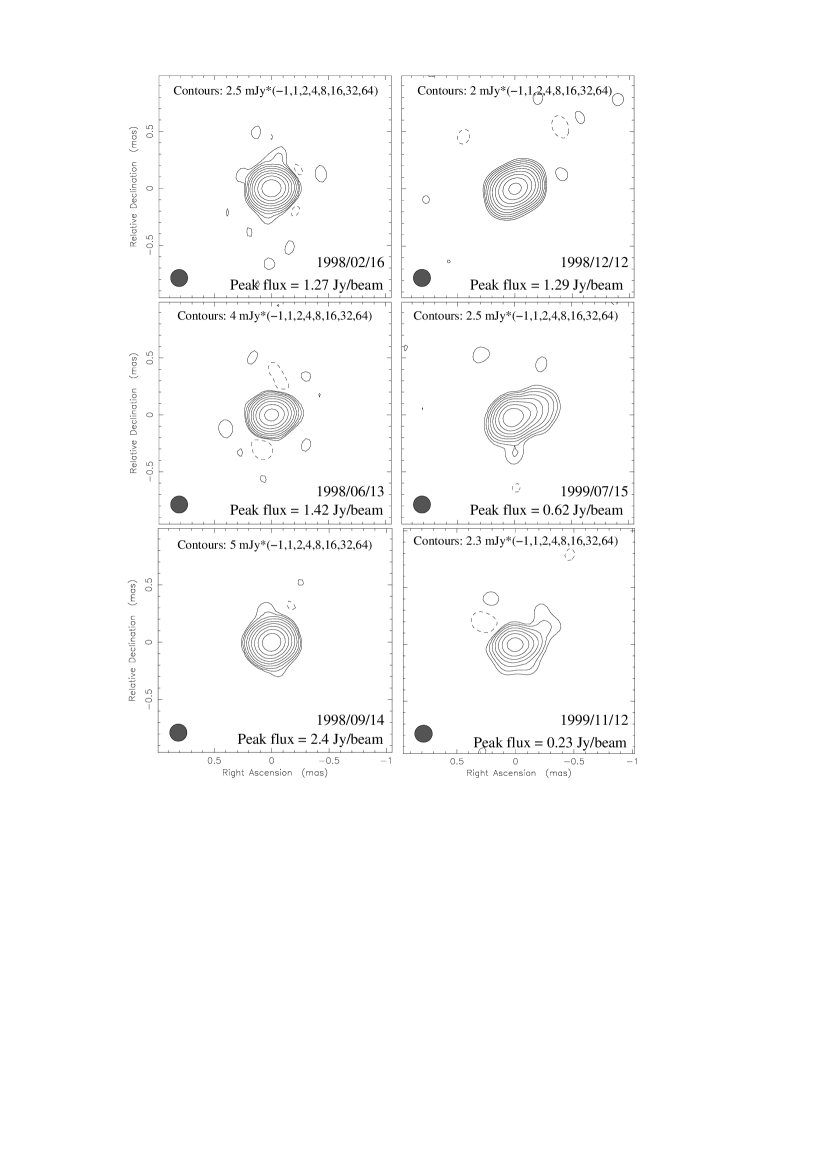
The first three VLBA observations were made during the first phase of the flare, marked by the increase in flux density and a roughly constant spectral peak above 30 GHz. The constancy of the peak frequency indicates no structural change, since the turnover is caused by synchrotron self-absorption (Falcke et al. (1999)). The source is slightly resolved and the long baselines show non-zero closure phases, indicating an asymmetric structure. Two point-like components were fitted to the uv-data to represent the extent of the source. The source shows no structural change (see Fig. 12) and the separation of the two components during this phase of the flare stayed constant at , corresponding to pc. The excellent agreement within 2 as between the first three epochs shows the high quality of the data and the accuracy of the relative astrometry.
After November 1998, the VLA monitoring shows a dramatic change in the spectrum. The peak frequency dropped quickly to 10 GHz within a few month (Fig. 10). In the framework of a simple equipartition jet model with a dependence (e.g., Blandford & Konigl (1979); Falcke & Biermann (1995)) one would expect a rapid expansion. With a source size of 0.11 pc and a turnover frequency of 33 GHz in the first phase with no expansion one expects a source size of 0.36 pc for a self-absorption frequency of 10 GHz according to the spectral evolution.
|
Indeed, the fourth VLBA epoch, observed only one month after the start of the spectral evolution, shows first signs of an expansion. The fifth epoch shows a dramatic structural change (see Fig. 12) and a model of three point-like components is required to describe the data now. The separation between the outer components is now corresponding to pc. This is in good agreement with the expected value of 0.36 pc from the equipartition jet model. The structure in the sixth epoch is very similar to the fifth epoch but with lower flux density. This is again expected, since the turnover frequency stayed around 10 GHz.
The separation of the outer components for all six epochs is plotted in Fig. 13 (upper panel). For the first three epochs we measure an upper limit for the expansion speed of 0.04 . The rapid expansion between the fourth and fifth epoch shows an apparent speed of 1.25 . Between the last two epoch we detected again no expansion with an upper limit of 0.04 .
Unfortunately the source was too weak at 43 GHz to be detected at the last three epochs.
3.4.2 15 GHz Results
At 15 GHz the picture looks completely different. The source is very compact but slightly resolved in all epochs except the first and we fitted two point-like components to the uv-data. The flux densities, separations and position angles of the two components are listed in Table 4. The component separation of all epochs is also plotted in Fig. 13. One can see a constant expansion with an apparent expansion speed of . Simple extrapolation backwards suggests that the expansion has started in May 1996. This is consistent with the onset of the new flare in the 37 GHz lightcurve in Fig. 4. The flare started between two 37 GHz observations in May and October 1996.
One should note that the component separation of the fifth epoch shows a deviation from a constant expansion. If one splits up the separation into its north-south and east-west components the scatter is larger in the north-south direction. This is expected, since the beam of the VLBA is elongated in the north-south direction. This relatively large scatter in north-south direction also explains the scatter in the positions angles in Table. 4.
|


4 Discussion
The stop-and-go behavior and the apparent contradiction between the 43 GHz and 15 GHz data can be explained by a jet interacting with the interstellar medium in combination with optical depth effects in an ’inflating-balloon model’.
In this model, the initial phase of the flare can be explained by a relativistic jet interacting with the interstellar medium or a torus that creates a shock and gets frustrated. A relativistic shock was proposed by ?) due to synchrotron cooling times of 14-50 days which are much shorter than the duration of the outburst. The ultra-compact hotspots are pumped up, powered by the jet and responsible for the increase in flux density. The post-shock material expands with the maximum sound speed of a magnetized relativistic plasma of c.
Since the source is optically thick at 15 GHz, one observes the outside of the source, i.e. the post-shock material expanding with sound speed. At 43 GHz, the source is optically thin and one can look inside the source and see the stationary hotspots.
The rapid expansion at 43 GHz thereafter has marked the phase where the jet breaks free and starts to propagate relativistically into a lower-density medium. Then the expansion stops again when the jet hits another cloud.
The fact that spectral and structural evolution during the outburst are closely linked demonstrates that we are dealing with a real physical expansion and not only a phase velocity. The observations described here produced a large amount of data that are all consistent with a simple synchrotron self-absorbed jet model.
For the question of the nature of the radio-loud/radio-quiet dichotomy this means that radio-weak and radio-loud quasars can indeed have central engines that are in many respects very similar. Their optical properties are almost indistinguishable and both types of quasars can produce relativistic jets in their nuclei. The finding of superluminal motion supports the hypothesis of ?) and ?) that RIQs are relativistically boosted intrinsically radio-weak AGN. Recently, a further relativistic jet in a radio-quiet quasar was found by ?).
However, the nature of the medium interacting with the jet remains unclear. The outbursts could be explained by a precessing jet that hits a molecular torus roughly every five years. So far, no direct evidence for molecular gas in the nucleus of III Zw 2 was found.
Some Seyfert galaxies have shown H2O maser emission associated with the nuclear jet. In these sources, the maser emission is the result from an interaction of the jet with a molecular cloud. One example is the Seyfert II galaxy Mrk 348 (see Peck et al. (2003)). In this source, the ejection of a new VLBI component has lead to a flare of the radio source similar to the outburst in III Zw 2. The outburst started with a peak frequency of 22 GHz which gradually decreased over 20 months. During this outburst, H2O maser emission was found (Falcke et al. (2000)). Searches for similar water maser emission in III Zw 2 with the Effelsberg 100-m telescope yielded no detection (Henkel, private communication).

In the currently favoured youth model for Compact Steep Spectrum (CSS) and GHz Peaked Spectrum (GPS) sources, the linear size of a source is related to the age of the source. The correlation between the turnover frequency and the projected linear size (e.g., O’Dea & Baum 1997) suggests that the turnover frequency decreases while the source ages and expands. Therefore the sources with the highest turnover frequencies represent the youngest objects. In Fig. 14 we plot linear size vs. turnover frequency for GPS and CSS sources. We include III Zw 2 before (GHz; size 0.11 pc) and after (GHz; size 0.37 pc) the expansion and the two points lie at the lower end of the scatter of the linear correlation for GPS/CSS sources. This could be explained by projection effects. Since III Zw 2 is a Seyfert 1 galaxy with superluminal motion, the jet is probably close to the line-of-sight. Hence the true size would be underestimated, and the points in the plot move to the right. However, the evolution of III Zw 2 during the expansion is almost parallel to the correlation. This implies that the same physical processes, i.e. synchrotron self-absorption, are involved in III Zw 2 and in GPS/CSS sources. In the case of III Zw 2, the radio source is much older than the current outburst. Hence, it is possible that some of the GPS/CSS sources are in fact not young, but only show intermittent activity.
III Zw 2 remains an extremely unusual object. Future simultaneous multi-frequency observations of new outbursts would help to confirm the proposed scenario of a jet-ISM interaction.
Acknowledgements.
The National Radio Astronomy Observatory is a facility of the National Science Foundation operated under cooperative agreement by Associated Universities, Inc. The UMRAO is partially supported by funds from the National Science Foundation and from the Univ. of Michigan Dept. of Astronomy. The 100 m telescope at Effelsberg is operated by the Max-Planck-Institut für Radioastronomie in Bonn.References
- Aller et al. (1985) Aller H. D., Aller M. F., Latimer G. E., Hodge P. E., 1985, ApJS, 59, 513
- Alonso-Herrero et al. (1997) Alonso-Herrero A., Ward M. J., Kotilainen J. K., 1997, MNRAS, 288, 977
- Arp (1968) Arp H., 1968, ApJ, 152, 1101
- Bahcall et al. (1995) Bahcall J. N., Kirhakos S., Schneider D. P., 1995, ApJ, 450, 486
- Blandford & Konigl (1979) Blandford R. D., Konigl A., 1979, ApJ, 232, 34
- Blundell & Beasley (1998) Blundell K. M., Beasley A. J., 1998, MNRAS, 299, 165
- Blundell et al. (2003) Blundell K. M., Beasley A. J., Bicknell G. V., 2003, ApJ, 591, L103
- Boroson & Green (1992) Boroson T. A., Green R. F., 1992, ApJS, 80, 109
- Brunthaler et al. (2000) Brunthaler A., Falcke H., Bower G. C., et al., 2000, A&A, 357, L45
- Clements et al. (1995) Clements S. D., Smith A. G., Aller H. D., Aller M. F., 1995, AJ, 110, 529
- Falcke & Biermann (1995) Falcke H., Biermann P. L., 1995, A&A, 293, 665
- Falcke et al. (1999) Falcke H., Bower G. C., Lobanov A. P., et al., 1999, ApJ, 514, L17
- Falcke et al. (2000) Falcke H., Henkel C., Peck A. B., et al., 2000, A&A, 358, L17
- Falcke et al. (1996) Falcke H., Patnaik A. R., Sherwood W., 1996, ApJ, 473, L13
- Falcke et al. (1996) Falcke H., Sherwood W., Patnaik A. R., 1996, ApJ, 471, 106
- Hutchings (1983) Hutchings J. B., 1983, PASP, 95, 799
- Hutchings & Campbell (1983) Hutchings J. B., Campbell B., 1983, Nat., 303, 584
- Kaastra & de Korte (1988) Kaastra J. S., de Korte P. A. J., 1988, A&A, 198, 16
- Kellermann et al. (1989) Kellermann K. I., Sramek R., Schmidt M., Shaffer D. B., Green R., 1989, AJ, 98, 1195
- Kellermann et al. (1998) Kellermann K. I., Vermeulen R. C., Zensus J. A., Cohen M. H., 1998, AJ, 115, 1295
- Khachikian & Weedman (1974) Khachikian E. Y., Weedman D. W., 1974, ApJ, 192, 581
- Kirhakos et al. (1999) Kirhakos S., Bahcall J. N., Schneider D. P., Kristian J., 1999, ApJ, 520, 67
- Kukula et al. (1998) Kukula M. J., Dunlop J. S., Hughes D. H., Rawlings S., 1998, MNRAS, 297, 366
- Lloyd (1984) Lloyd C., 1984, MNRAS, 209, 697
- Miller et al. (1993) Miller P., Rawlings S., Saunders R., 1993, MNRAS, 263, 425
- O’Dea & Baum (1997) O’Dea C. P., Baum S. A., 1997, AJ, 113, 148
- Osterbrock (1977) Osterbrock D. E., 1977, ApJ, 215, 733
- Peck et al. (2003) Peck A. B., Henkel C., Ulvestad J. S., et al., 2003, ApJ, 590, 149
- Ryle & Longair (1967) Ryle M. S., Longair M. S., 1967, MNRAS, 136, 123
- Salvi et al. (2002) Salvi N. J., Page M. J., Stevens J. A., et al., 2002, MNRAS, 335, 177
- Scarpa et al. (2000) Scarpa R., Urry C. M., Falomo R., Pesce J. E., Treves A., 2000, ApJ, 532, 740
- Schmidt & Green (1983) Schmidt M., Green R. F., 1983, ApJ, 269, 352
- Shepherd et al. (1994) Shepherd M. C., Pearson T. J., Taylor G., 1994, BAAS, 26, 987
- Surace et al. (2001) Surace J. A., Sanders D. B., Evans A. S., 2001, AJ, 122, 2791
- Türler et al. (1999) Türler M., Courvoisier T. J.-L., Paltani S., 1999, A&A, 349, 45
- Taylor et al. (1996) Taylor G. L., Dunlop J. S., Hughes D. H., Robson E. I., 1996, MNRAS, 283, 930
- Unger et al. (1987) Unger S. W., Lawrence A., Wilson A. S., Elvis M., Wright A. E., 1987, MNRAS, 228, 521
- Valtaoja et al. (1999) Valtaoja E., Lähteenmäki A., Teräsranta H., Lainela M., 1999, ApJS, 120, 95
- Zwicky (1967) Zwicky F., 1967, Adv. Astron. Astrophys., 5, 267