Cl 1205+44, a fossil group at z = 0.59
Abstract
This is a report of Chandra, XMM-Newton, HST and ARC observations of an extended X-ray source at z = 0.59. The apparent member galaxies range from spiral to elliptical and are all relatively red (i′- about 3). We interpret this object to be a fossil group based on the difference between the brightness of the first and second brightest cluster members in the -band, and because the rest-frame bolometric X-ray luminosity is about h erg s-1. This makes Cl 1205+44 the highest redshift fossil group yet reported. The system also contains a central double-lobed radio galaxy which appears to be growing via the accretion of smaller galaxies. We discuss the formation and evolution of fossil groups in light of the high redshift of Cl 1205+44.
1 Introduction
In a ROSAT survey of extended sources (Adami et al., 2000; Romer et al., 2001), we found a source showing extended X-ray emission but with only a single faint optical (R-band) counterpart. On deep optical images, the colors of the galaxies in the X-ray area were red enough that the program HYPERZ derived a photometric redshift greater than 1. This led to Chandra and XMM-Newton observations of the object we designate as Cl 1205+44. We find that the system is a fossil group at the highest redshift yet published (0.59 versus typical values of ). The system is particularly interesting because it allows us to explore evolutionary tracks of fossil groups and to consider scenarios for the evolution of galaxies in groups.
Fossil groups have been defined (e.g. Jones et al., 2003) as being similar to groups (poor clusters) in which the luminosity function of the member galaxies has been modified by accretion of galaxies onto the central galaxy while the rest of the system remains unevolved for approximately 4 Gyrs. The galaxy accretion onto the D galaxy leads to a magnitude difference between the first and second brightest galaxies (m12) of 2 or higher in the rest frame R or V bands within one half a virial radius, where Jones et al. (2003) use the following to calculate the virial radius: rvir = keV) h Mpc.
Moreover, Cl 1205+44 is interesting because it harbors a double lobed radio source which is also a D (central dominant) galaxy. Such systems can be directly compared with the model of West (1994). Also, the radio source simply makes the group more complex and its formation could be related to cooling flows111Cooling flow literature is too extensive to comprehensively reference; a few references that directly relate radio lobes to X-rays in relatively poor systems with X-ray emission are: Carilli et al. (1994); Harris et al. (2000); McNamara et al. (2000) on one hand, and energy injection on the other (e.g. Sun et al., 2003).
A D galaxy that is a radio source is a tracer for finding fossil groups which led J. S. Mulchaey (2003, private communication; see also Mulchaey et al., 2003) independently to identify this object as a fossil group and to obtain HST and redshift observations. The HST and redshift data nicely complement the Chandra, XMM-Newton, - and -band data we have obtained.
Our study of Cl 1205+44 also adds one more data point to the topic of preheating. Recent studies of simulations of preheating can be found, for example, in Borgani et al. (2004). The possibility of preheating of the ICM in groups and clusters has taken on added significance, as it relates to the Suyanev-Zel’dovich (SZ) effect, which can influence the interpretation of the high order power spectrum of the Cosmic Microwave Background (CMB; Lin et al., 2004).
In this paper, we report the results of our multi-wavelength analysis and discuss how Cl 1205+44 fits into the larger picture of fossil group formation and evolution.
We will use H0=70 km s-1 Mpc-1, =0.7 and =0.3 hereafter. At a redshift of 0.5915, which is the most likely redshift of Cl 1205+44, the angular scale for this cosmology is 6.64 kpc/′′.
2 Observations and Analysis
2.1 Optical and IR observations
We made observations in the and -bands at the ARC telescope222See http://www.apo.nmsu.edu for details.. For the -band, we used the Spicam camera for a net total exposure time of 7,200 seconds at a mean airmass of 1.15, and for the -band we used the GRIMII camera for a net total exposure time of 7,200 seconds. We took separate 10 minute exposures to acquire the -band data and 10 to 30 second exposures to accumulate the data. The -band data were reduced using the ESO-MIDAS package and the data were reduced using DIMSUM, a NOAO/IRAF tool. The zero points were computed using standard stars observed at the same time as the scientific data and at similar air masses.
The HST data were retrieved from the archive (proposal ID: 8131, PI: Mulchaey). They consist of second dithered R-band WFPC2 (F702W filter) exposures. We reduced the data using the drizzle IRAF package (Fruchter & Hook, 2002). We generated catalogs of detected objects using SExtractor (version 2.3 Bertin & Arnouts, 1996) using a detection threshold of 1.5 and an analysis threshold of 2.
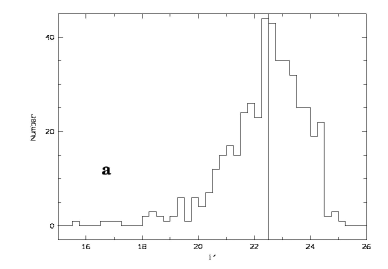
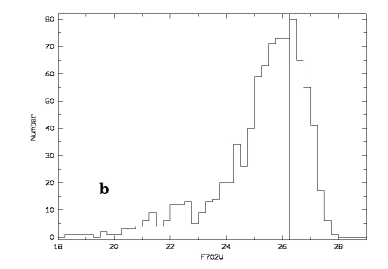
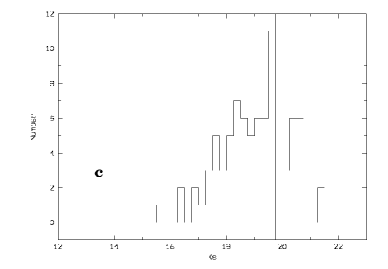
We used the fixed aperture magnitudes from SExtractor for the HST magnitudes and we used the SExtractor auto-magnitude feature to derive the magnitudes for the ARC data. Figure 1 gives the magnitude histograms in the three magnitude bands available to us (in the ARC Spicam field of view for , in the ARC GRIMII field of view for and in the HST WFPC2 field of view for F702W). These histograms allow us to estimate an upper limit to the completeness value of the magnitude in each bands: 22.25, F702W26.25 and 19.75. The respective solid angle coverage of the instruments is: WFPC2 image: 2.22.2 arcmin2, image: 64.3 arcmin2, image: 22 arcmin2.
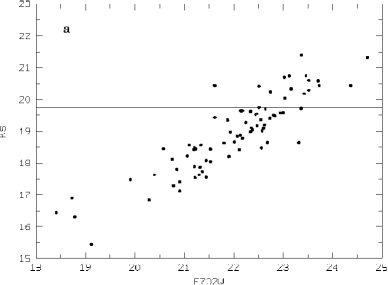
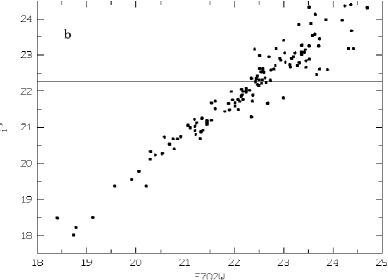
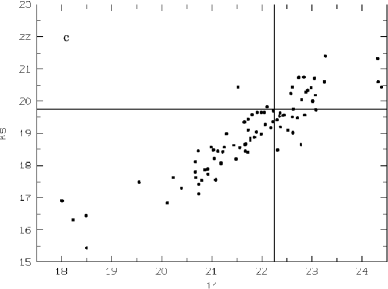
In order to assess the quality of our data, we plotted the magnitudes in the different bands against each other as shown in Figure 2. We estimate from the results a relative 1 uncertainty between magnitudes (limiting ourselves to the brightest completeness limit) of 0.26 mag between F702W and and of 0.36 mag between and . This gives an upper limit to the magnitude uncertainty since some of the scatter is due to the intrinsic color variations of the objects.
As an external test, we compared our magnitudes with the estimates for the two objects in the field bright enough to be detected by 2MASS333http://www.ipac.caltech.edu/2mass/ (including the D galaxy). We have reasonable agreement (for the two objects, K2MASS= and +0.26) given that these objects are below the 2Mass completeness limit.
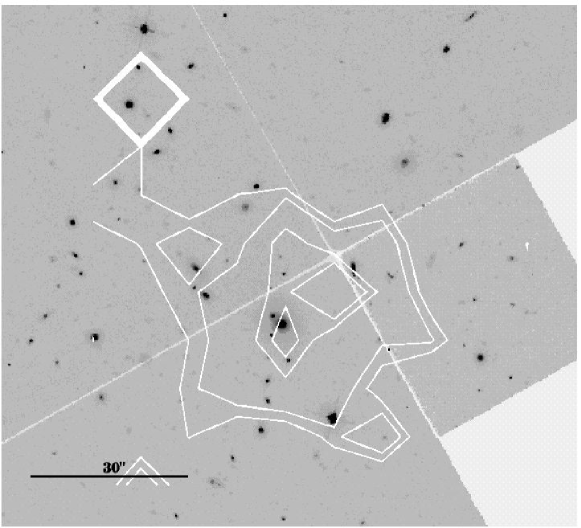
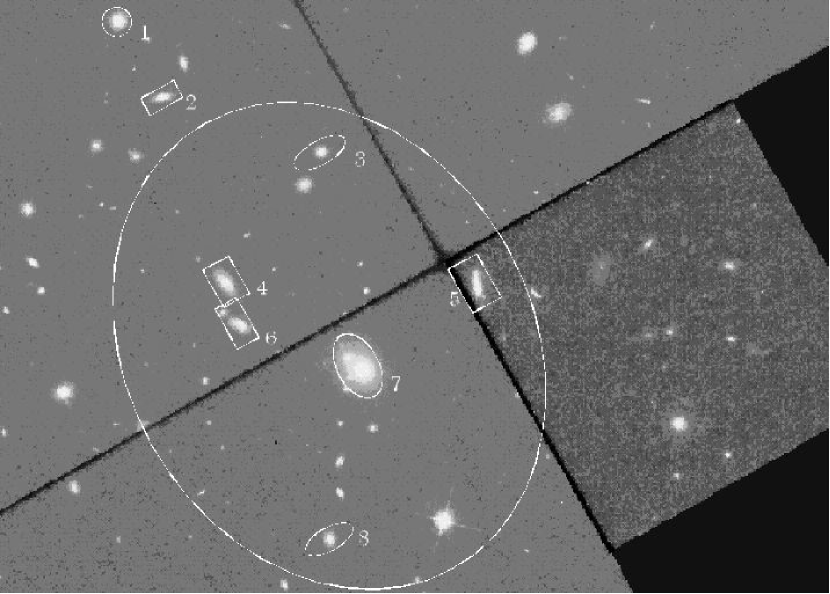
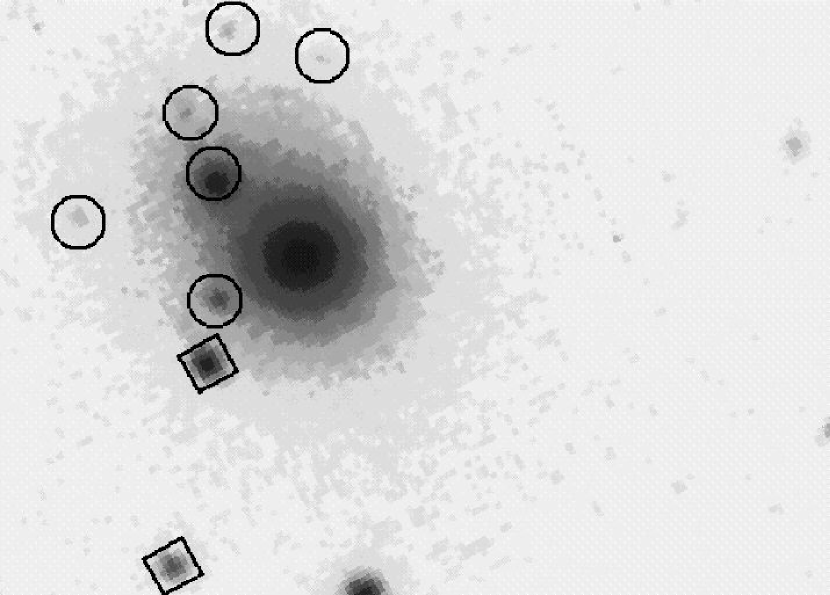
For use in our discussion below, we calculated the total R-band luminosity. To derive this number, we used the total F702W flux enclosed444We excluded the star, which is the brightest object toward the top of the figure but inside the contours; it is south-southwest of the D galaxy by the X-ray contours in Figure 3. We estimate that approximately 90% of our derived value of LR comes from the galaxies enclosed by rectangles in Figure 4. Therefore, the LR value is probably accurate to within 20%. The 20% uncertainly is also consistent with subtracting the flux of #6 in Figure 3 (see also Table 1) which, based on its colors, is the most likely in our list not to be a cluster member. The uncertainty in LR does not affect any conclusion we draw in the discussion section of this paper. The F702W total luminosity is L⨀. Converting to the RJ band used by Jones et al. (2003), we obtain LR = L⨀. The K-correction to z = 0 gives a (rest frame) value of L L⨀. Finally, to compare with Jones et al., we use H0=50 and q0 = 0.5 which leads to L L⨀.
2.2 Redshift
Since the X-ray data were not of sufficient signal to noise ratio to constrain the cluster redshift (see below), we needed optical spectra of the galaxies belonging to the system. By chance, this system was observed by J. S. Mulchaey (2003, private communication) in his ongoing fossil group survey and he kindly provided us with the value of the redshift of the brightest galaxy of the putative fossil group, z = 0.5915. These data plus the positional coincidence of the brightest group galaxy (called the D galaxy hereafter) with the centroid (see §2.3.4) of the X-ray emission firmly identifies the extended X-ray emission with the brightest galaxy and the associated galaxies in Table 1.
2.3 X-ray Observations
We were granted time to observe Cl 1205+44 with the XMM-Newton (June 2003, 52,200 s) and Chandra (October 2003, 31800 s) satellites.
2.3.1 Chandra data
The Chandra observation was made in “Very Faint” mode with a time resolution of 3.24 sec and a CCD temperature of C. The data were reduced using CIAO version 3.0.1555http://asc.harvard.edu/ciao/ following the Standard Data Processing, producing new level 1 and 2 event files.
We have further filtered the level 2 event file, keeping only ASCA grades 0, 2, 3, 4 and 6, and restricted our data reduction and analysis to the back-illuminated chip, ACIS-S3. We checked that no afterglow was present and applied the Good Time Intervals (GTI) supplied by the pipeline. Then, we have checked for flares using the light-curve in the [10–12 keV] band; no flare was detected and the total exposure time was 29,711 s.
We have used the CTI-corrected ACIS background event files (“blank-sky”), produced by the ACIS calibration team666http://cxc.harvard.edu/cal/Acis/WWWacis_cal.html, available from the calibration data base (CALDB). The background events were filtered, keeping the same grades as the source events, and then were reprojected to match the sky coordinates of the Cl 1205+44 ACIS observation.
2.3.2 XMM-Newton data
Cl 1205+44 was observed in standard Full Frame mode using the “thin” filter with the two EPIC MOS1 and MOS2 and the PN detectors. The basic data processing (the “pipeline” removal of bad pixels, electronic noise and correction for charge transfer losses) was done with package SAS V5.3, thus creating calibrated event files for each detector.
For the MOS1 and MOS2 cameras, following the standard procedure, we have discarded the events with FLAG and PATTERN ; for the PN, we have restricted the analysis to the events with PATTERN 4 and Flag =0.
The light-curves in the [10–12 keV] band that we have produced showed that there were severe flaring events during the observation. Filtering out the periods with flares substantially reduced the exposure times: 21,223 s, 20,861 s, and 16,478 s for the MOS1, MOS2 and PN, respectively (from an initial 52.2 ks).
With the cleaned event files, we have created the redistribution matrix file (RMF) and ancillary response file (ARF) with the SAS tasks rmfgen and arfgen for each camera and for each region that we have analyzed.
The background was taken into account by extracting spectra from the blank sky templates described by Lumb et al. (2002), and reprojected to the same coordinates and roll angle of the Cl 1205+44 XMM-Newton observation. The same filtering procedure was applied to the background event files. We give a breakdown of the number of counts used per detector in the fitting in Table 2.
2.3.3 X-ray Spectral fits
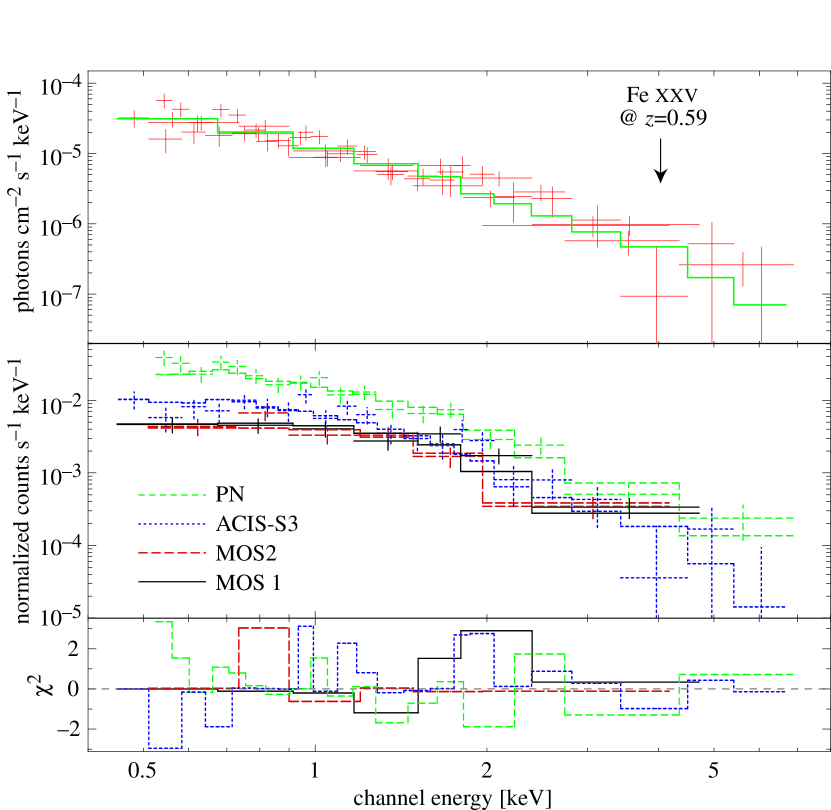
Spectra were analyzed with XSPEC 11.3. We have simultaneously fit all four spectra from the XMM-Newton MOS1, MOS2, PN and Chandra ACIS-S3 cameras. The spectra were rebinned so that we could use the standard minimization when fitting the spectra. We have applied the mekal plasma spectral model (Kaastra & Mewe, 1993; Liedahl et al., 1995).
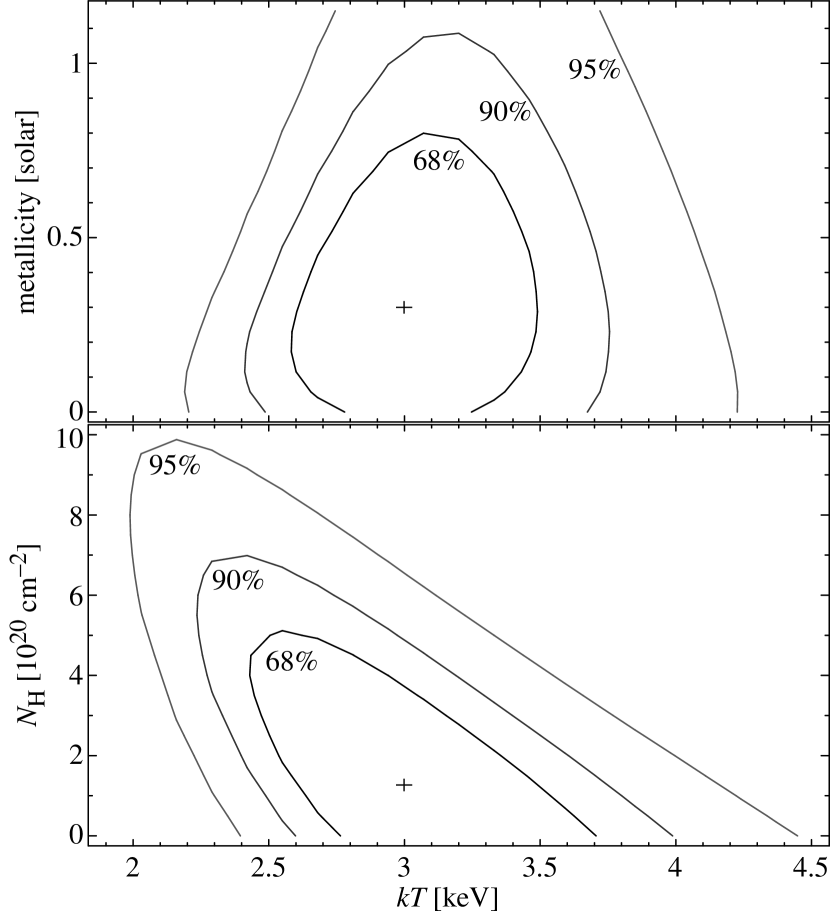
The photoelectric absorption (mainly due to neutral hydrogen in our galaxy) was computed using the cross-sections given by Balucinska-Church & McCammon (1992), available in xspec. Given the low count-rate, the hydrogen column density could not be well constrained by the spectral fit, therefore we fixed it to the galactic value at the cluster position. The interpolation of the HI map of Dickey & Lockman (1990), using the task nh from ftools, yields cm-2. The results are shown in Figure 5. The metallicity is poorly constrained; as shown in Table 3, at a confidence level we found and, at 90% confidence level, . For completeness in Figure 6 we show how and metallicity correlate with kT in the spectral fits.
We restricted the spectral analysis within the energy range where the cluster emission was above the background and the detectors were well calibrated. For the MOS1 and 2 cameras, this interval was [0.3–8.0 keV], for the PN [0.5–8.0 keV] and for ACIS-S3 [0.4–7.0 keV]. The spectra were extracted inside a circle of 1.4 arcmin radius, centered on the cluster. The strong northeast X-ray point source (probably an AGN) is outside this radius.
2.3.4 X-ray luminosity
For the reasons stated above (§2.2), we assume that the cluster redshift is z = 0.5915 and fixed this value from hereon. Table 3 summarizes the best spectral fits, either fixing the metallicity or the hydrogen column density or both. Clearly, the metallicity is not well constrained and we only have upper limits for . Fixing the metallicity to the typical value found in clusters (e.g. Fukazawa et al., 2000, ) and to the galactic value, the mean temperature is keV. This system therefore has an X-ray temperature typical of a poor cluster (such as Abell 194, which has a temperature of keV [Nikogossyan et al. 1999], and the poor cluster RX J0848+4456, which has a temperature of keV [Holden et al., 2001]) and warmer than that of a typical fossil group (e.g. Jones et al., 2003).
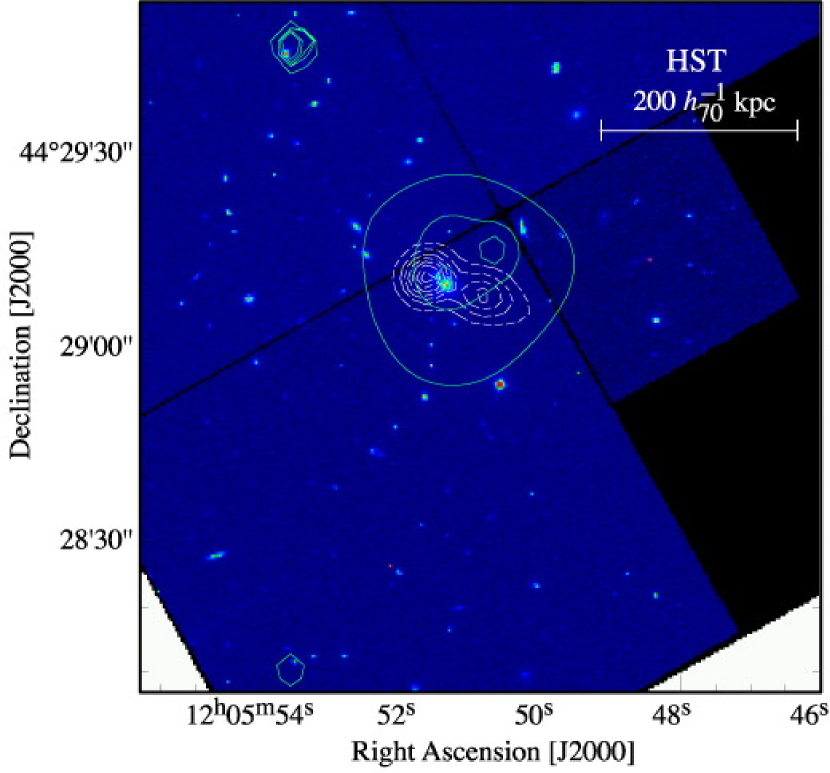
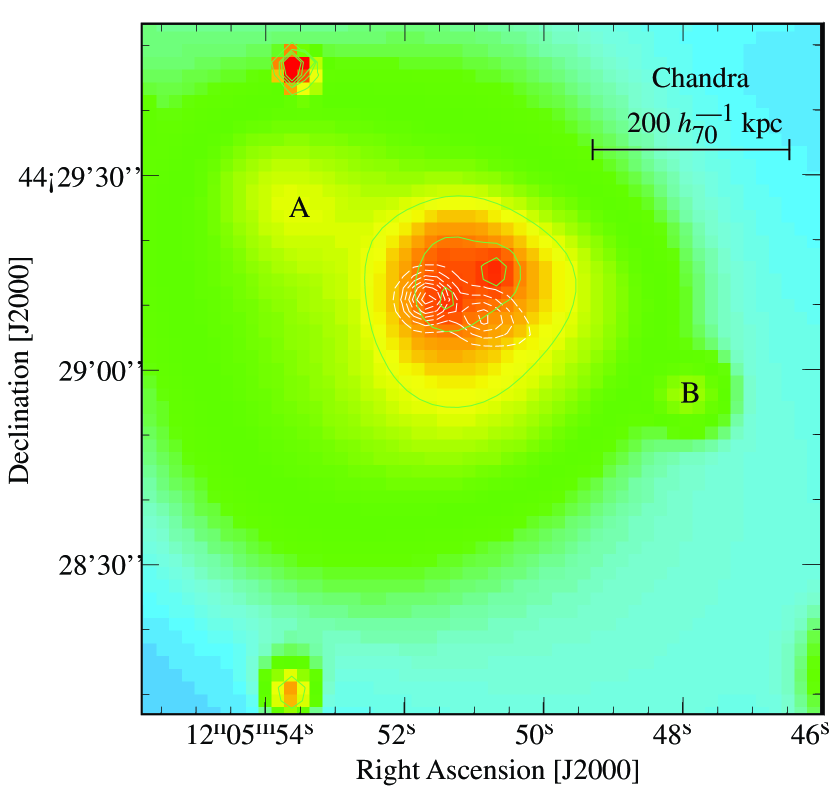
With redshift z = 0.5915, the corresponding unabsorbed luminosity and flux in the [2.0–10.0 keV] are erg s-1 and erg s-1 cm-2. The bolometric luminosity is erg s-1. The cluster properties are summarized in Table 4. We define the position of the cluster to be that of the D galaxy, as there is a peak in the contours (see Figure 3) at this location.
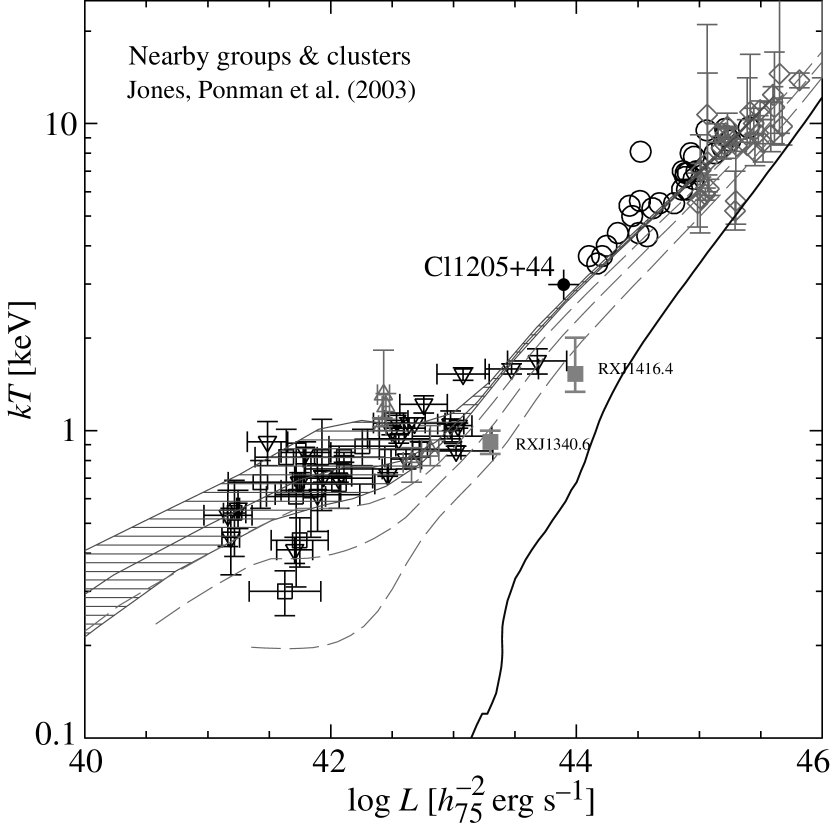
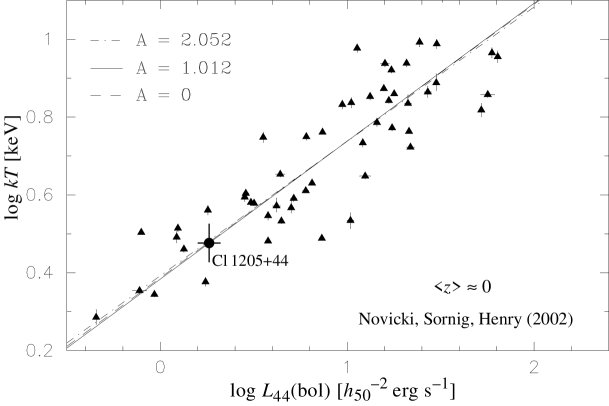
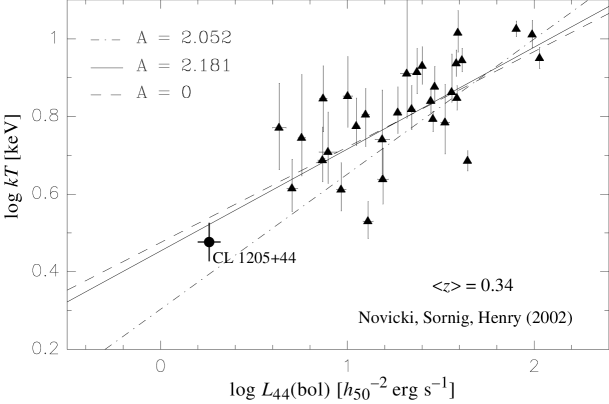
For its measured bolometric luminosity, Cl 1205+44 is hotter than the best fit to the local – relation based on two fossil groups (Jones et al. (2003); see our Figure 7), but agrees with the local relation of Novicki et al. (2002), and the value falls within of the – no-evolution relation derived for the sample of Novicki et al. (2002). For the purpose of later discussion, we have plotted the values of versus for Cl 1205+44 on figures taken from Jones et al. and Novicki et al. in our Figures 7 and 8.
2.3.5 X-ray surface brightness fits
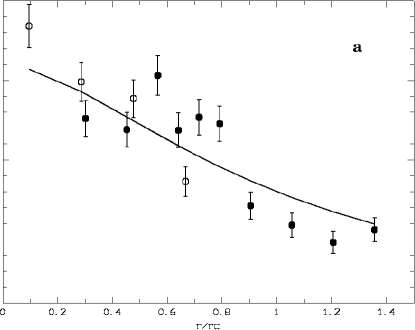
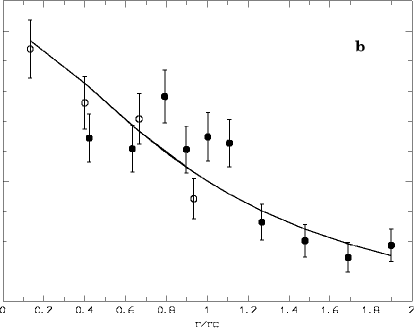
We carried out a standard surface brightness fit to both the XMM-Newton data and the XMM-Newton plus Chandra data combined. We used the 0.5–8 keV bands in both cases. Then with (e.g. Sarazin, 1986), where Ib is the surface brightness as function of projected radius, b and rc is the core radius. For the more robust XMM-Newton data alone case, we found, using a maximum likelihood method: , and r, errors. The fit appears better to the eye (see Figures 9 a and b) for the XMM-Newton plus Chandra case, but we found the results so sensitive to the normalization between the two data sets and the binning of the data, that we only quote this fit as a lower bound to the core radius = 15′′; the value of was again 0.45 for this minimum fit.
2.4 Radio Source
The central peak within the second highest contour level in Figure 3 is located on the D galaxy. The D galaxy is also a double-lobed FIRST (White et al., 1998) radio source F1205+44 (see Figure 10) of total flux = mJy at 20 cm (Condon et al., 2002). These facts are relevant to the model proposed by West (1994). He proposed an anisotropic merger model for the origin of the formation of D galaxies, and the model predicts that the D-galaxy will be associated with a powerful radio source, which is the case here. Furthermore,the model predicts that the radio lobes will be aligned with the major axis of the X-ray emission in the cluster. Therefore, we attempted to determine the major axis of the X-ray emission, which is rather ill defined. In order to make a determination of the major axis, we heavily smoothed777Note that the heavy smoothing causes the center of the second highest contour level in the X-ray emission to be different from that in Figure 3, but the exact position of the X-ray peak is not important. For, it is extremely unlikely that the D galaxy would fall so close to the center of this X-ray emission and not be associated with the X-ray emission. The highest contour level has two peaks, one of which falls on the D galaxy; see the black and white version of Figure 10 or the color image of Figure 11. the data to produce Figure 11 (see also Figure 10). Then, the major axis of the X-ray emission of Cl 1205+44 can be defined by the line joining points “A” and “B” in Figure 11. In this case the radio lobe axis is aligned within 10 degrees of the X-ray axis, which is also consistent with the model of West. However, the optical axis of the D galaxy is offset by about 30 degrees with respect to the radio lobe axis and the West model also predicts alignment with the galaxy distribution. If there is a galaxy distribution that defines a direction, it is the almost north-south line of galaxies running from galaxies #7 to #8 in Figure 4. Overall, then, the data are not consistent with the model of West.
3 Discussion
3.1 Nature of the System
The most compelling reason for calling Cl 1205+44 a fossil group is that the value of m12 within one half the projected virial radius888For consistency with Jones et al. = 70′′ we used their cosmology, H0 = 50, q0= 0.5; then the scale is 7.57 kpc/′′, and from their formula for the virial radius, reproduced in the introduction, rvirial/2 = 0.53 h Mpc, which corresponds to 70′′. is very close to that of the Jones et al. (2003) criterion of being for z (for R- or V-band rest frame), i.e. m12 () = 1.93. In addition, that the value of m12 is slightly smaller can be attributed to Cl 1205+44 being younger (by up to Gyrs) than fossil groups; in the Jones et al. scenario, the central galaxy grows in brightness with time as it accretes more galaxies. In older systems the central galaxy will have had more time to accrete galaxies, and hence be brighter compared to the remaining ones.
The X-ray emitting AGN we have listed in Table 1 is brighter than the D galaxy in the -band, so if it were a cluster member then Cl 1205+44 would certainly not be a fossil group. However, we have (without redshifts) two arguments against this AGN being a group member: (1) its color is significantly bluer than the other (probable) cluster members in Table 1; (2) the AGN becomes the dominant galaxy and then is (X-ray) core radii away from the centroid of the extended X-ray emission.
To be a fossil group, the lower limit Jones et al. (2003) place to LXbol is h ergs s-1, which Cl 1205+44 easily meets. Although Jones et al. do not set an upper limit to the X-ray temperature or luminosity, the LXbol (corrected to H0 = 75 for their Figure 3, and our Figure 7) point falls in the region where the Jones et al. fossil group sample lies. Cl 1205+44 is also distinguished from “normal clusters” in that the LXbol value is about a factor of two lower at kT keV than the cluster sample compiled by Lumb et al. (2004) for clusters at z . In contrast, the LXbol– LR point lies approximately half way between the Jones et al. lines for “normal” X-ray bright groups and fossil groups. On the other hand, the X-ray luminosity and kT values for Cl 1205+44 are similar to the values Holden et al. (2001) assigned to an extended X-ray emitting region they simply classified as a “cluster.” In the end, however, the m12 value of nearly 2 (within one half the projected rvir) and L ergs s-1 meet the primary Jones et al. criteria, which leads us to conclude Cl 1205+44 is fossil group, and we will assume it is a fossil group in what follows.
3.2 Fossil Group Members
We must make an assumption about galaxy membership, since redshifts for the specific galaxies are not available to us, and except for the D galaxy none of those marked in Figure 4 was measured by J. S. Mulchaey (2003, private communication). The conclusion that these galaxies are all group members is based on the following facts: their magnitudes are all similar except for the D galaxy; their colors are all similar except for galaxy #6; their apparent sizes are all similar, and their average color (see also § 3.6) corresponds to the peak in the histogram of the – distribution shown in Figure 12. We will assume therefore, that except for #6, all these galaxies are cluster members. Based on their disk-like morphology, we classified 3 out of the 6 group members as late type (spiral) galaxies and the other three (including the D galaxy) as early type (elliptical) galaxies. We will refer to the galaxy population and colors in our discussion of the scenarios of this fossil group formation in §3.6 and §3.8 below.
3.3 Possible Cooling Evolution
Perhaps the fact that Cl 1205+44 is hotter than the two z = 0 fossil groups with measured temperatures discussed by Jones et al. (2003) is due to cooling between z and z . We now consider this possibility. We used the cooling time equation from Sarazin (1986) for our calculations (see §3.5 for details). To derive a lower bound, we used our =0.45, rc =15′′ model fit and we derived an average cooling time of Gyrs within 1 core radius and Gyrs within 2rc. The time between z = 0.59 and z = 0.2 (the highest redshift in the sample on which Jones et al. base their discussion of fossil group formation and evolution) is only 3 Gyrs. Even the longer time of 4 Gys (the average age of fossil groups in the Jones et al. scenario) is less than the 6.5 Gyrs we derived for the average cooling time within the core. We derive a lower bound of Gyrs at the very core which could lead to cooling in the center of the cluster. It is unlikely, therefore, that the ICM of high redshift fossil groups is hotter than that of low redshift ones due to cooling between z and z . We defer a discussion of the energy input to the ICM until §3.8.1.
The issue of cooling, gas infall (or the suppression of gas infall), resulting heating due to gas infall, etc. is a complicated one and has been discussed extensively in the literature, see for example, some recent works (Clarke et al., 2004; Kaastra et al., 2004; Peterson et al., 2004, and references therein). The purpose of the above discussion was not to argue for or against cooling per se, but rather to determine if it is possible for the gas to have cooled enough between z 0.6 and 0.1 to explain the temperature difference between Cl 1205+44 and nearby fossil groups. We have shown that if we assume the simplest circumstances, i.e. a collisionless gas without a tangled magnetic field, the gas could just barely cool over this z 0.6-0.1 time interval. Then, since heat input is likely in any event, we conclude that the nearby fossil groups do not have lower temperatures than Cl 1205+44 because of cooling. It may just be that hot fossil groups such as Cl 1205+44 are rare per unit volume but are the ones that are easiest to detect at high z.
3.4 The Radio and X-ray Source Relation
The issue is whether or not there is evidence for the radio source interacting with the ICM and producing X-rays via the inverse Compton effect. The radio lobes, as we discussed in §2.4, seem to be aligned with the emission that defines the major axis in the X-ray emission, but there are no radio lobes on either the FIRST (White et al., 1998) image or the NVSS (Condon et al., 2002) image that coincide with the X-ray emission features called “A” and “B” in §2.4. Therefore, this alignment is probably accidental. Regardless of whether we assume the alignment is accidental or not, the contribution of inverse Compton flux from the radio lobes to the 1-10 keV X-ray emission appears negligible as there is no (detectable) X-ray enhancement associated with the radio lobes.
Based on the ratio of the D galaxy to NGC 1550 (at the center of an X-ray bright group; Sun et al. (2003) 20 cm fluxes ( mJy/ mJy, from the VLA NVSS; Condon et al., 2002) and on the measured redshifts, we find that the radio luminosity of the D galaxy in Cl 1205+44 is about 1.4 times that of NGC 1550. The total radio flux ( ergs cm-2 s -1 assuming a flux spectral index of and that the flux extends from 0.1 GHz to 10 GHz) is comparable to the total X-ray flux (and luminosity) of the gas. But if we assume the radio source is only “radio active” (e.g. Lara et al., 2004, and references therein) for 108 years, plus that it probably can inject no more than 10% of its maximum amount of energy output into the ICM, this reduces the total energy input to 1% of the total energy output of the ICM over 1 Gyr.
Furthermore, there is the lack of a correlation between the radio and the X-ray emission. Therefore we have no evidence that the radio source is responsible for extra energy input to the intra cluster medium (ICM) of Cl 1205+44. Regardless, Sun et al. (2003) suggest that cD galaxies can provide heating to the ICM via galactic winds over 10 Gyr.
3.5 Gas Mass and Total Mass
In order to compare with previous work, it is interesting to calculate the gas mass in various ways. Below we give the values based on the assumption of a core radius of 21′′. The values are approximately 40% lower if the other best lower limit of 15′′ is used. Therefore these results are simply for qualitative comparison with previous work.
We used the relationships between X-ray surface brightness and mass as described in Sarazin (1986). We assumed the electron density is 1.1 times the proton density and a mean molecular weight of 0.6 for the gas. Within 100 kpc for the XMM model, we find a gas mass M⨀. Within one core radius the gas mass is M⨀. If we assume no temperature gradient, we derive a dynamical mass (e.g., Sarazin, 1986) of M⨀. If we use the Sun et al. (2003) value of M/L of 5 and our value of LR, we find the total galaxy mass of Cl 1205+44 is M⨀ which is over 10 times higher than their value of about M⨀ for the group (not classified as a fossil group, however) surrounding NGC 1550. Within 100 kpc, their value of the gas mass (Mgas) of about M⨀ is about 2 times lower than our value for Cl 1205+44. We also calculated M2500 from Allen et al. (2001) (see also Sun et al., 2003) who derived a formula for M2500 using a set of X-ray luminous relaxed clusters. Then, M M M⨀. ; for as assumed here, this can be simplified to
3.6 Galaxy Colors
To compare with other galaxies at this redshift we have used the Sloan Digital Sky Survey (SDSS)999http://www.sdss.org/dr2/ and the 2MASS catalog. For galaxies bright enough to have spectra measured with the SDSS, we find that the colors of those galaxies at z between 0.5 and 0.6 are typical of those in Table 1 assumed to be members of CL 1205+44.
The six galaxies for which we have colors that we associate with Cl 1205+44 are all relatively red, even the late-type galaxies. In contrast, Butcher & Oemler (1984) found a high fraction of blue galaxies at this redshift compared to low redshifts. The Butcher-Oemler effect can be explained by assuming that at 0.6 compared to 0, there is a higher fraction of galaxies that have just fallen into the cluster and have not had their gas stripped yet (e.g. Kauffmann, 1995). Hence, the newer (at least spiral) cluster members tend to be bluer, the higher the redshift. For Cl 1205+44, the fossil group could have formed at z of about 2, could have aged about 4 Gyrs, and could have had no galaxy infall since birth. The only galaxy population evolution that has taken place has been the merging of galaxies into the central D galaxy plus ram pressure stripping of the gas from the galaxies. Then, there are no recent infall spirals and the spirals have the same colors as the elliptical (under the assumption that all but galaxy #6 and the AGN in Table 1 are cluster members; for, as noted in §3.1 it would be peculiar to have the brightest cluster galaxy so far removed from the cluster center). In this hypothesis, the spirals have had their gas removed via ram pressure stripping, and they have been cluster members since its formation approximately 4 Gyrs ago. The key issue is what suppresses galaxy infall for fossil groups compared to typical groups and clusters.
Fossil groups have probably formed in initially above average over dense regions (so that the group collapsed early), which, however, were not sufficiently rich in matter and galaxies to sustain growth of the group beyond some point in time. The property of having relatively a low total matter value and a negligible blue galaxy fraction is directly related to arriving at an over density sufficient for collapse earlier than more massive systems. For example, simulations by Gao et al. (2004) have shown that the galaxy infall rate and number of galaxies in a cluster is related to the age of the universe when the cluster formed; clusters that formed earlier in these simulations tend to have fewer galaxies and less continuous infall (to produce the BO effect) than the systems that formed later. These simulations predict, then, that the galaxy to total cluster mass ratio should be lower for the earliest formed clusters compared to later ones. With a sample of one fossil group with red galaxies, however, it is premature to make a comparison between the data and the simulations at this level.
3.7 The D Galaxy
The D galaxy of our system is similar to the z = 0.25–0.5 simulated galaxies in West (1994). Our value of the magnitude of 19.27 converts into a rest frame absolute RJ magnitude of (luminosity distance Mpc, where we used 0.7 for the K correction for an elliptical at z = 0.59). This value of is about 0.5 magnitudes brighter than the brightest cluster galaxy magnitudes compiled by Collins et al. (2003). Recent galaxy mergers may be responsible for this relatively high brightness.
Note that ongoing minor mergers still appear to be visible on the HST image (see Figure 13). These ongoing mergers at a relatively early stage of this fossil group history do not favor the fossil group formation scenario of Mulchaey & Zabludoff (1999), who proposed a formation of these systems with an unusual initial luminosity function. An alternative proposal is the evolutionary scenario of fossil groups proposed by Borne et al. (2000) and Jones et al. (2003). This links compact groups of galaxies and giant elliptical galaxies via an ultra-luminous infrared galaxy (ULIRG) phase. The D galaxy of our system (which is also a radio source) has an - color very similar to that of ULIRGs (from NED101010http://nedwww.ipac.caltech.edu/) in the 2MASS survey. This D galaxy could be an ULIRG that is just turning on, except that the -band flux falls well below other ULIRGs (e.g. Yun et al., 2004). Therefore if the D galaxy were formed in the process suggested by West (1994), then the ULIRG phase has probably already passed.
Continuing with the idea of D galaxy evolution in galaxy groups, we refer to Collins et al. (2003). They show that in poor groups the variance between central galaxy properties from group to group is quite large (factors of 10 or more) in terms of total optical output. Thus, we expect there would be a variation in the optical properties of the D galaxies in fossil groups such as Cl 1205+44, unless there is a direct correlation between the kT value and the D galaxy stellar content. Only a high redshift () survey of fossil groups will be able to shed light on the variance of initial conditions and a survey in general is needed to shed light on the relationship between kT and the D galaxy.
3.8 Scenarios
To summarize a formation scenario for Cl 1205+44: There was an initial potential well of dark matter. Energy injection occurred via some process or processes such as perhaps supernovae, radio galaxies, or ULIRGs. This process heated the gas as galaxies fell into the potential well at a redshift of about 2. The galaxies passed through the ICM several times and the gas and dust were swept out of the spirals. This ram pressure stripping suppressed continuous star formation and left the spirals to become as red as the ellipticals. The system formed in a relative void of galaxies so that there was no continuous infall of galaxies to keep the system fed with blue spiral field galaxies. The central galaxy grew to become a relatively large D galaxy by merging with other galaxies to form a m12 value . The entire evolutionary sequence took about 4 Gyrs.
The above fits with the Jones et al. (2000, 2003) scenario, which assumes that the time it takes for the merging of galaxies to form a bright central galaxy is approximately 4 Gyrs and no continuous field galaxy infall has taken place. The fact that the D galaxy in Cl 1205+44 appears to have nearly completed the merging process and is approximately 4 Gyrs younger than z fossil groups, implies that (at least some) fossil groups at z = 0 are much older than 4 Gyrs.
3.8.1 Consequences
Energy to heat the ICM above and beyond gravitational infall results in an entropy (defined here as the pseudo entropy kTn; where ne is the number of electrons per cm-3 and kT is in keV) floor. The initial energy injection and its consequences were discussed in detail by Babul et al. (2002). Babul et al. made predictions of initial energy input which they compared with the data. The two fossil groups found by Jones et al. (2003) with strong enough signal to measure a temperature were consistent with an entropy floor of 100 keV cm2. In contrast, Cl 1205+44 lies a factor of two or more above the 100 keV cm2 line and instead is nearly on the line occupied by normal rich clusters and normal groups (initial energy input 427 keV cm2; see Figure 7). This implies that either Cl 1205+44 is really not a fossil group, contrary to our classification, or that it is unlike the nearby fossil groups, and that we were able to detect Cl 1205+44 precisely because it is much more luminous than low z fossil groups. This could be due to the result of a relatively high (compared to the average fossil group) entropy floor input in the ICM, or indicate that Cl 1205+44 simply is more massive that other fossil groups.
Opposed to the model of Babul et al. (2002), we find a much lower value for the pseudo entropy = Tn keV cm2 of 85 keV cm2. We derived this value at r = 0.1r200 = 0.1rvirial from our fit (rc = 21′′), where we estimate an average kT = 3 keVand an electron density at the core to be cm-3, i.e. cm-3 at 0.1rvirial. This implies some refinement to the Babul et al. model such as continuous rather than impulsive heating (pre-heating) at formation. Note that our entropy for a 3 keV (the temperature of the ICM of Cl 1205+44) temperature is lower than was found for 3 keV virialized objects (including clusters and groups) at z , by Ponman et al. (2003).
The fact that the entropy we find is lower than that found for more nearby clusters and groups at the same temperature is consistent with the “negative” entropy evolution suggested by Maughan et al. (2004). Maughan et al. proposed a form E based on self-similar scaling and on the evolution of the critical density of the Universe with z. The scaled-by-temperature (i.e. divided by kT) entropies for similar temperature objects found by Ponman et al. (2003) at the same radius (0.1rvir) have values of about 75 cm2, which if scaled from z = 0 to z = 0.5915 by E correspond to 49 cm2, which is within a factor of two of the value for Cl 1205+44 = 28 cm2 at 0.1rvir. These results then appear to be more consistent with continuous rather than impulsive initial heating to the ICM.
If there were some initial energy injection at z = 2 (whatever its cause), then this injection could affect the high order portion of the CMB via the SZ effect from clusters and groups of galaxies. The possibility of this energy input and its effect on SZ measurements has been discussed by Lin et al. (2004) in the context of deriving cosmological parameters based on the power spectrum of the CMB. Their impulsive heating model requires energy injection at z = 2. They fit their models to the LX-TX normal cluster and group data that are shown here in Figure 7, and from this we see that Cl 1205+44 is consistent with the Lin et al. model (see also Borgani et al., 2004). The fact that preheating occurred in the Lin et al. model near z is consistent with our suggestion that at least some fossil groups, such as Cl 1205+44, formed at z . However, if continuous heating models can also be shown to fit the data, then the amount of initial impulsive heating suggested by Lin et al. will not be as large as they suggested, and the impact on the high order CMB observations will be less.
4 Summary and Conclusions
We have found, via a ROSAT survey of archival data, a group of galaxies with a relatively red population. HYPERZ calculations based on the - and -band data suggested the system might have z . Subsequent redshift work found that the redshift is = 0.5915, and Chandra plus XMM-Newton observations confirmed the existence of X-ray emitting gas in the group. We classify this group as a fossil group based on its m12 in and on the fact that its X-ray luminosity exceeds ergs s-1. This makes it by far the highest redshift fossil group yet reported. The temperature for the ICM is abnormally high compared to two fossil groups with a similar LXbol, and the LXbol–LR point lies approximately half way between the best fit lines for normal and fossil groups Jones et al. (2003); Cl 1205+44 has a kT–LXbol value comparable to another z system that was classified as a cluster (RX J0848+4456; Holden et al., 2001). But, although there are some similarities with normal groups and clusters, we have classified it as a fossil group based on the primary criteria of m12 in R- or V-band rest frame and an X-ray luminosity
Our main conclusion is that Cl 1205+44 is a fossil group. A formation scenario is that the group formed in a peak density region of relatively low total mass at z . The formation regions did not have enough matter to sustain continuous infall of galaxies and gas, and such a scenario is consistent with the simulation carried out by Gao et al. (2004). Beyond the formation of a central dominant galaxy via accretion, fossil groups appear old, i.e., fossil-like precisely because they have had little or no evolution in terms of galaxy infall since their inception. And, some fossil groups could be considerably older than 4 Gyrs. No evolution of the galaxy population (at least in the case of Cl 1205+44) is implied because of the dearth of blue spirals, the kT-LXbol value point on the no-evolution tracks for rich clusters of galaxies (Novicki et al., 2002), and our cooling calculations of the IGM are consistent with (but cannot exclude) no significant cooling of CL 1205+44 in 3 Gyrs.
Some preheating of the gas in groups and clusters via supernovae or an active galaxy phase is likely to have occurred even in fossil groups (or normal groups) as evidenced by the relatively high temperature of CL 1205+44, but it also appears likely that there is continuous rather than impulsive heating at group formation, which results in “negative” evolution of the pseudo entropy (e.g. Maughan et al., 2004). However, as the kT versus LXbol of Cl 1205+44, fits within the no-evolution with z of Novicki et al. (2002), the negative evolution for entropy and the no-evolution models for kT versus LXbol (and galaxy population) may need to be fine tuned to be made consistent with each other.
Also, the amount of preheating has implications for the interpretation of high order measurements of the CMB. Our data are consistent with “negative” evolution of the pseudo entropy which implies, on one hand, a lesser impact of the SZ effect from high z clusters than suggested by Lin et al. (2004). On the other hand, that the kT versus LXbol value for our data and many other clusters is consistent with no evolution, suggests that perhaps a significant faction of ICM heating did take place near z =2, and hence does have a significant effect on the high order terms of the CMB.
The discovery and X-ray and optical measurements of still more z clusters and fossil groups are needed to develop enough statics to address the issues of evolution, preheating, and the relationship of fossil group (and cluster) formation to their total mass and galaxy colors.
References
- Adami et al. (2000) Adami, C., Ulmer, M. P., Romer, A. K., Nichol, R. C., Holden, B. P., & Pildis, R. A. 2000, ApJS, 131, 391
- Allen et al. (2001) Allen, S. W., Schmidt, R. W., & Fabian, A. C. 2001, MNRAS, 328, L37
- Babul et al. (2002) Babul, A., Balogh, M. L., Lewis, G. F., & Poole, G. B. 2002, MNRAS, 330, 329
- Balucinska-Church & McCammon (1992) Balucinska-Church, M., & McCammon, D. 1992, ApJ, 400, 699
- Bertin & Arnouts (1996) Bertin, E., & Arnouts, S. 1996, A&AS, 117, 393
- Borgani et al. (2004) Borgani, S., Murante, G., Springel, V., Diaferio, A., Dolag, K., Moscardini, L., Tormen, G., Tornatore, L., & Tozzi, P. 2004, MNRAS, 348, 1078
- Borne et al. (2000) Borne, K. D., Bushouse, H., Lucas, R. A., & Colina, L. 2000, ApJ, 529, 77
- Butcher & Oemler (1984) Butcher, H., & Oemler, A. 1984, ApJ, 285, 426
- Carilli et al. (1994) Carilli, C. L., Perley, R. A., & Harris, D. E. 1994, MNRAS, 270, 173
- Clarke et al. (2004) Clarke, T. E., Blanton, E. L., & Sarazin, C. L. 2004, ApJ, 616, 178
- Collins et al. (2003) Collins, C., Brough, S., Burke, D., Mann, R., & Lynam, P. 2003, Ap&SS, 285, 51
- Condon et al. (2002) Condon, J. J., Cotton, W. D., Greisen, E. W., Yin, Q. F., Perley, R. A., Taylor, G. B., & Broderick, J. J. 2002, VizieR Online Data Catalog, 8065, 0
- Dickey & Lockman (1990) Dickey, J. M., & Lockman, F. J. 1990, ARA&A, 28, 215
- Fruchter & Hook (2002) Fruchter, A. S., & Hook, R. N. 2002, PASP, 114, 144
- Fukazawa et al. (2000) Fukazawa, Y., Makishima, K., Tamura, T., Nakazawa, K., Ezawa, H., Ikebe, Y., Kikuchi, K., & Ohashi, T. 2000, MNRAS, 313, 21
- Gao et al. (2004) Gao, L., White, S. D. M., Jenkins, A., Stoehr, F., & Springel, V. 2004, MNRAS, 255, 819
- Harris et al. (2000) Harris, D. E., Nulsen, P. E. J., Ponman, T. J., Bautz, M., Cameron, R. A., David, L. P., Donnelly, R. H., Forman, W. R., Grego, L., Hardcastle, M. J., Henry, J. P., Jones, C., Leahy, J. P., Markevitch, M., Martel, A. R., McNamara, B. R., Mazzotta, P., Tucker, W., Virani, S. N., & Vrtilek, J. 2000, ApJ, 530, L81
- Holden et al. (2001) Holden, B. P., Stanford, S. A., Rosati, P., Squires, G., Tozzi, P., Fosbury, R. A. E., Papovich, C., Eisenhardt, P., Elston, R., & Spinrad, H. 2001, AJ, 122, 629
- Jones et al. (2000) Jones, L. R., Ponman, T. J., & Forbes, D. A. 2000, MNRAS, 312, 139
- Jones et al. (2003) Jones, L. R., Ponman, T. J., Horton, A., Babul, A., Ebeling, H., & Burke, D. J. 2003, MNRAS, 343, 627
- Kaastra & Mewe (1993) Kaastra, J. S., & Mewe, R. 1993, A&AS, 97, 443
- Kaastra et al. (2004) Kaastra, J. S., Tamura, T., Peterson, J. R., Bleeker, J. A. M., Ferrigno, C., Kahn, S. M., Paerels, F. B. S., Piffaretti, R., Branduardi-Raymont, G., & Böhringer, H. 2004, A&A, 413, 415
- Kauffmann (1995) Kauffmann, G. 1995, MNRAS, 274, 153
- Lara et al. (2004) Lara, L., Giovannini, G., Cotton, W. D., Feretti, L., Marcaide, J. M., Márquez, I., & Venturi, T. 2004, A&A, 421, 899
- Liedahl et al. (1995) Liedahl, D. A., Osterheld, A. L., & Goldstein, W. H. 1995, ApJ, 438, L115
- Lin et al. (2004) Lin, K., Woo, T., Tseng, Y., Lin, L., & Chiueh, T. 2004, ApJ, 608, L1
- Lumb et al. (2004) Lumb, D. H., Bartlett, J. G., Romer, A. K., Blanchard, A., Burke, D. J., Collins, C. A., Nichol, R. C., Giard, M., Marty, P. B., Nevalainen, J., Sadat, R., & Vauclair, S. C. 2004, A&A, 420, 853
- Lumb et al. (2002) Lumb, D. H., Warwick, R. S., Page, M., & De Luca, A. 2002, A&A, 389, 93
- Maughan et al. (2004) Maughan, B. J., Jones, L. R., Ebeling, H., & Scharf, C. 2004, MNRAS, 351, 1193
- McNamara et al. (2000) McNamara, B. R., Wise, M., Nulsen, P. E. J., David, L. P., Sarazin, C. L., Bautz, M., Markevitch, M., Vikhlinin, A., Forman, W. R., Jones, C., & Harris, D. E. 2000, ApJ, 534, L135
- Mulchaey et al. (2003) Mulchaey, J. S., Davis, D. S., Mushotzky, R. F., & Burstein, D. 2003, ApJS, 145, 39
- Mulchaey & Zabludoff (1999) Mulchaey, J. S., & Zabludoff, A. I. 1999, ApJ, 514, 133
- Nikogossyan et al. (1999) Nikogossyan, E., Durret, F., Gerbal, D., & Magnard, F. 1999, A&A, 349, 97
- Novicki et al. (2002) Novicki, M. C., Sornig, M., & Henry, J. P. 2002, AJ, 124, 2413
- Peterson et al. (2004) Peterson, J. R., Kahn, S. M., Paerels, F. B. S., Kaastra, J. S., Tamura, T., Bleeker, J. A. M., Ferrigno, C., & Jernigan, J. G. 2004, in The Riddle of Cooling Flows in Galaxies and Clusters of galaxies
- Ponman et al. (2003) Ponman, T. J., Sanderson, A. J. R., & Finoguenov, A. 2003, MNRAS, 343, 331
- Romer et al. (2001) Romer, A. K., Viana, P. T. P., Liddle, A. R., & Mann, R. G. 2001, ApJ, 547, 594
- Sarazin (1986) Sarazin, C. L. 1986, Reviews of Modern Physics, 58, 1
- Sun et al. (2003) Sun, M., Forman, W., Vikhlinin, A., Hornstrup, A., Jones, C., & Murray, S. S. 2003, ApJ, 598, 250
- West (1994) West, M. J. 1994, MNRAS, 268, 79
- White et al. (1998) White, R. L., Becker, R. H., Helfand, D. J., & Gregg, M. D. 1998, VizieR Online Data Catalog, 8051, 0
- Yun et al. (2004) Yun, M. S., Reddy, N. A., Scoville, N. Z., Frayer, D. T., Robson, E. I., & Tilanus, R. P. J. 2004, ApJ, 601, 723

| ID(Class)a | Ra | Dec | F702w | i′ | |
|---|---|---|---|---|---|
| 1(AGN)b | 181.474 | 44.4960 | 19.27 | 18.23 | 16.30 |
| 2(S) | 181.472 | 44.4938 | 21.04 | 20.80 | 17.54 |
| 3(E) | 181.466 | 44.4923 | 21.38 | 21.19 | 18.05 |
| 4(S) | 181.470 | 44.4885 | 20.73 | 20.43 | 17.29 |
| 5(S) | 181.460 | 44.4885 | 21.84 | 20.65 | 17.63 |
| 6(S)c | 181.469 | 44.4873 | 21.01 | 20.99 | 18.57 |
| 7(D) | 181.464 | 44.4860 | 19.27 | 18.50 | 15.44 |
| 8(E) | 181.465 | 44.4812 | 21.22 | 20.85 | 17.85 |
| MOS1 | MOS2 | PN | ACIS | |
|---|---|---|---|---|
| Totala | 180 | 153 | 458 | 465 |
| Cluster | 147 | 117 | 381 | 295 |
| d.o.f. | |||
|---|---|---|---|
| [keV] | [] | [cm-2] | |
| 48.02/46 | |||
| 48.03/47 | |||
| 48.02/47 | |||
| 48.03/48 |
| z | Alphaa | Deltaa | X-ray | (F702W) | ||
|---|---|---|---|---|---|---|
| deg | deg | diameter | erg s-1 | keV | ( | |
| 0.59 | 181.4641 | 44.4860 | 40′′ | 9.20.7 | 3.00.3 | 1.5 |