Probing the Ionizing Continuum of Narrow-Line Seyfert 1 Galaxies. I. Observational Results
Abstract
We present optical spectra and emission-line ratios of 12 Narrow-Line Seyfert 1 (NLS1) galaxies that we observed to study the ionizing EUV continuum. A common feature in the EUV continuum of active galactic nuclei is the big blue bump (BBB), generally associated with thermal accretion disk emission. While Galactic absorption prevents direct access to the EUV range, it can be mapped by measuring the strength of a variety of forbidden optical emission lines that respond to different EUV continuum regions. We find that narrow emission-line ratios involving [O ii] , H, [O iii] , [O i] , H, [N ii] , and [S ii] indicate no significant difference between NLS1s and Broad-line Seyfert 1 (BLS1) galaxies, which suggests that the spectral energy distributions of their ionizing EUV – soft X-ray continua are similar. The relative strength of important forbidden high ionization lines like [Ne v] compared to He ii and the relative strength of [Fe x] appear to show the same range as in BLS1 galaxies. However, a trend of weaker F([O i] )/F(H) emission-line ratios is indicated for NLS1s compared to BLS1s. To recover the broad emission-line profiles we used Gaussian components. This approach indicates that the broad H profile can be well described with a broad component ( km s-1) and an intermediate broad component ( km s-1). The width of the broad component is in the typical range of normal BLS1s. The emission-line flux that is associated with the broad component in these NLS1s amounts to at least 60% of the total flux. Thus it dominates the total line flux, similar to BLS1 galaxies.
1 Introduction
It is generally supposed that a characteristic feature of active galactic nuclei (AGN), relating the X-ray and optical/UV regime, is the big blue bump (hereafter BBB) (e.g., Elvis et al. 1986; Mathews & Ferland 1987; for a review see Collin 2001), which may be associated with thermal accretion disk emission (Rees 1984; Laor & Netzer 1989; Band & Malkan 1989; Sun & Malkan 1989; Laor et al. 1997). The presence of the BBB, which is located in the EUV range, is indicated by upturns in the far-UV and soft X-rays. The strength and location of the BBB likely depend on the black hole mass, the luminosity, and the accretion rate (e.g., Binette et al. 1988,1989; Ross & Fabian 1993; Wandel 1999a,b). However, because a direct observation of the EUV range is extremely difficult due to Galactic absorption, it is still an open question as to whether the BBB is as prominent as it is generally assumed or whether it is a shallower feature (Laor et al. 1997). The strength of a variety of emission lines in the optical domain and their emission-line flux ratios that are sensitive to different parts of the ionizing continuum in the EUV can be used as tracers of the continuum shape and strength (Krolik & Kallman 1988; Binette et al. 1989; Netzer et al. 1992; Zheng, Kriss & Davidsen 1995; Korista, Ferland, & Baldwin 1997; Alexander et al. 1999; Kraemer & Crenshaw 2000; Dietrich et al. 2002).
Narrow-Line Seyfert 1 galaxies (NLS1s) may hold key information about the structure and evolution of AGN. Although the permitted emission-line profiles in NLS1 spectra are unusually narrow (FWHM km s-1), like in Seyfert 2 galaxies, strong optical and ultraviolet Fe ii emission, distinct X-ray continuum properties, and rapid, large amplitude X-ray variations unmask them as type 1 Seyfert galaxies (Osterbrock & Pogge 1985; Goodrich 1989; Boller et al. 1997; Mathur 2000; Pogge 2000). Most of the observed properties of NLS1s can be explained in the framework of a low-mass black hole (few times ) and a high accretion rate that is close to the Eddington limit (e.g., Pounds, Done, & Osborne 1996). This may explain the soft X-ray excess emission and rapid X-ray flux variations (e.g., Boller et al. 1996; Grupe et al. 1995; Grupe et al. 2000; Leighly 1999a).
NLS1 galaxies are prime candidates to investigate the strength and shape of the soft X-ray – EUV continuum, since they show generally a strong soft X-ray excess (Boller et al. 1996; Leighly 2000) and also steeper hard X-ray continua than normal Seyfert 1 galaxies (Brandt et al. 1997; Leighly 1999b). Recently, Wang & Netzer (2003) suggested that the soft X-ray properties of NLS1s are natural consequences of their super-Eddington accretion rates. However, only a few NLS1 galaxies (TON S180, Turner et al. 2002; RE 103439, Casebeer & Leighly 2003), have been successfully observed in the EUV, revealing evidence for a BBB (although its strength is uncertain due to uncertainties in the correction for Galactic extinction).
It has been suggested that broad-line Seyfert 1 (BLS1) galaxies show a small or no BBB (Laor et al. 1997; Zheng et al. 1997; Telfer et al. 2002). There are observational indications that the NLR of Seyfert 2, Seyfert 1, and NLS1 galaxies might be different (e.g., Schmitt & Kinney 1996; Schmitt 1998), possibly caused by differences in the ionizing continuum SED. However, to probe different EUV – soft X-ray continua it is necessary to study emission lines that cover a wide range in ionization energies, at least up to eV (e.g., Alexander et al. 1999; Kraemer & Crenshaw 2000). Studies using emission lines like [O i], [O ii], [O iii] reveal that different ionizing continua for NLS1 and normal BLS1 galaxies have only a minor impact on these emission-line ratios (Nagao et al. 2001). Thus, probing the ionizing continuum of NLS1s in the EUV employing emission lines that are sensitive to a wide energy range will provide information on the presence of a BBB and whether the BBB is stronger and shifted to higher energies compared to BLS1s, similar to the strong soft state of galactic black holes at high accretion rates (Pounds, Done, & Osborne 1996; Brocksopp et al. 1999; Zdziarski et al. 2002).
2 Observations
We have observed a sample of 12 bright nearby NLS1 galaxies using the 1.5-m telescope at Cerro Tololo Inter-American Observatory (Table 1). The observations have been obtained as part of the Small and Moderate Aperture Research Telescope System (SMARTS) collaboration. The NLS1 sample is restricted to bright AGN with to record spectra with a signal-to-noise ratio of at least to 40 in the continuum within a reasonable observing time. We observed the NLS1 galaxies using the R-C spectrograph in longslit mode on April 23 to April 27, 2003. The observations were performed under non-photometric conditions except for the last night when the spectra were taken under photometric conditions with subarcsec seeing (). For the first four nights the seeing varied between and , with on average which had no effect due to the large slit width.
A Loral 1k CCD detector with pixels (pixel size ) was used together with grating 26 (blue, 600 l/mm), grating 35 (red, 600 l/mm) together with blocking filter GG 495, and grating 36 (blue, 1200 l/mm) to observe spectra with higher spectral resolution in the H – [O iii] range. In addition, these spectra of higher spectral resolution were valuable to intercalibrate the spectra observed for the blue and red optical wavelength range. We used different settings for the blue grating to ensure that the redshifted [Ne v] emission line was measured for each of the NLS1s in our sample and also different settings for the red grating to record the H[N ii] emission line complex and the [S ii] emission lines. Together with the spectra of high spectral resolution for the H – [O iii] region we covered the entire optical wavelength range Å. The slit orientation was east-west and the slit width was set to for accurate absolute flux calibration and to mitigate the effect of atmospheric refraction. Due to the design of the 1.5-m R-C spectrograph the spectral resolution is nearly unchanged for slit widths in the range of to . In addition to the wide slit width the NLS1 galaxies were observed within less than two hours of the meridian to minimize the light loss caused by differential refraction.
The total exposure times for the NLS1 galaxies range from 30 to 60 minutes using the blue and red grating, split into two exposures. For the high spectral resolution data two spectra with 20 minutes exposure time each were observed. The standard stars EG 274, LTT 3218, LTT 4816, and LTT 7987 (Hamuy et al. 1992) were observed for relative flux calibration each night, with exposure times of 5 to 15 minutes in the blue and red wavelength range and 15 to 20 minutes for the spectra with higher spectral resolution.
3 Narrow-Line Seyfert 1 Spectra
3.1 Data Analysis
The NLS1 galaxy and standard star spectra were processed using standard MIDAS111Munich Image Data Analysis System, trade-mark of the European Southern Observatory software. The night sky component of the 2 D-spectra was subtracted by fitting third order Legendre polynomials perpendicular to the dispersion, along each spatial row of the spectra using areas on both sides of the object spectrum which were not contaminated by the NLS1 galaxies or other objects. To extract 1 D spectra we adjusted the extension of the spatial extraction windows to match the seeing recorded during the observation. We applied spatial extraction windows of sizes with to which includes a significant fraction of the host galaxy spectra. Helium-argon wavelength calibration spectra were taken at the beginning and the end of each observing night. The achieved spectral resolution amounts to 4.8 Å for both the blue and red wavelength range ( km s-1), with an internal error of the wavelength calibration of Å. The spectra taken with grating 36 have a spectral resolution of 2.6 Å ( km s-1). The same spectral resolution for the employed gratings was derived examining strong night sky emission lines ([O i] , [O i] , and [O i] ). These night sky emission lines indicate an absolute uncertainty of the wavelength calibration of Å ( km s-1).
We corrected each NLS1 spectrum for the atmospheric c-band and b-band absorption, caused by molecules using the standard star spectra that were observed during each night. The spectra were corrected for atmospheric extinction applying the standard curve of La Silla (Schwarz & Melnick 1993) and for Galactic extinction using the values of Dickey & Lockman (1990) and the Galactic extinction curve of Savage & Mathis (1979). The sensitivity functions for the blue, red, and higher resolution spectra, based on individual standard stars, differ by less than % from the mean sensitivity functions for the corresponding nights which we used to calibrate the NLS1 spectra.
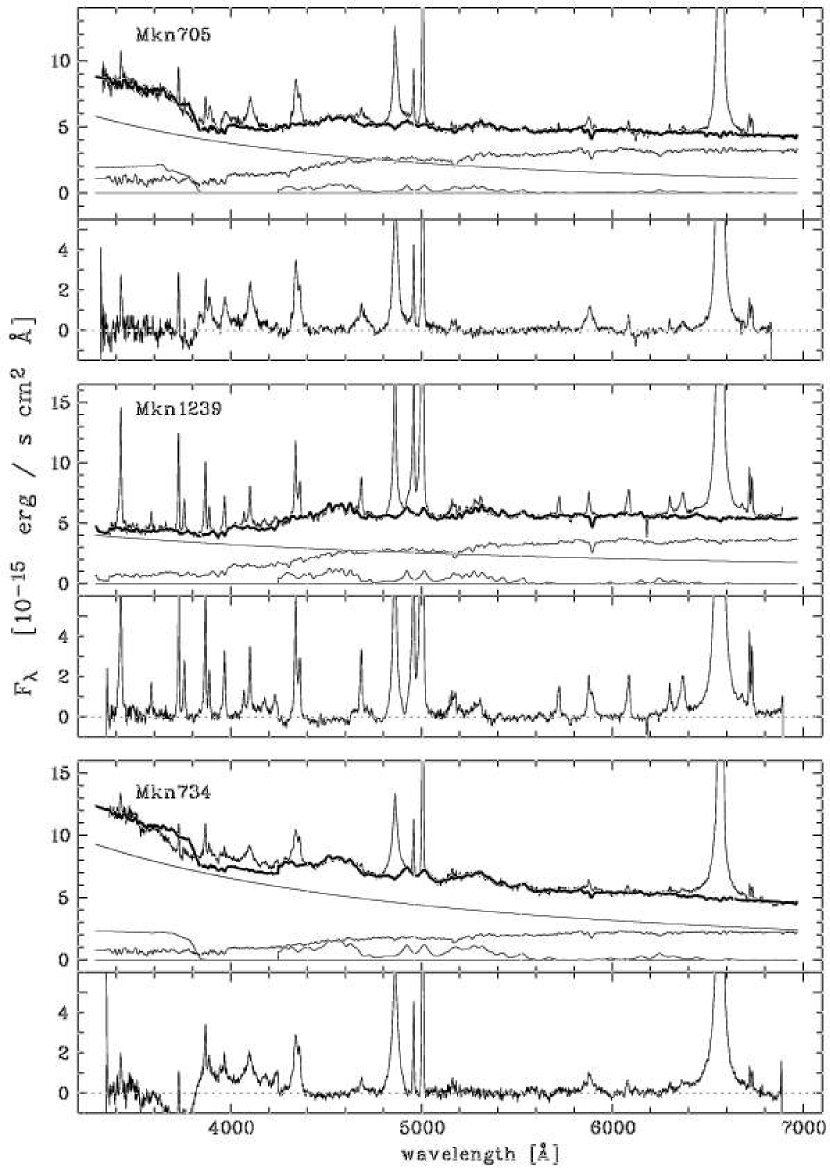
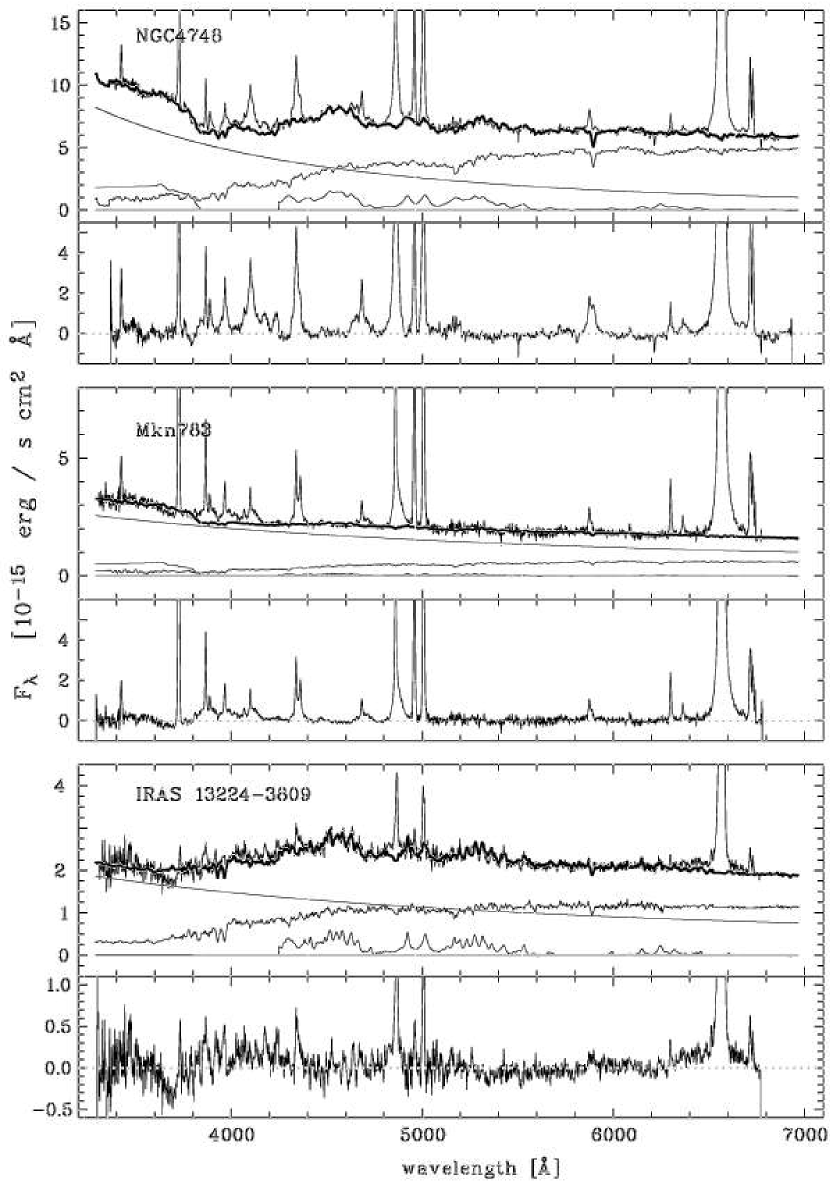
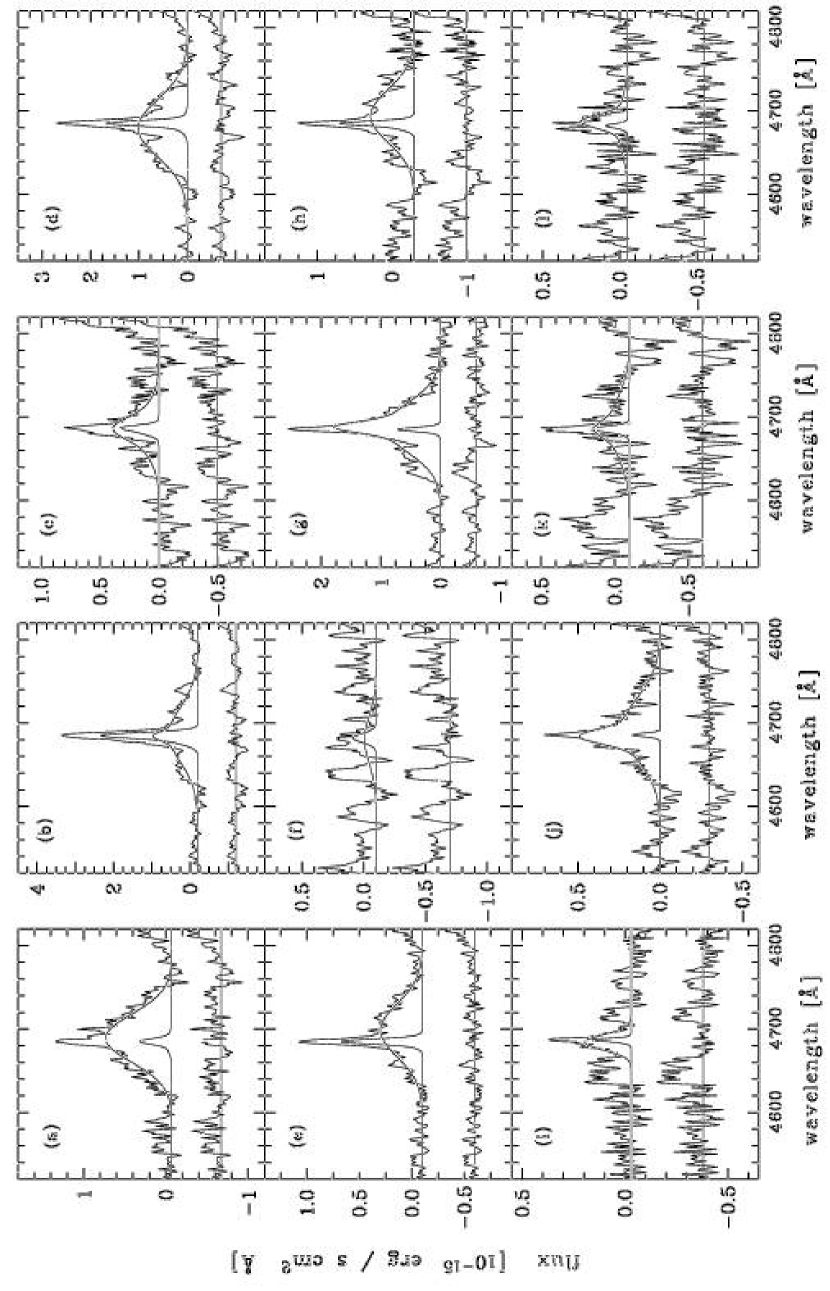
The flux-calibrated NLS1 spectra have been transformed to the rest frame using the corresponding redshift given in Table 1. We derived the redshift for each object by examining the emission-line profile of the strong [O iii] emission lines. A Gaussian profile was fit to the upper part of the line profile with at least 50 % of the peak intensity. The rest-frame flux-calibrated spectra of the observed NLS1 galaxies are shown in Figure 1.
3.2 Multi-Component Fit Approach
In contrast to luminous quasars, the host galaxy contribution in the optical, for less luminous Seyfert galaxies can be of the order of % in the large aperture that we used. Hence, to measure emission line fluxes it is important to correct for possible contamination, particularly to recover weaker emission lines. Almost all NLS1 galaxy spectra of our sample show significant host galaxy contributions to the observed continuum level as indicated by the presence of prominent stellar absorption features like CaII H and CaII K, the Mgb band, and the NaD absorption in the red wing of the He i emission line. Furthermore, the studied NLS1s show strong optical Fe ii emission features, Fe ii and Fe ii, blueward and redward of the H – [O iii] complex (Fig. 1). Therefore, we analyzed each NLS1 spectrum employing a multi-component fit based on (i) a power law continuum, (ii) a template spectrum for the host galaxy contribution (Kinney et al. 1996), (iii) a template for the Fe ii emission (Boroson & Green 1992), and (iv) a Balmer continuum emission spectrum (Grandi 1982; Storey & Hummer 1995).
To construct representative host galaxy template spectra we combined several individual spectra of given Hubble types. These galaxy spectra were retrieved from the publicly available sample published by Kinney et al. (1996). The spectral resolution of the galaxy spectra amounts to Å which is comparable to the spectral resolution of the NLS1 spectra that we observed. The normal galaxy spectra were transformed into the rest frame. The atmospheric b-band absorption was corrected by linear interpolation. For elliptical galaxies we use templates based on NGC 205, NGC 2865, NGC 1407, and a mean elliptical galaxy spectrum obtained by combining NGC 221, NGC 1399, NGC 1404, NGC 6868, and NGC 7196. The spectrum of NGC 584 is used to represent a S0 type galaxy spectrum. The Sa type galaxy template spectrum is given as an average of NGC 1316 and NGC 6340, and the Sb type galaxy template spectrum is created using NGC 224 (M 31) and NGC 3031 (M 81).
The I Zw1 Fe ii emission spectrum (Boroson & Green 1992) is used as an Fe ii emission template. This Fe ii emission template was broadened in accordance with the emission-line profile width of the broad permitted emission line profiles. The width of the Fe ii emission lines was allowed to vary in steps of km s-1 which is sufficient for a spectral resolution of about km s-1 that we achieved. To compute Balmer continuum emission templates we followed the formalism that was suggested by Grandi (1982) and for the higher order Balmer lines () we used the results presented by Storey & Hummer (1995).
For the NLS1 galaxies of our sample we fit simultaneously a power law continuum, a host galaxy template, an Fe ii emission template, and a Balmer continuum template to the rest frame transformed spectra. The Hubble type of the host galaxy was an additional free parameter. A first guess for the strength of the host galaxy was estimated based on stellar features like CaII H and CaII K, the CN g-band Å, the Mgb triplet, and the NaD absorption line that affects the red wing of the He i emission-line profile. The strength of the individual components of the multi-component fit are displayed in Figure 1 for each NLS1 under study. In Table 2 we list the spectral slopes of the power law continuum fit () together with the Hubble type of the host galaxy as indicated by the best fit. While most of the NLS1 galaxies of this study show power law continuum slopes in the optical that are in the typical range for AGN, i.e. to with on average, four of these 12 NLS1 galaxies show very steep power law continua ( to 1.9, Table 2). As can be seen in Figure 1 the host galaxy contribution has a significant impact on the slope of the observed continuum spectrum because these NLS1 galaxies were observed with a wide slit width that covered a significant part of the host galaxy. To illustrate the host galaxy contribution to the observed NLS1 galaxy spectra we determined the relative flux at Å. The fraction of the host galaxy flux compared to the total observed continuum strength at 5100 Å is given in Table 2. It can be seen that the host galaxy contributes at this wavelength generally % to the continuum flux for the NLS1 galaxies which we observed with a large aperture.
While the contribution of the host galaxy flux can be corrected by employing a properly scaled galaxy template spectrum (Figure 1) there is an additional possibility of a contaminating starburst component. It has been pointed out that for numerous Seyfert 2 galaxies star formation features are detected in their spectra (e.g., Cid-Fernandes et al. 2001; Gonçalves et al. 1999; Véron et al. 1981a) while Seyfert 1 galaxies are rarely accompanied by a starburst component (Rodriguez-Ardila & Viegas 2003). We can not rule out a presence of a young stellar population that would particularly affect the blue part of the spectrum, which might be expected if NLS1 galaxies are representing AGNs in an early evolutionary phase (e.g., Mathur 2000). While stellar features might be washed out by a strong emission-line spectrum, a steep power law continuum with spectral slopes in the range of up to (Mkn 705, NGC 4748, and RXS J20002-5417) can be mimicked by a blue continuum of a young stellar population (e.g., Leitherer et al. 1999). In addition to the multi-component fit analysis we scrutinized the 2-D spectra of the NLS1 galaxies for indications of extended line emission. While we find no indications for extended emission for Mkn 734 and RXS J20002-5417, most of the NLS1 galaxies show some very weak extended emission either for [O iii] and H or H and [N ii] . Only NGC 4748 exhibits faint extended emission in the blue and red part of the spectrum. However, the intensity of the weak extended emission amounts to less than % to % compared to the peak intensity of the corresponding emission lines. Furthermore, if H and [N ii] can be detected their line ratio is in the typical range for AGN excitation. Therefore, this weak additional line emission has no significant impact on the measured emission-line fluxes.
The final multi-component fit has been subtracted and the residuum spectra are plotted in Figure 1. The NLS1 residuum spectra show that the correction for Fe ii emission and the underlying host galaxy spectrum uncovers particularly important emission lines like He ii , as well as several [Fe vi] and [Fe vii] lines at Å. Furthermore, the [O iii] emission-line profiles which we use as profile templates for the NLR emission are corrected for significant Fe ii contamination by the optical multiplet Fe42 (Phillips 1976). The residuum spectra also illustrate that there is still significant Fe ii emission-line flux shortward of Å (Véron-Cetty, Joly, & Véron 2004), the blue end of the Fe ii emission template that we use for the spectral analysis.
3.3 Separation of the NLR and BLR Flux Contribution
To measure and analyze the flux of NLR emission lines, the BLR line emission contribution has to be removed. Generally, a broad emission-line profile can be described using a single or multiple Gaussian components (Clavel et al. 1991; Koratkar & Gaskell 1991; Kriss et al. 1991) but also Lorentzian profiles are suggested (see Véron et al. 1980,1981a,b; Gonçalves et al. 1999; Véron-Cetty et al. 2001). While for some AGNs, broad emission-line profiles can be well described with a single Lorentzian component, comparable and equally reasonable results can be achieved with Gaussian profiles, particularly with a combination of multiple components.
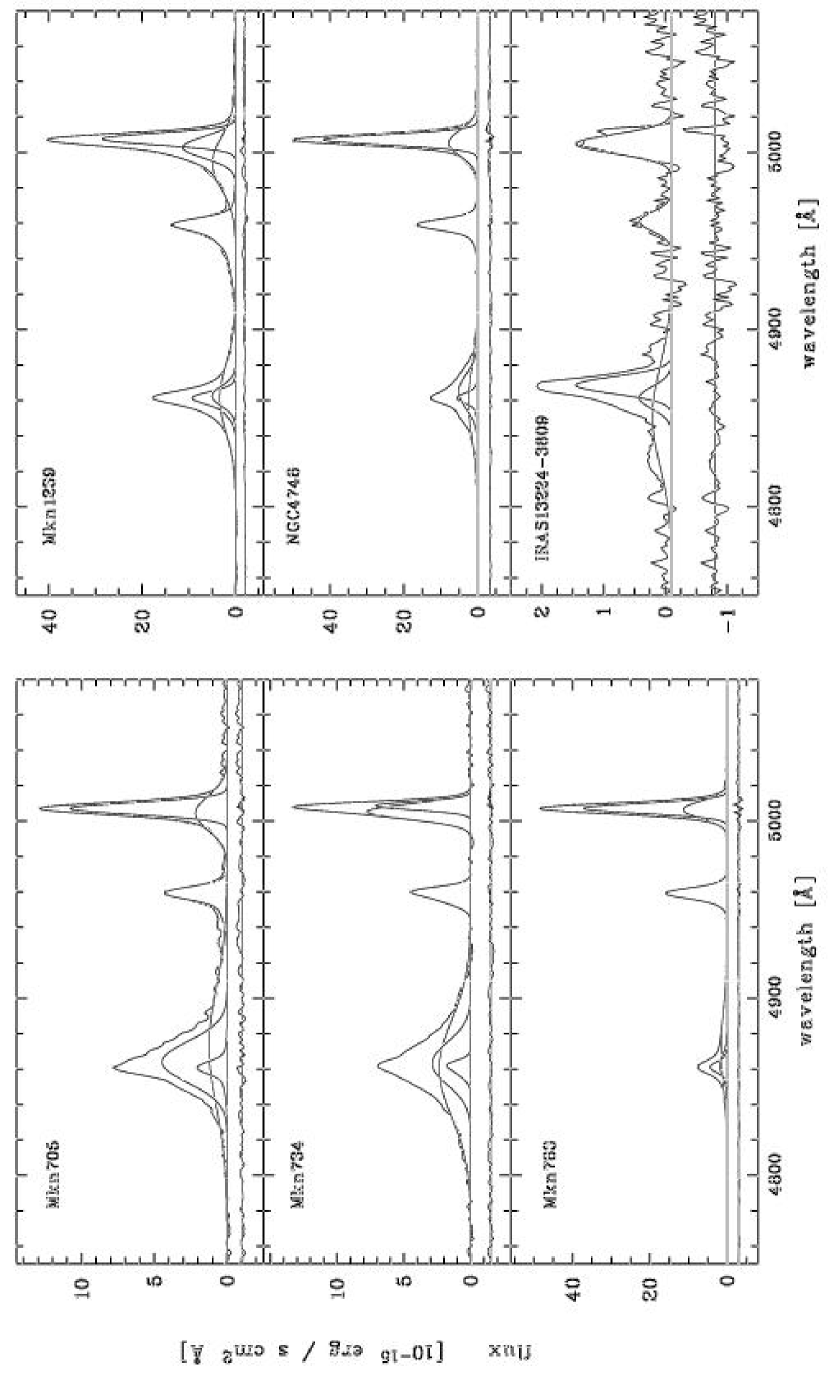
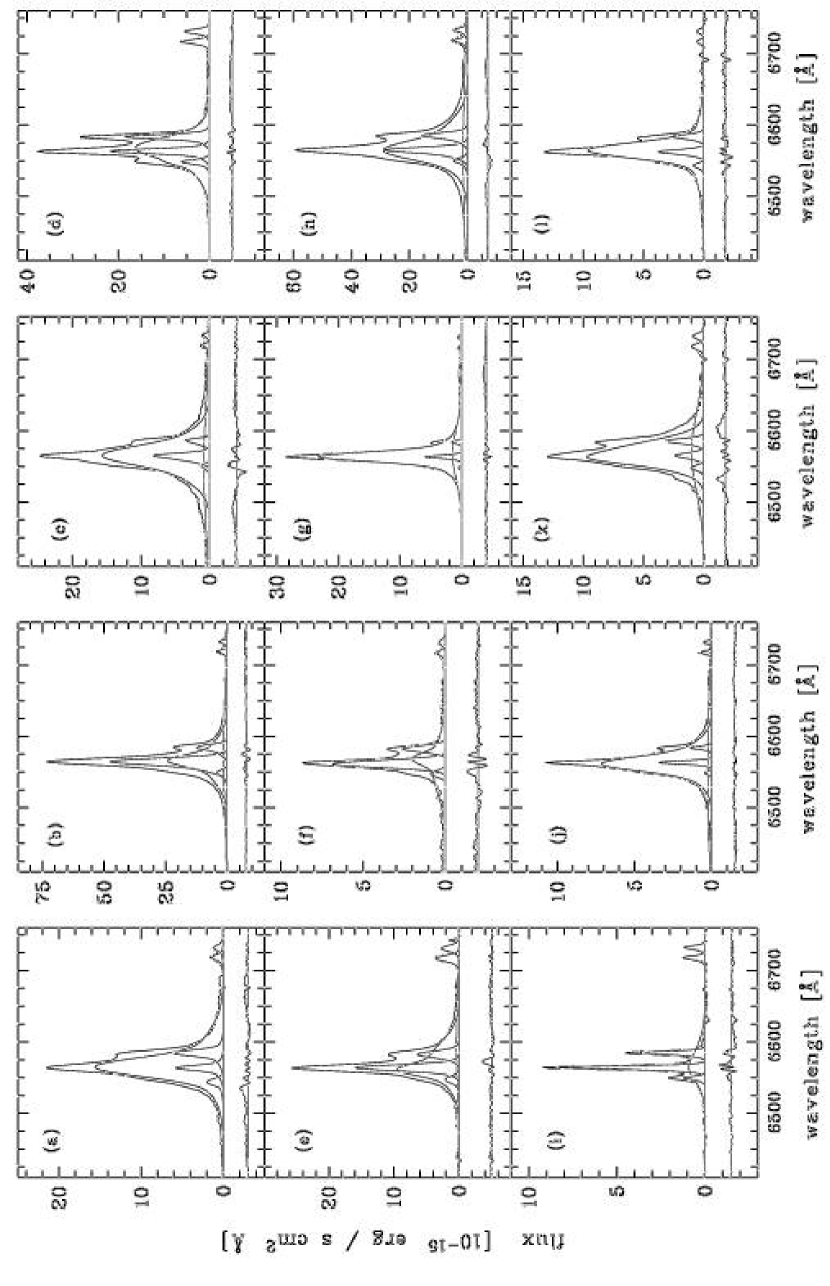
To measure the narrow-line flux, a strong NLR emission line can be used as a template profile. Using high-quality spectra of high spectral resolution, Whittle (1985a,b) has shown that NLR emission lines have similar profiles and especially that the Balmer emission-line profiles are identical with the [O iii] line profile within the uncertainties, even in the case for strongly asymmetric profiles. Therefore, we have used the strong emission-line profiles of [O iii] to obtain a representative NLR line profile template. To characterize the [O iii] profiles we have fit these lines using Gaussian profiles, as well as Lorentzian profiles. While the [O iii] profiles can be well fit for each NLS1 galaxy under study using one or two Gaussian profiles, generally no reasonable fit has been achieved employing Lorentzian profiles. To use consistently the same profile type we fit both [O iii] line profiles with generally two Gaussian components. In the case of IRAS 13224-3809 we use a single Gaussian component while for Mkn 1239 the strong blue asymmetric [O iii] line profile requires a third Gaussian component. In Figure 2 we display the reconstruction of the [O iii] and [O iii] emission-line profiles. These individual Gaussian components have a priori no physical meaning by themselves, but are only used to obtain a NLR line profile template. To measure the narrow-line flux of important forbidden high ionization emission lines like [Ne v] , [Ne iii] , and [Fe vii] , as well as to separate the BLR and NLR contributions of permitted emission lines, we used the fitted [O iii] profile as the NLR emission-line profile template. While the NLR profile shape was kept fixed, the strength of the profile template was allowed to vary, as well as slight variations of the profile width and the location in wavelength space. This approach takes into account that the profile width correlates with the excitation energy of the emission lines and that higher ionization lines tend to be blueshifted relative to lower ionization lines (e.g., De Robertis & Osterbrock 1984; Whittle 1985b; Appenzeller & Östreicher 1988; Erkens et al. 1997), while the profile shape of the NLR emission lines is similar (Whittle 1985b).
To separate the NLR and BLR contributions of the broad permitted emission lines, we used the NLR template profile for the narrow-line emission and two Gaussian profiles to represent the broad emission-line profile. Following this approach we fit the broad H profile with an appropriately scaled NLR profile, and with a broad and an intermediate Gaussian component. The deconvolution of the broad H emission-line profiles is displayed in Figure 2. It is evident that the line width of the intermediate component is generally significantly broader (on average about times) than the narrow component which is associated with the NLR emission-line flux (Figure 2, Table 3). However, for Mkn 705, Mkn 1239, and NGC 4748 we detect a quite broad base of the [O iii] emission line that contributes about % to the total [O iii] emission-line flux. Although it is not necessarily the case that the [O iii] /H emission-line ratio is the same over the range of the entire profile we used the NLR profile template based on [O iii] to recover the narrow H emission-line flux for Mkn 705 and NGC 4748. For these two NLS1 galaxies the width of the intermediate component of the broad H emission-line profile is still % broader than the broad base of the corresponding [O iii] profile. In the case of Mkn 1239 the strong blue asymmetry of the [O iii] emission-line profile which is also detected by Véron-Cetty et al. (2001), is broader than the intermediate component of the H profile (Fig. 2). Hence, for Mkn 1239 we used only the narrow and intermediate component of the [O iii] profile fit to recover the narrow H emission-line flux. For higher ionization lines of Mkn 1239 like [Ne v] this broad component of the [O iii] profile fit was fit independently. In Figures 3 to 5 we show the results of the separation of the NLR and BLR flux contributions for the H [O iii] , the He ii , and H [N ii] emission-line complexes.
3.4 Gaussian versus Lorentzian Profile Components
The choice of a specific profile type to fit the broad emission-line profiles might have a significant impact on the measurement of the narrow emission-line flux. Because we are using multiple Gaussian components we have investigated the range of uncertainty that might be introduced by our approach compared to profile fits based, e.g. on a single Lorentzian profile, which could potentially reduce the measured NLR flux (e.g., Gonçalves et al. 1999; Véron-Cetty et al. 2001).
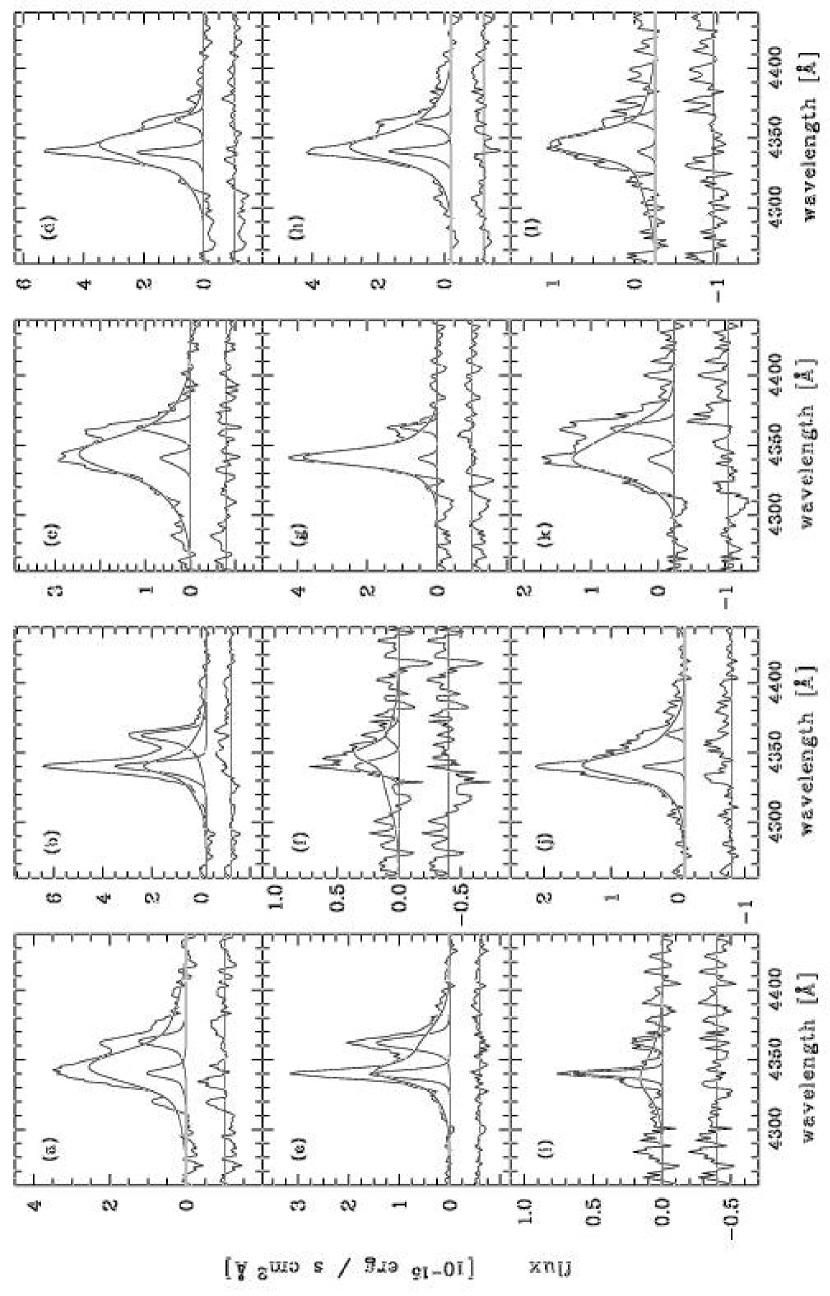
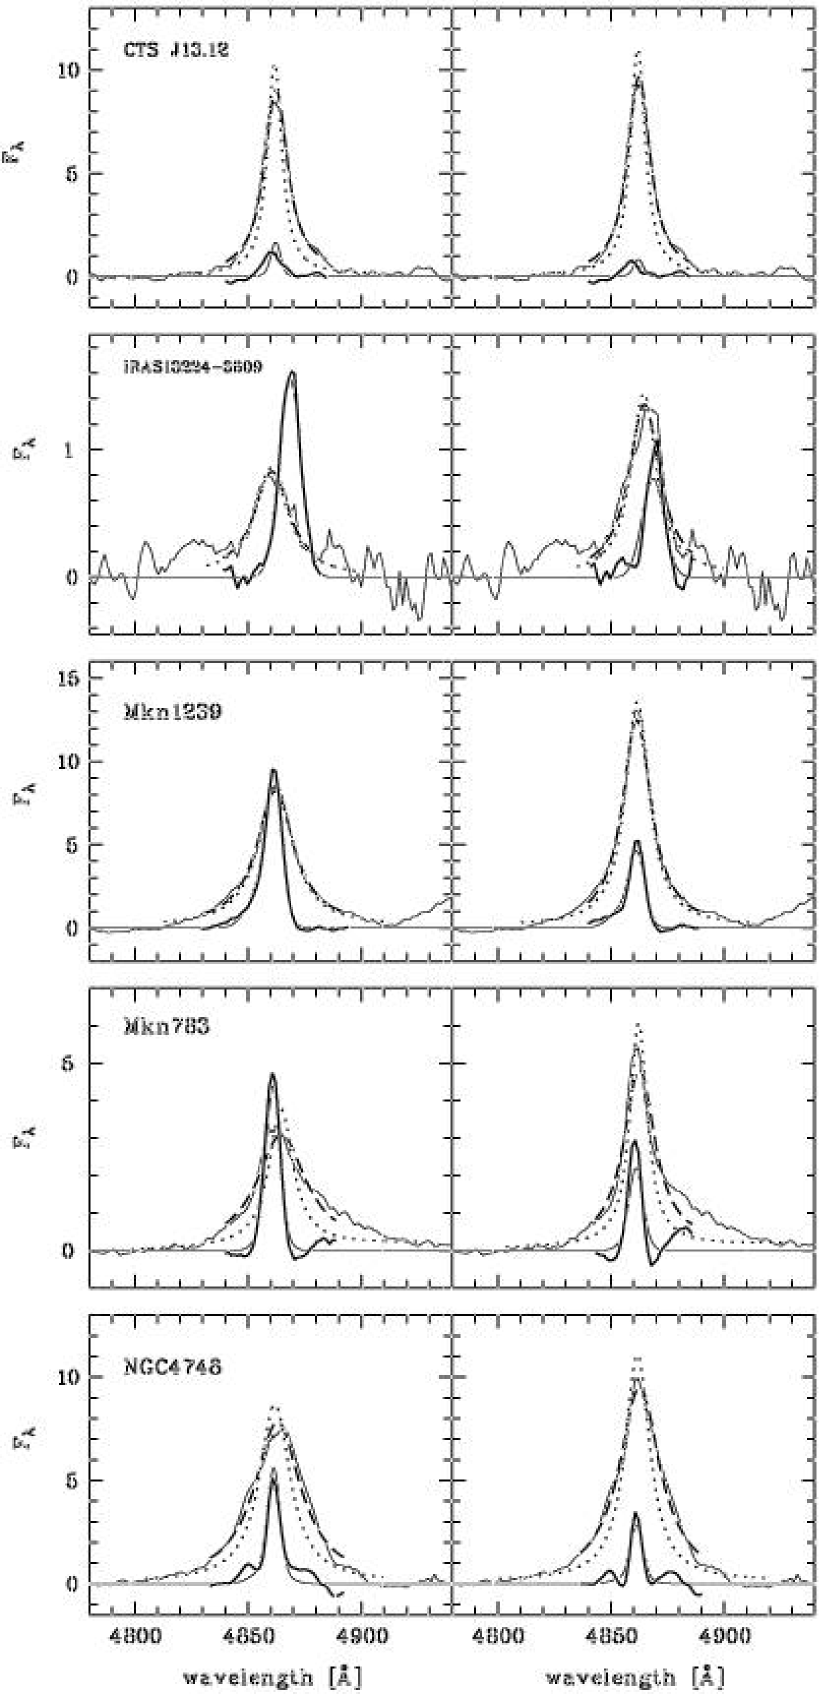
To estimate these systematic errors we analyzed the H emission line profile of each NLS1 galaxy of this study employing a Lorentzian profile to fit the broad component. We studied two cases, assuming a narrow H emission-line flux strength as it is determined using a multiple Gaussian fit for the broad H component or assuming that we are overestimating the narrow H emission-line flux by a factor of 2. The accordingly scaled narrow-line H profile was subtracted from the entire H emission line. The resulting residuum was fit with a single Lorentzian profile. In Figure 6 the results of these tests are displayed for five representative NLS1 galaxies of our sample. Although for a few NLS1 galaxies (IRAS 13224-3809, Mkn 1239, Mkn 896, RXS J20002-5417) a quite reasonable fit can be achieved, in general, we find that Lorentzian profiles yield less satisfying results than the approach we used, i.e., employing two Gaussian components (Figures 2 and 6). Furthermore, the fit strongly depends on the wavelength range that is used for a Lorentzian profile fit. If the fit is restricted to the inner part of the line profile, quite reasonable results can be obtained. However, the broad emission-line flux would be severely overestimated if these fits were extrapolated. If we include the H profiles wings into the fit range, generally the outer parts of the line core are underestimated while the core is significantly overestimated (Figure 6). Furthermore, using a single Lorentzian component, line profile asymmetries are causing strong residuals that would require to employ multiple Lorentzian components.
Although the Lorentzian profile fits which are restricted to the inner part of the profile are severely overestimating the flux of the profile wings we used these fits to estimate the uncertainties introduced by the specific choice of a profile type. The Lorentzian profile fit was subtracted from the original data. The resulting residuum can be associated with the narrow-line H emission which is comparable to the narrow emission-line profile template (Figure 6). The estimated narrow H flux is on average % higher than the flux we have determined, using a two Gaussian component fit. However, generally strong residua are left and for some NLS1s a broad base is present (Mkn 705, Mkn 896, NGC 4748). For comparison, on the right side of Figure 6 we show the fit, which we obtained under the assumption that the narrow H emission-line flux might be up to % weaker than the flux we measured and hence result for some cases in rather low line ratios. Although for some NLS1 galaxies of our sample a Lorentzian profile yields a quite reasonable fit (IRAS 13224-3809, Mkn 1239, Mkn 705, RXS,J20002-5417), the obtained results are rather poor for NLS1s showing profile asymmetries (ESO 399IG20, IRAS 15091-2107, Mkn 291, Mkn 783, NGC 4748).
Thus, the approach of using two Gaussian profiles to fit the broad emission-line profile is more than reasonable instead of using a mix of different profile types and that the introduced systematic uncertainty is of the order of % . It also should be noted that the broad-line profiles show clear inflections in their profile shape which cannot be described with a single component, indicating the presence of two components, independent from the type of profile used to fit.
4 Results
4.1 Broad Emission-Line Profiles
The broad H emission-line profile fit was used as a template to recover the broad emission-line flux of H and higher order Balmer lines. We used the broad H emission-line profile fit as a first guess to recover the broad He i and He ii line profiles with a two Gaussian component fit. In Table 3 we present the results of the analysis of the broad H and He ii emission-line profiles. We find that the NLS1 galaxies of our sample show a strong broad profile base for the permitted lines (Figure 2 and Table 3). Although the deconvolution into two Gaussian components should be taken cautiously, the width of the broad component indicates that NLS1 galaxies contain gas at velocities which are in the typical range of BLS1 galaxies. Furthermore, there is also the trend that the He ii emission line shows a significantly broader line profile than the hydrogen Balmer lines (Table 3). On average the broad component of the He ii emission line is about % wider than the broad H component ( km s-1 and km s-1, respectively). These NLS1 galaxies show a similar trend of broader He ii emission like normal broad-line Seyfert 1 galaxies (BLS1s) (e.g., Osterbrock 1993). While the broad components of the permitted emission-line profiles of H and He ii indicate an ionization stratification of the BLR, the intermediate broad component of these line profiles both show consistently on average a width of to 1250 km s-1 (Table 3). The measured width of the intermediate broad profile amounts to km s-1 and FWHM(He iiim) = km s-1. These intermediate permitted line components display typical NLS1 profile widths. It should be noted that with the exception of CTS J13.12, the NLS1 galaxies of this study show wider broad components than the classical definition of a NLS1 galaxy (Osterbrock & Pogge 1985) which is met by the width of the intermediate component (Table 3). The presence of high velocity gas in the BLR of these NLS1 galaxies is further supported by the full width at zero intensity (FWZI) of the H emission line profile. Since the FWZI of a broad emission-line profile depends crucially on the constraints given by the assumed continuum level, we only provide estimates of the FWZI (Table 3). The estimated FWZI(H) for the NLS1 galaxies range from to km s-1 with an uncertainty of the order of % .
4.2 Emission-Line Flux Measurements
Before the measured emission-line fluxes were analyzed, we corrected the observed line fluxes for internal reddening. Generally, it is assumed that the observed Balmer decrement, i.e. (H/H, can be used to estimate the reddening, at least for the NLR emission (e.g., Davidson & Netzer 1979; Netzer 1982). We assumed an intrinsic Balmer decrement of to estimate values using the relation
| (1) |
with R(H) and R(H) as corresponding Galactic extinction coefficients. Together with a Galactic reddening curve we corrected the observed emission line ratios relative to F(H) applying
| (2) |
with Rλ as the Galactic extinction coefficient at the wavelength of the corresponding emission line. Although there are indications that the intrinsic Balmer decrement is about under AGN conditions due to collisional enhancement in the partially ionized zone (e.g., Gaskell & Ferland 1984; Halpern & Steiner 1983; Netzer 1982) we used the classical value of 2.8 for pure recombination case B. Assuming case B with appears to be quite appropriate for the spectra of the studied NLS1s because significant [O ii] emission indicates the presence of a large fraction of low density gas ( cm-3 for and cm-3 for , Osterbrock 1989). Thus, additional collisional enhancement, particularly of H is not expected to be strong. To estimate the impact of a larger Balmer decrement we also employed as intrinsic Balmer decrement. We find that the resulting reddening corrected line ratios are less than 10 % larger for line ratios shortward of H and less than 10 % smaller for line ratios longward of H using a larger Balmer decrement. Hence, even for emission line ratios that involve emission lines like [O ii] and [O iii] the effect is less than 10 % .
As shown in Table 2, we find that the Balmer decrements indicate generally larger for the NLR compared to the BLR. However, the values which are estimated for the BLR may be overestimated because the intrinsic H/H ratio may be larger than the value for pure recombination. Due to collisional enhancement of particularly H (Gaskell & Ferland 1984; Halpern & Steiner 1983; Netzer 1982) and complex radiative transfer effects in the higher density BLR gas, the H/H line ratio might be less useful as a reddening indicator (e.g., Davidson & Netzer 1979). On average the NLR flux ratios of and indicate compared to (Table 2). The average extinction that we estimate for the NLR is consistent with measurements given by Wills et al. (1993a). In Table 4 we provide the observed broad emission-line flux measurements for the Balmer lines H, H, H and for He i and He ii . For the H and He ii emission lines the observed flux as given by the broad and intermediate broad component are given separately to illustrate the relative contribution of these components to the total broad emission-line flux. In Table 5, we present the observed and reddening corrected emission-line intensities of the NLR emission-line spectrum. The line fluxes have been normalized to F(H) = 1.0.
4.3 Diagnostic Emission-Line Ratios
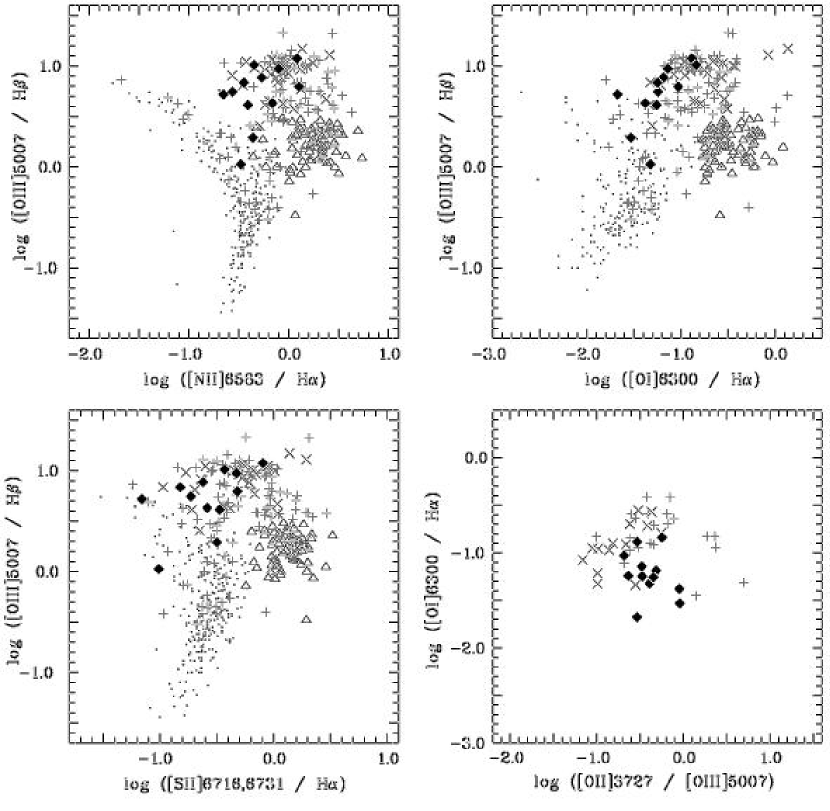
To specify the nature of the ionizing continuum and to obtain a first estimate of the spectral shape we used several emission-line ratios that are suggested by Baldwin, Phillips, & Terlevich (1981) and Veilleux & Osterbrock (1987). In Figure 7 we display the narrow emission-line flux ratios of F([N ii] )/F(H), F([O i] )/F(H), and F([S ii] )/F(H) versus F([O iii] )/ F(H), as well as F([O ii] )/F([O iii] ) versus F([O i] )/F(H). The use of the [O iii] emission-line profile as a template for the NLR emission enables a consistent measurement and separation of blended narrow emission lines like [O iii] and the [N ii] doublet from H and H, respectively (see Figures 3 and 5). To illustrate how the NLR emission-line ratios of the NLS1 galaxies relate to those of H ii regions, starburst galaxies, LINER, and broad-line Seyfert 1, we included the results from several other studies in Figure 7.
The location of emission-line ratios that are observed for H ii regions (McCall, Rybski, & Shields 1985; Veilleux & Osterbrock 1987; Ho, Filippenko, & Sargent 1997) are marked as dots. The open triangles are the results for LINERs as given in Ho et al. (1997). The crosses ’’ and ’’ show The location of these line ratios for Seyfert 1 and Seyfert 2 galaxies are shown as ”cross” and ”plus-sign” respectively and the are published by Koski (1978), Cohen (1983), Veilleux & Osterbrock (1987), and Ho et al. (1997). As can be seen the line ratios for the NLS1 galaxies (filled diamonds) overlap well with the region for BLS1 galaxies. The NLS1s are clearly separated from the area occupied by H ii regions and LINER galaxies.
We find for the NLS1 galaxies under study that the F([O iii] )/F(H) ratio amounts generally to to (Table 5), i.e., a typical range for NLR ratios of Seyfert 1 and Seyfert 2. It is on average only slightly smaller, which is consistent with the result by Véron-Cetty et al. (2001). This result also indicates that the narrow H emission-line flux cannot be significantly overestimated. However, two NLS1 galaxies, i.e., Mkn 291 and IRAS 13224-3809, show a low F([O iii] )/F(H) ratio with and , respectively, which place them in the range of LINER galaxies. Together with the low F([N ii] )/F(H) ratio these objects are located in a transition region of Seyfert galaxies and H ii regions in these diagnostic line ratio diagrams (e.g., Veilleux & Osterbrock 1987; Ho et al. 1997).
The NLS1 galaxies show similar emission-line ratios like BLS1 galaxies. It can be seen that low ionization lines like [O i] in NLS1s overlap with those in BLS1s, but are slightly weaker on average. This trend is shown in the F([O iii] )/F(H) vs. F([O i] )/F(H) diagram. The F([O i] )/F(H) ratios tend to be shifted to smaller ratios than observed for BLS1s. The tendency of relatively weaker low-ionization lines can be seen even more obviously in the F([O ii] )/F([O iii] ) vs. F([O i] )/F(H) diagram (Figure 7). While the F([O ii] )/F([O iii] ) ratio covers a similar range like BLS1 galaxies, i.e., no indications for enhanced [O ii] emission, the F([O i] )/F(H) ratios of the NLS1 galaxies under study are shifted to lower values. A similar trend can be seen for the F([S ii] )/F(H) and F([N ii] )/ F(H) ratios. They tend to populate the lower end of the distribution of these ratios which is shown by BLS1 galaxies (Fig. 7). The trend of a little weaker low-ionization line emission on average in these NLS1s is consistent with the results of similar studies (e.g., Rodriguez-Ardila et al. 2000). However, it has also been suggested that NLS1 and BLS1 galaxies show no statistically significant difference for the F([O i] )/F(H) line ratio (Nagao et al. 2001).
4.4 Optical Fe ii Emission — Fe ii4570
Among the generally observed characteristics of NLS1 galaxies is a strong optical Fe ii emission (e.g., Osterbrock & Pogge 1985; Boller, Brandt, & Fink 1996). It has been found that the strength of the optical Fe ii emission is anti-correlated with the strength of the H emission, the relative strength of the [O iii] emission line, as well as with the profile width of the H emission (e.g., Wills 1982; Gaskell 1985; Goodrich 1989; Zheng & O’Brien 1990; Boroson & Green 1992).
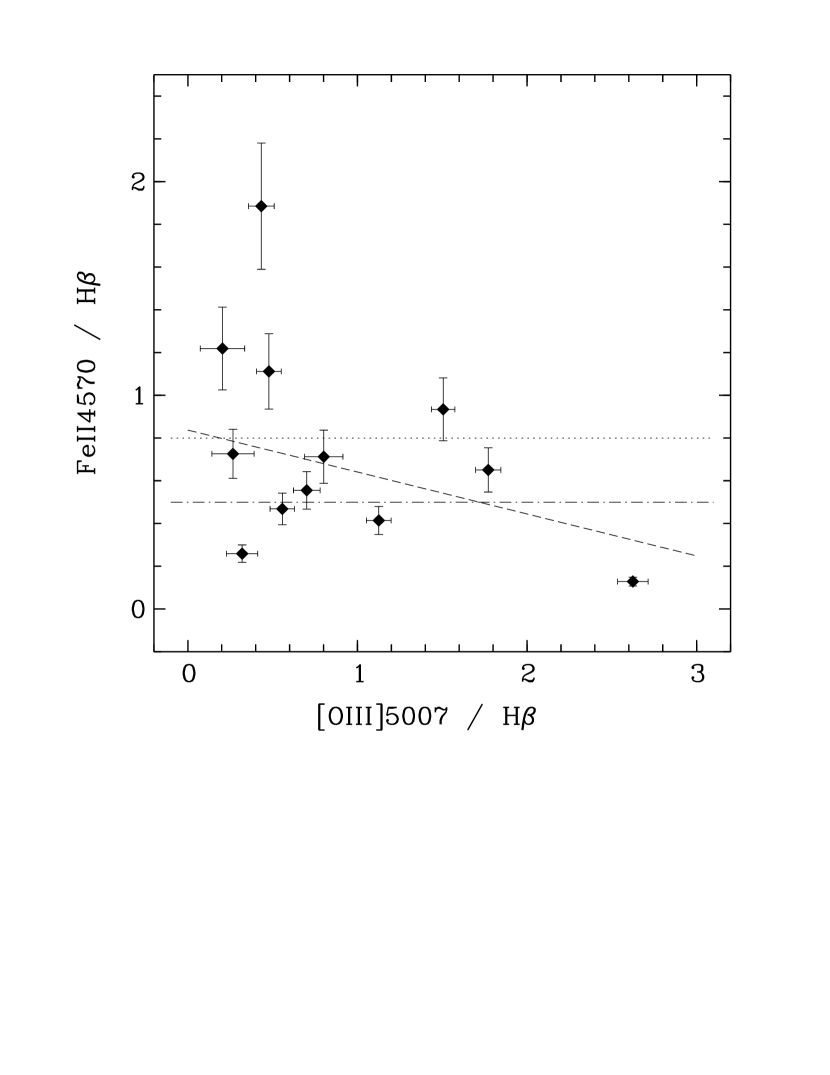
To determine the flux of the optical Fe ii emission we measured the Fe ii4570 feature that is dominated by the optical iron multiplets Fe37 and Fe38. The flux of the Fe ii4570 feature is integrated over the range Å in the optical Fe ii emission template that results from the multi-component fit approach. The observed relative Fe ii4570 strength, i.e. F(Fe ii4570)/F(H) following Gaskell (1985), is shown in Figure 8 as a function of the relative [O iii] emission-line strength relative to H. On average, the NLS1 galaxies show F(Fe ii4570)/F(H) = . This result of on average relatively larger F(Fe ii4570)/F(H) ratios is consistent with former studies (e.g., Gaskell 1985; Joly 1991 and references therein). While it is generally assumed that NLS1s exhibit strong Fe ii emission it has been suggested that the enhanced F(Fe ii)/F(H) ratios are caused by suppressed H emission in higher density gas (Gaskell 1985,2000) in the case of NLS1 galaxies.
The NLS1 galaxies under study display the well-known trend of a decreasing Fe ii4570 strength for an increasing F([O iii] )/F(H) ratio. However, the trend is dominated by Mkn 783 and IRAS 13224-3809 at the low and high end of the F(Fe ii4570)/F(H) ratios, respectively (Figure 8). Although the scatter of the relative Fe ii4570 strength is quite large we calculated a simple linear fit. The probability that the correlation occurs by chance amounts to % and hence the trend is only indicated. At the extreme end of the anti-correlation we find IRAS 13224-3809 which show strong optical Fe ii emission and only relatively weak [O iii] emission. IRAS 13224-3809 is a well known extreme strong optical Fe ii emitter (e.g., Boller et al. 1996; Véron-Cetty et al. 2001). The relative strength of F(Fe ii4570)/F(H) = is consistent with previous results (F(Fe ii4570)/F(H, Boller et al. 1996).
5 Discussion
5.1 The BLR Emission-Line Profiles
Unusually narrow permitted emission lines ( km s-1) are among the characteristic properties that drew attention to NLS1 galaxies as an interesting AGN subclass (e.g., Osterbrock & Pogge 1985; Goodrich 1989). Later they were found to have distinct X-ray properties, particularly rapid variability and a strong soft X-ray excess with a continuum slope () on average compared to for BLS1 galaxies (e.g., Boller et al. 1996; Laor et al. 1997; Grupe et al. 1998).
As can be seen in Figure 2 the broad permitted H emission-line profile show in addition to the characteristic component of intermediate width a strong broad component as well. Although the deconvolution into two Gaussian components should be taken with caution it clearly indicates that high velocity gas is also present in NLS1 galaxies. The width of this broad component of the H profile amounts on average to FWHM km s-1, which is in the typical range of BLS1 galaxies. For comparison, we measured the profile width of the H emission line for well-known classical BLS1 galaxies, NGC 3783, NGC 3516, and NGC 5548. These Seyfert 1 galaxies show profile widths of FWHM(H) = 2600, 4000, and 4750 km s-1, respectively.
The presence of broad profile components in NLS1 galaxies that are typical for BLS1 galaxies have already been reported. Rodriguez-Pascual et al. (1997) detected broad-line emission in several NLS1 galaxies in the ultraviolet for Ly, C iv, and He ii . But, they did not detect broad emission components for the permitted optical lines. They interpreted this result as an indication that the BLR of NLS1s is lacking a significant fraction of partially ionized gas at high velocities and hence no broad components for low ionization lines like hydrogen Balmer lines are detected. In contrast the presence of a broad component of permitted lines in the optical spectra that we detect and that were reported earlier (e.g., Grupe et al. 1999; Véron-Cetty et al. 2001) provides evidence that the BLRs of the NLS1s do contain a significant fraction of partially ionized gas at high velocities. Although the measurement of the FWZI of an emission line depends on the assumed continuum level, we estimated the FWZI(H) in a range from to km s-1 for the NLS1s of this study. This result provides further support for the presence of high velocity low ionization gas. The fraction of the broad emission-line flux that is carried by this broad component is on average at least % of the entire broad emission line flux (Table 4). We conclude that this result indicates that these classical and well-known NLS1 galaxies that we observed do indeed possess a strong broad component that dominates the broad-line flux. But in contrast to BLS1s these NLS1 galaxies show a more distinct profile component that is associated with gas of intermediate line width, i.e. FWHM km s-1.
To compare the relative strength of the broad emission-line flux of NLS1 galaxies with those of BLS1 galaxies we also measured the equivalent width, Wλ, of the entire H emission-line profile (Table 6). We find that for the entire broad H profile the equivalent width amounts on average to Wλ(H) = Å for the NLS1 galaxies of our sample. Although this indicates a trend to smaller Wλ(H) for NLS1 galaxies, within the uncertainties it is consistent with measurements of Wλ(H) for BLS1 galaxies of comparable luminosity which is quoted to be Å (e.g., Osterbrock 1977; Goodrich 1989; Croom et al. 2002; Dietrich et al. 2002). Although the separation into a broad and an intermediate component should be regarded with cautious, we measured Wλ for both of these components. We find that the equivalent width of the broad component amounts to Wλ(H) = Å on average. This result suggests that the broad component in NLS1 galaxies is about a factor weaker than in BLS1 galaxies while at the same time the intermediate component is more pronounced.
The composition of the broad emission-line profiles of the studied NLS1s is remarkably similar to those found in a small sample of NL QSOs. Baldwin et al. (1988) studied permitted high ionization emission-line profiles, e.g. C iv. They found that a dominant broad component contains about % of the flux. Together with an intermediate component this results in narrow composite line profiles. Although Baldwin et al. (1988) studied high ionization lines, the detection of a similar broad component in low ionization lines like H for NLS1 galaxies indicates the presence of a significant fraction of low ionization gas at high velocity dispersion. Furthermore, Wills et al. (1993b) and Brotherton et al. (1994) presented models that introduced an intermediate (ILR) and a very broad emission-line region (VBLR) to describe the broad emission-line region. The ILR and VBLR are characterized by profile widths of FWHM(ILR) km s-1 and FWHM(VBLR) km s-1, while the density of the corresponding regions are cm-3 and cm-3. A similar decomposition of the line profiles has been suggested by Baldwin et al. (1996) who studied high ionization line profiles of several quasars. They showed that generally the broad-line profiles and the observed emission-line ratios can be ascribed to three components. They found indications for a narrow component with FWHM km s-1, but in contrast to the ILR this component is supposed to have a significantly higher gas density ( cm-3) than the ILR component. Very recently, there have been further suggestions that the BLR of active galactic nuclei can be well described by two distinct emission regions that can be associated with a broad and intermediate component of the observed emission-line profile (e.g., Leighly 2004; Snedden & Gaskell 2004).
5.2 The Ionizing EUV – Soft X-Ray Continuum Shape and Strength
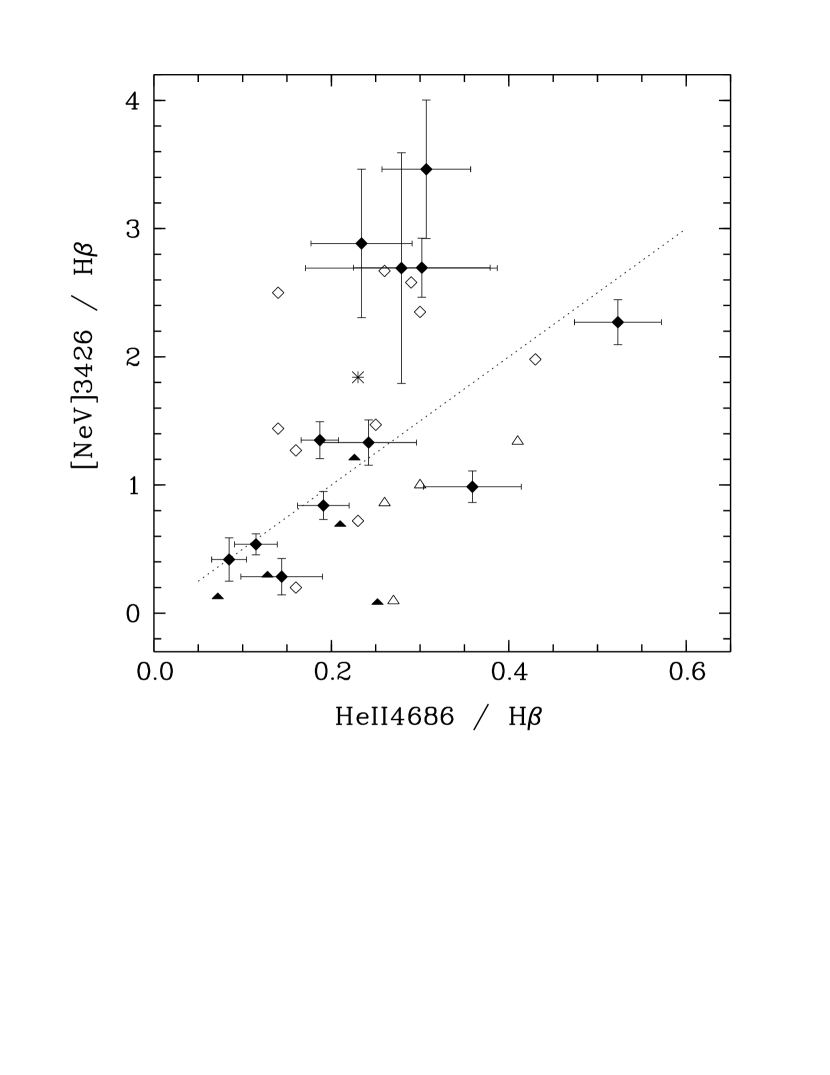
The diagnostic emission-line ratios that are generally used to distinguish between different excitation mechanisms, and hence different shapes of the ionizing continuum, indicate that NLS1 and BLS1 galaxies appear to be very similar (Figure 7). To specify the strength of the ionizing continuum and to explore whether NLS1 galaxies show generally a relatively stronger EUV – X-ray continuum, i.e. a more prominent BBB than BLS1 galaxies, the narrow emission-line ratio of F(He ii )/F(H) is a valuable tool. This line ratio provides information about the relative flux density of ionizing photons with energies eV and eV, respectively. To trace the EUV – soft X-ray continuum to even higher energies we make use of the F([Ne v] )/F(H) line ratio which yields information at energies eV. In Figure 9 we show the narrow F(He ii )/F(H) versus the F([Ne v] )/F(H) ratio. For comparison we included results for BLS1 galaxies taken from the literature and from former studies which also provided measurements of the [Ne v] emission line (Koski 1978; Cohen 1983; Osterbrock & Pogge 1985; Kraemer et al. 1998). It can be seen that the NLS1 galaxies (filled diamonds) cover a wide range in both ratios, the F(He ii )/F(H) and the F([Ne v] )/F(H).
To estimate a typical ratio for F([Ne v] ) with F(He ii ) we computed photoionization models, assuming solar abundances (Grevesse & Anders 1989), for two different continuum SEDs (Kraemer et al. 2004). The [Ne v] /He ii will be maximal when the fraction of Ne+4 is in a maximum. For a typical broken power law AGN continuum SED, with , with for energies less than 1 keV and for higher energies this occurs at a ionization parameter U of log U = -1.5 and a column density of cm-2 (matter bounded). The [Ne v] /He ii emission-line ratio that depends also on the gas density can reach values up to . The [Ne v] emissivity increases as approaching the critical density for the upper level of the transition ( cm-3; Osterbrock 1989) while for higher densities collisional de-excitation will dominate over radiative decay. If we assume a continuum SED with an additional EUV bump ( for energies E 100 eV, for 100 E 1 keV, and for E 1 keV) this ratio can reach value up to Even higher values can be achieved if the continuum is filtered through an absorber, that is optically thick at the He ii Lyman limit. Most of the F([Ne v] )/F(H) and F(He ii )/F(H) emission-line ratios which be measured for the NLS1 galaxies are consistent with the theoretical range that is expected for NLR gas photoionized by an AGN continuum as is indicated by the dotted lines in Figure 9. The same trend is given by the small sample of classical NLS1 galaxies studied by Osterbrock & Pogge (1985). However, 4 NLS1 galaxies of our sample exhibit several times stronger [Ne v] emission relative to H than expected based on the relative strength of the He ii emission line. To compare their distribution with those of BLS1 galaxies we include measurements of these line ratios that are observed for BLS1s (Koski 1978; Cohen 1983; Kraemer et al. 1999). In comparison with the NLS1 galaxies the normal BLS1 galaxies show a very similar distribution of the F(He ii )/F(H) vs. F([Ne v] )/F(H) ratios. While most of the BLS1 galaxies also follow the expected relation for these two line ratios like the NLS1s, a few BLS1 galaxies deviate significantly from this trend. Therefore, NLS1 and BLS1 galaxies show a very similar distribution of the narrow F(He ii )/F(H) and F([Ne v] )/F(H) ratios. This indicates that the range of shapes and relative strengths of the ionizing EUV continuum in NLS1 and BLS1 galaxies are similar at least up to eV.
The similar emission-line ratios that involve low and high ionization lines and the distribution of these ratios in diagnostic diagrams (Figures 7 and 9) indicate that the physical conditions of the NLR gas in NLS1 and BLS1 galaxies are comparable. However, intensive studies on the X-ray continuum shape and strength have revealed that the soft and hard X-ray spectrum of NLS1 galaxies are generally steeper compared to those of BLS1s (e.g., Boller et al. 1996; Brandt et al. 1997; Vaughan et al. 1999; Leighly 1999a,b). It has also been found that the parameter that connects the X-ray part of the spectrum at keV with the continuum strength at 2500 Å is very similar for NLS1 and BLS1 galaxies (e.g., Grupe et al. 1998). This result is usually interpreted as an indication that NLS1 galaxies show in general significant excess emission in the EUV – soft X-ray range of their continuum. However, a recent study by Kraemer et al. (2004) detects no strong evidence for much stronger soft X-ray – EUV excess emission in NLS1 galaxies compared to those in BLS1 galaxies, investigating the strength of the 2 - 10 keV X-ray flux with the [O iii] luminosity for a sample of NLS1 and BLS1 galaxies.
In an upcoming paper we will investigate in more detail the observed emission line ratios and the EUV – soft X-ray excess in the ionizing continuum. In contrast to modeling the BLR emission spectrum, a detailed study of the NLR emission will avoid serious uncertainties of radiative transfer aspects that are affecting BLR photoionization models. Alexander et al. (1999) and Kraemer et al. (1999,2000) have shown that accurate photoionization modeling of the NLR emission provide reliable constraints on the SED of the ionizing continuum.
6 Conclusion
We observed a sample of 12 NLS1 galaxies in the optical. To analyze their emission-line spectra we used the [O iii] emission-line profile as a template to separate the BLR and NLR flux contributions. NLR emission-line fluxes are measured for emission lines beginning with [Ne v] up to [S ii] .
We find that the broad emission-line profiles of the permitted lines can be well represented employing a two Gaussian component fit. The width of the broad component amounts to km s-1 for H which is in the typical range of classical normal BLS1 galaxies. The intermediate broad component shows a width of km s-1. Although the approach of using two Gaussian components to describe broad emission-line profiles may be oversimplified, the presence of a broad component with a profile width of several 1000 km s-1 FWHM and a FWZI that ranges up to km s-1 strongly indicates the existence of gas at high velocities in NLS1s. Furthermore, the emission-line flux that can be associated with the BLR of the NLS1 galaxies of our sample amounts to at least 60% of the detected emission line flux, i.e. it dominates the total line flux, similar to BLS1 galaxies.
To study the ionizing EUV – soft X-ray continuum we calculated several narrow emission-line ratios to trace the shape and strength of the continuum SED. We find that generally the F([O iii] )/F(H) ratio varies between to 12 for the NLS1 galaxies we studied. Hence, it is in the typical range that is observed for BLS1 galaxies with a trend to a little smaller values.
Information about the nature and shape of the ionizing continuum can be
obtained from diagnostic emission-line ratios. We determined the classical
emission-line flux ratios such as
F([N ii] )/F(H),
F([O i] )/F(H),
F([S ii] )/F(H) vs.
F([O iii] )/ F(H) and
F([O ii] )/F([O iii] ) vs.
F([O i] )/F(H).
The NLS1 galaxies of our sample show a similar distribution of these line
ratios like BLS1 galaxies which reflects that the spectral energy distribution
of the ionizing EUV – soft X-ray continuum may not be too different.
Similar to previous studies we find a trend of weaker
F([O i] )/F(H) emission-line ratios for NLS1s compared
to BLS1s which can be also seen for the ratios
F([N ii] )/F(H) and
F([S ii] )/F(H).
A detected trend of weaker low ionization lines suggests that the NLR gas
of these NLS1 galaxies may be in a state of slightly higher ionization or that
the relative fraction of low ionization gas is reduced.
The relative strength of important forbidden high ionization lines like [Ne v] compared to narrow He ii provide an additional indication that the ionizing continuum of BLS1 and NLS1 might be quite similar. Based on these results we find no strong indications for the presence of a strong BBB in the ionizing EUV – soft X-ray continuum for most of the NLS1 galaxies of our sample. However, the presence of significant EUV – soft X-ray continuum excess emission can be camouflaged by an effective UV absorber which modifies the ionizing continuum spectrum that excites the NLR gas accordingly. We will investigate these scenarios using detailed photoionization models in more detail in paper II of this study.
References
- (1) Alexander, T., et al. 1999, ApJ, 512, 204
- (2) Appenzeller, I. & Östreicher, R. 1988, AJ, 95, 45
- (3) Baldwin, J.A., Phillips, M.M., & Terlevich, R. 1981, PASP, 93, 5
- (4) Baldwin, J.A., McMahon, R., Hazard, C., & Williams, R.E. 1988, ApJ, 327, 103
- (5) Baldwin, J.A., et al. 1996, ApJ, 461, 664
- (6) Band, D.L. & Malkan, M.A. 1989, ApJ, 345, 122
- (7) Binette, L., Robinson, A., & Courvoisier, T.J.-L. 1988, A&A, 914, 65
- (8) Binette, L., Prieto, A., Szuszkiewicz, E., & Zheng, W. 1989, ApJ, 343, 135
- (9) Boller, Th., Brandt, W.N., & Fink, H. 1996, A&A, 305, 53
- (10) Boller, Th., Brandt, W.N., Fabian, A.C., & Fink, H. 1997, MNRAS, 289, 393
- (11) Boroson, T.A. & Green, R.F. 1992, ApJS, 80, 109
- (12) Brandt, W.N., Mathur, S., & Elvis, M. 1997, MNRAS, 285, L25
- (13) Brocksopp, C., et al. 1999, MNRAS, 309, 1063
- (14) Brotherton, M.S., Wills, B.J., Steidel, C.C., & Sargent, W.L.W. 1994, ApJ, 423, 131
- (15) Casebeer, D. & Leighly, K.M. 2003, in “Active Galactic Nuclei: From Central Engine to Host Galaxy”, eds. S.Collin, F.Combes, and I.Shlosman, ASP Conf.Ser., Vol.290, p.81
- (16) Cid-Fernandes, R., Heckman, T., Schmitt, H., Gonzalez-Delgado, R.M., & Storchi-Bergmann, T. 2001, ApJ, 558, 81
- (17) Clavel, J., et al. 1991, ApJ, 366, 64
- (18) Croom, S.M., et al. 2002, MNRAS, 337, 275
- (19) Cohen, R.D. 1983, ApJ, 273, 489
- (20) Collin, S., 2001, in ”Advanced Lectures on the Starburst - AGN Connection”, eds, I. Aretxaga, D. Kunth, and R. Mújica, World Scientific, p.167ff
- (21) Davidson, K. & Netzer, H. 1979, Reviews of Modern Physics, 51, 715
- (22) De Robertis, M.M. & Osterbrock, D.E. 1984, ApJ, 286, 171
- (23) Dickey, J.M. & Lockman, F.J. 1990, ARA&A, 28, 215
- (24) Dietrich, M., et al. 2002, ApJ, 581, 912
- (25) Elvis, M., et al. 1986, ApJ, 310, 291
- (26) Erkens, U., Appenzeller, I., & Wagner, S. 1997, A&A, 323, 707
- (27) Gaskell, C.M. 1985, ApJ, 291, 112
- (28) Gaskell, C.M. & Ferland, G.J. 1984, PASP, 96, 393
- (29) Gaskell, C.M. 2000, New Astronomy Reviews, 44, 563
- (30) Gonçalves, A.C., Véron, P., & Véron-Cetty, M.-P. 1999, aap, 341,662
- (31) Goodrich, R.W. 1989, ApJ, 342, 224
- (32) Grandi, S.A. 1982, ApJ, 255, 25
- (33) Grevesse, N. & Anders, E. 1989, AIPC, 183, 1
- (34) Grupe, D., Beuermann, K., Mannheim, K., Thomas, H.-C., Fink, H.H., & De Martino, D. 1995 A&A, 300, 21
- (35) Grupe, D., Beuermann, K., Thomas, H.-C., Mannheim, K., & Fink, H.H. 1998 A&A, 330, 25
- (36) Grupe, D., Beuermann, K., Mannheim, K., & Thomas, H.-C. 1999, A&A, 350, 805
- (37) Grupe, D., Leighly, K.M., Thomas, H.-C., & Laurent-Muehleiser, S.A. 2000, A&A, 356, 11
- (38) Halpern, J.P. & Steiner, J.E. 1983, ApJ, 269, L37
- (39) Hamuy, M., et al. 1992, PASP, 104, 533
- (40) Ho, L., Filippenko, A.V., & Sargent, W.L.W. 1997, ApJ, 112, 315
- (41) Joly, M. 1991, A&A, 242, 49
- (42) Kinney, A.L., et al. 1996, ApJ, 467, 38
- (43) Koratkar, A.P. & Gaskell, C.M. 1991, ApJ, 375, 85
- (44) Korista, K., Ferland, G., & Baldwin, J. 1997, ApJ, 487, 555
- (45) Koski, A.T. 1978, ApJ, 223, 56
- (46) Kraemer, S.B., Crenshaw, D.M, Filippenko, A.V., & Peterson, B.M. 1998, ApJ, 499, 719
- (47) Kraemer, S.B. & Crenshaw, D.M. 2000, ApJ, 532, 256
- (48) Kraemer, S.B., Turner, T.J., Crenshaw, D.M., & George, I.M. 1999, ApJ, 519, 69
- (49) Kraemer, S.B., et al. 2000, ApJ, 531, 278
- (50) Kraemer, S.B., George, I.M., Crenshaw, D.M., & Gabel, J.R. 2004, ApJ, 607, 794
- (51) Kriss, G.A., et al. 1991, ApJ, 377, L13
- (52) Krolik, J.H. & Kallman, T.R. 1988, ApJ, 324, 714
- (53) Laor, A., Fiori, F., Elvis, M., Wilkes, B.J., & McDowell, J.C. 1997, ApJ, 477, 93
- (54) Laor, A. & Netzer, H. 1989, MNRAS, 238, 897
- (55) Leighly, K.M. 1999a, ApJS, 125, 297
- (56) Leighly, K.M. 1999b, ApJS, 125, 317
- (57) Leighly, K.M. 2000, New Astronomy Reviews, 44, 395
- (58) Leighly, K.M. 2004, ApJ, 611, 125
- (59) Leitherer, C., et al. 1999, ApJS, 123, 3
- (60) Mathews, W.G. & Ferland, G.J. 1987, ApJ, 323, 456
- (61) Mathur, S. 2000, MNRAS, 314, L17
- (62) McCall, M.L., Rybski, P.M., & Shields, G.A. 1985, ApJS, 57, 1
- (63) Nagao, T., Murayama, T., & Taniguchi, Y. 2001, ApJ, 546, 744
- (64) Netzer, H. 1982, MNRAS, 198, 589
- (65) Netzer, H., Laor, A., & Gondhalekar, P.M. 1992, MNRAS, 254, 15
- (66) Osterbrock, D.E. 1977, ApJ, 215, 733
- (67) Osterbrock, D.E. 1989 in “Physics of Gaseous Nebulae and Active Galactic Nuclei”, University Science Books, p.65
- (68) Osterbrock, D.E. & Pogge, R.W. 1985, ApJ, 297, 166
- (69) Osterbrock, D.E. 1993, ApJ, 404, 551
- (70) Pfefferkorn, F., Boller, Th., & Rafanelli, P. 2001, A&A, 368, 797
- (71) Philipps, M.M. 1976, ApJ, 208, 37
- (72) Pogge, R.W. 2000, New Astronomy Reviews, 44, 381
- (73) Pounds, K.A., Done, C., & Osborne, J.P. 1996, MNRAS, 277, L5
- (74) Rees, M. 1984, ARA&A, 22, 471
- (75) Rodriguez-Ardila, A., Binette, L., Pastoriza, M.G., & Donzelli, C.J. 2000, ApJ, 538, 581
- (76) Rodriguez-Ardila, A. & Viegas, S.M. 2003, MNRAS, 340, L33
- (77) Rodriguez-Pascual, P.M., Mas-Hesse, J.M., & Santos-Lleó, M. 1997, A&A, 327, 72
- (78) Ross, R.R. & Fabian, A.C. 1993, MNRAS, 261, 74
- (79) Savage, B.D. & Mathis, J.S. 1979, ARA&A, 17, 73
- (80) Schmitt, H.R. & Kinney, A.L. 1996, ApJ, 463, 498
- (81) Schmitt, H.R. 1998, ApJ, 506, 647
- (82) Schwarz, H.E. & Melnick, J. 1993, The ESO Users Manual, p.24
- (83) Snedden, S.A. & Gaskell, C.M. 2004, BAAS, 204.4404
- (84) Storey, P.J. & Hummer, D.G. 1995, MNRAS, 272, 41
- (85) Sun, W.-H. & Malkan, M.A. 1989, ApJ, 346, 68
- (86) Telfer, R.C., et al. 2002, ApJ, 565, 773
- (87) Turner, T.J., et al. 2002, ApJ, 568, 120
- (88) Vaughan, S., Reeves, J., Warwick, R., & Edelson, R. 1999, MNRAS, 309,113
- (89) Veilleux, S. & Osterbrock, D.E. 1987, ApJS, 63, 295
- (90) Véron-Cetty, M.-P., Joly, M., & Véron, P. 2004, A&A, 417, 515
- (91) Véron, P., Lindblad, P.O., Zuiderwijk, E.J., Véron, M.-P., & Adam, G. 1980, A&A, 87, 245
- (92) Véron, P., Véron, M.-P., & , Zuiderwijk, E.J. 1981b, A&A, 102, 116
- (93) Véron, P., Véron, M.-P., Bergeron, J., & , Zuiderwijk, E.J. 1981a, A&A, 97, 71
- (94) Véron-Cetty, M.-P., Véron, P., & Gonçalves, A.C. 2001, A&A, 372, 730
- (95) Wandel, A. 1999a, ApJ, 527, 649
- (96) Wandel, A. 1999b, ApJ, 527, 657
- (97) Wang, J.-M. & Netzer, H. 2003, A&A, 398, 927
- (98) Whittle, M. 1985a, MNRAS, 213, 1
- (99) Whittle, M. 1985b, MNRAS, 216, 817
- (100) Wills, B.J. 1982, IAU-Symp. 97, 373
- (101) Wills, B.J., Netzer, H., Brotherton, M.S., Mingsheng, H., Wills, D., Baldwin, J.A., Ferland, G.J., & Browne, I.W.A. 1993a, ApJ, 410, 534
- (102) Wills, B.J., Brotherton, M.S., Fang, D., Steidel, C.C., & Sargent, W.L.W. 1993b, ApJ, 415, 563
- (103) Zdziarski, A.A., Poutanen, J., Paciesas, W.S., & Wen, L. 2002, ApJ, 578, 357
- (104) Zheng, W., Kriss, G.A., & Davidsen, A.F. 1995, ApJ, 440, 606
- (105) Zheng, W., et al. 1997, ApJ, 475, 469
- (106) Zheng, W. & O’Brien, P.T. 1990, ApJ, 353, 433
![[Uncaptioned image]](/html/astro-ph/0501483/assets/x3.png)
![[Uncaptioned image]](/html/astro-ph/0501483/assets/x4.png)
Fig. 1 cont.
![[Uncaptioned image]](/html/astro-ph/0501483/assets/x6.png)
Fig. 2 cont.
| object | RA a | DEC a | mv | z b | c | d |
|---|---|---|---|---|---|---|
| (1) | (2) | (3) | (4) | (5) | (6) | (7) |
| Mkn 705 | 09 26 03.3 | 12 44 03 | 14.60 | 0.028 | 0.058 | |
| Mkn 1239 | 09 52 19.1 | 01 36 44 | 14.49 | 0.019 | 0.067 | |
| Mkn 734 | 11 21 47.1 | 11 44 19 | 14.93 | 0.049 | 0.048 | |
| NGC 4748 | 12 52 12.4 | 13 24 53 | 14.03 | 0.014 | 0.061 | |
| Mkn 783 | 13 02 58.9 | 16 24 28 | 15.55 | 0.067 | 0.033 | |
| IRAS 13224-3809 | 13 25 19.2 | 38 24 54 | 13.80 | 0.065 | 0.080 | |
| CTS J13.12 | 13 51 29.4 | 18 13 47 | 15.50 | 0.012 | 0.129 | |
| IRAS 15091-2107 | 15 11 59.8 | 21 19 02 | 14.83 | 0.044 | 0.142 | |
| Mkn 291 | 15 55 08.0 | 19 11 33 | 15.51 | 0.035 | 0.058 | |
| RXS J20002-5417 | 20 00 15.4 | 54 17 12 | 16.50 | 0.061 | 0.084 | |
| ESO 399-IG20 | 20 06 58.1 | 34 32 55 | 14.51 | 0.025 | 0.118 | |
| Mkn 896 | 20 46 20.8 | 02 48 45 | 14.61 | 0.027 | 0.083 |
(1: Boller et al. 1996; 2: Pfefferkorn et al. 2001).
| object | a | Hubble-type b | rel.Fgal c | EB-V d | EB-V d |
|---|---|---|---|---|---|
| NLR | BLR | ||||
| (1) | (2) | (3) | (4) | (5) | (6) |
| Mkn 705 | +0.25 | S0 | 51 % | 0.01 | 0.05 |
| Mkn 1239 | -0.90 | Sb | 48 % | 0.84 | 0.32 |
| Mkn 734 | -0.20 | S0 | 27 % | 0.66 | 0.07 |
| NGC 4748 | +0.80 | Sb | 56 % | 0.48 | 0.06 |
| Mkn 783 | -0.75 | S0 | 23 % | 0.54 | 0.22 |
| IRAS 13224-3809 | -0.80 | Sb | 45 % | 0.46 | 0.11 |
| CTS J13.12 | -0.20 | E | 56 % | 0.25 | 0.23 |
| IRAS 15091-2107 | -1.40 | Sb | 42 % | 1.01 | 0.54 |
| Mkn 291 | 0.00 | Sa | 47 % | 0.40 | 0.00 |
| RXS J20002-5417 | +1.90 | S0 | 38 % | -0.06 e | -0.26 e |
| ESO 399-IG20 | -0.80 | S0 | 51 % | 0.05 | 0.00 |
| Mkn 896 | -1.15 | E | 46 % | 0.99 | 0.20 |
| object | FWHM(H) a | FWZI(H) a | FWHM(He ii) a | ||||
|---|---|---|---|---|---|---|---|
| broad | interm. | narrow | broad | interm. | narrow | ||
| (1) | (2) | (3) | (4) | (5) | (6) | (7) | (8) |
| Mkn 705 | |||||||
| Mkn 1239 | |||||||
| Mkn 734 | |||||||
| NGC 4748 | |||||||
| Mkn 783 | |||||||
| IRAS 13224-3809 | |||||||
| CTS J13.12 | |||||||
| IRAS 15091-2107 | |||||||
| Mkn 291 | |||||||
| RXS J20002-5417 | |||||||
| ESO 399-IG20 | |||||||
| Mkn 896 |
| object | H | H | He ii | He ii | H | H | He i |
|---|---|---|---|---|---|---|---|
| broad | interm. | broad | interm. | total | total | total | |
| (1) | (2) | (3) | (4) | (5) | (6) | (7) | (8) |
| Mkn 705 | |||||||
| Mkn 1239 | |||||||
| Mkn 734 | |||||||
| NGC 4748 | |||||||
| Mkn 783 | |||||||
| IRAS 13224-3809 | |||||||
| CTS J13.12 | |||||||
| IRAS 15091-2107 | |||||||
| Mkn 291 | |||||||
| RXS J20002-5417 | |||||||
| ESO 399-IG20 | |||||||
| Mkn 896 |
| line | Mkn705 | Mkn1239 | Mkn734 | |||
|---|---|---|---|---|---|---|
| obs. | corr. | obs. | corr. | obs. | corr. | |
| (1) | (2) | (3) | (4) | (5) | (6) | (7) |
| [Ne v]3346 | ||||||
| [Ne v]3426 | ||||||
| [Fe vii]3588 | ||||||
| [O ii]3727 | ||||||
| [Fe vii]3760 | ||||||
| [Ne iii]3869 | ||||||
| HeI3889 | ||||||
| H3888 | ||||||
| [Ne iii]3968 | ||||||
| H3970 | ||||||
| [S ii]4072 | ||||||
| H 4101 | ||||||
| H 4340 | ||||||
| [O iii]4363 | ||||||
| HeI4471 | ||||||
| HeII4686 | ||||||
| H 4861 | ||||||
| [O iii]4959 | ||||||
| [O iii]5007 | ||||||
| [Fe vii]5159 | ||||||
| [Fe vi]5176 | ||||||
| [N i]5199 | ||||||
| [Fe vii]5278 | ||||||
| [Fe vii]5283 | ||||||
| [Fe xiv]5307 | ||||||
| [Ca v]5309 | ||||||
| [Fe vii]5721 | ||||||
| [N ii]5755 | ||||||
| HeI5876 | ||||||
| [Fe vii]6087 | ||||||
| [O i]6300 | ||||||
| [S iii]6312 | ||||||
| [O i]6364 | ||||||
| [Fe x]6374 | ||||||
| [N ii]6548 | ||||||
| H 6563 | ||||||
| [N ii]6583 | ||||||
| HeI6678 | ||||||
| [S ii]6716 | ||||||
| [S ii]6731 | ||||||
| line | NGC4748 | Mkn783 | IRAS13224-3809 | |||
|---|---|---|---|---|---|---|
| obs. | corr. | obs. | corr. | obs. | corr. | |
| (1) | (2) | (3) | (4) | (5) | (6) | (7) |
| [Ne v]3346 | ||||||
| [Ne v]3426 | ||||||
| [Fe vii]3588 | ||||||
| [O ii]3727 | ||||||
| [Fe vii]3760 | ||||||
| [Ne iii]3869 | ||||||
| HeI3889 | ||||||
| H3888 | ||||||
| [Ne iii]3968 | ||||||
| H3970 | ||||||
| [S ii]4072 | ||||||
| H 4101 | ||||||
| H 4340 | ||||||
| [O iii]4363 | ||||||
| HeI4471 | ||||||
| HeII4686 | ||||||
| H 4861 | ||||||
| [O iii]4959 | ||||||
| [O iii]5007 | ||||||
| [Fe vii]5159 | ||||||
| [Fe vi]5176 | ||||||
| [N i]5199 | ||||||
| [Fe vii]5278 | ||||||
| [Fe vii]5283 | ||||||
| [Fe xiv]5307 | ||||||
| [Ca v]5309 | ||||||
| [Fe vii]5721 | ||||||
| [N ii]5755 | ||||||
| HeI5876 | ||||||
| [Fe vii]6087 | ||||||
| [O i]6300 | ||||||
| [S iii]6312 | ||||||
| [O i]6364 | ||||||
| [Fe x]6374 | ||||||
| [N ii]6548 | ||||||
| H 6563 | ||||||
| [N ii]6583 | ||||||
| HeI6678 | ||||||
| [S ii]6716 | ||||||
| [S ii]6731 | ||||||
| line | CTS J13.12 | IRAS15091-2107 | Mkn291 | |||
|---|---|---|---|---|---|---|
| obs. | corr. | obs. | corr. | obs. | corr. | |
| (1) | (2) | (3) | (4) | (5) | (6) | (7) |
| [Ne v]3346 | ||||||
| [Ne v]3426 | ||||||
| [Fe vii]3588 | ||||||
| [O ii]3727 | ||||||
| [Fe vii]3760 | ||||||
| [Ne iii]3869 | ||||||
| HeI3889 | ||||||
| H3888 | ||||||
| [Ne iii]3968 | ||||||
| H3970 | ||||||
| [S ii]4072 | ||||||
| H 4101 | ||||||
| H 4340 | ||||||
| [O iii]4363 | ||||||
| HeI4471 | ||||||
| HeII4686 | ||||||
| H 4861 | ||||||
| [O iii]4959 | ||||||
| [O iii]5007 | ||||||
| [Fe vii]5159 | ||||||
| [Fe vi]5176 | ||||||
| [N i]5199 | ||||||
| [Fe vii]5278 | ||||||
| [Fe vii]5283 | ||||||
| [Fe xiv]5307 | ||||||
| [Ca v]5309 | ||||||
| [Fe vii]5721 | ||||||
| [N ii]5755 | ||||||
| HeI5876 | ||||||
| [Fe vii]6087 | ||||||
| [O i]6300 | ||||||
| [S iii]6312 | ||||||
| [O i]6364 | ||||||
| [Fe x]6374 | ||||||
| [N ii]6548 | ||||||
| H 6563 | ||||||
| [N ii]6583 | ||||||
| HeI6678 | ||||||
| [S ii]6716 | ||||||
| [S ii]6731 | ||||||
| line | RXS J20002-5417 | ESO 399-IG20 | Mkn896 | |||
|---|---|---|---|---|---|---|
| obs. | corr. | obs. | corr. | obs. | corr. | |
| (1) | (2) | (3) | (4) | (5) | (6) | (7) |
| [Ne v]3346 | ||||||
| [Ne v]3426 | ||||||
| [Fe vii]3588 | ||||||
| [O ii]3727 | ||||||
| [Fe vii]3760 | ||||||
| [Ne iii]3869 | ||||||
| HeI3889 | ||||||
| H3888 | ||||||
| [Ne iii]3968 | ||||||
| H3970 | ||||||
| [S ii]4072 | ||||||
| H 4101 | ||||||
| H 4340 | ||||||
| [O iii]4363 | ||||||
| HeI4471 | ||||||
| HeII4686 | ||||||
| H 4861 | ||||||
| [O iii]4959 | ||||||
| [O iii]5007 | ||||||
| [Fe vii]5159 | ||||||
| [Fe vi]5176 | ||||||
| [N i]5199 | ||||||
| [Fe vii]5278 | ||||||
| [Fe vii]5283 | ||||||
| [Fe xiv]5307 | ||||||
| [Ca v]5309 | ||||||
| [Fe vii]5721 | ||||||
| [N ii]5755 | ||||||
| HeI5876 | ||||||
| [Fe vii]6087 | ||||||
| [O i]6300 | ||||||
| [S iii]6312 | ||||||
| [O i]6364 | ||||||
| [Fe x]6374 | ||||||
| [N ii]6548 | ||||||
| H 6563 | ||||||
| [N ii]6583 | ||||||
| HeI6678 | ||||||
| [S ii]6716 | ||||||
| [S ii]6731 | ||||||
| object | Wλ(H) | Wλ(H) | Wλ(H) | Wλ(H) | Wλ(H) |
|---|---|---|---|---|---|
| (1) | (2) | (3) | (4) | (5) | (6) |
| Mkn 705 | |||||
| Mkn 1239 | |||||
| Mkn 734 | |||||
| NGC 4748 | |||||
| Mkn 783 | |||||
| IRAS 13224-3809 | |||||
| CTS J13.12 | |||||
| IRAS 15091-2107 | |||||
| Mkn 291 | |||||
| RXS J20002-5417 | |||||
| ESO 399-IG20 | |||||
| Mkn 896 |