CO(1-0) & CO(5-4) observations of the most distant known radio galaxy at
Abstract
Using the Australia Telescope Compact Array we have detected CO (1-0) and CO (5-4) from TN J0924–2201 at , the most distant radio galaxy known to date. This is the second highest redshift detection of CO published so far. The CO (1-0) is km s-1 wide with a peak flux density of Jy beam-1 whilst the CO (5-4) line emission is km s-1 wide with a peak flux density of mJy beam-1. Both transitions are spatially unresolved but there is marginal evidence for spatial offsets between the CO and the host galaxy; the CO (1-0) is located kpc () north of the radio galaxy whilst the CO (5-4) is located kpc () south of the radio galaxy. Higher spatial resolution observations are required to determine the reality of these offsets. Our result is the second detection of CO in a high redshift galaxy without pre-selection based on a massive dust content.
1 Introduction
Right out to the highest redshifts so far identified, radio galaxies are the most massive systems at each epoch. They reside in regions of over-density (Le Fevre et al., 1996; Carilli et al., 1997; Pascarelle et al., 1998; Pentericci et al., 2000), corroborating evolutionary models which trace high redshift radio galaxies (; HzRGs) through to nearby central dominant elliptical galaxies in cluster-type environments (e.g. Lilly &
Longair, 1984). Unlike their nearby counterparts, however, HzRGs are not massive ellipticals with old stellar populations. Instead, their rest-frame optical/UV morphologies are composed of multiple blobs of clumpy emission often aligned along the axis of relativistic jets (van Breugel et al., 1998; Pentericci
et al., 1999). Rest frame far infra-red observations are strongly suggestive of large-scale, massive, dust-obscured star formation (Stevens et al., 2003). Furthermore, HzRGS are often enshrouded by massive gas reservoirs which extend over tens of kpc, traced both by Lyman- halos (McCarthy
et al., 1990; Villar-Martín
et al., 2003) and by carbon monoxide (CO ) line emission (Papadopoulos
et al., 2000; De Breuck
et al., 2003). Each of these properties is consistent with the scenario where the galaxies are being observed in their formative stages. It is essential, therefore, that the characteristics of the HzRG population are investigated in detail in order to further our understanding of galaxy, and cluster, formation and evolution.
In this Letter we report the detection of molecular gas at in TN J0924–2201, the highest redshift radio galaxy and the second highest redshift CO detection to date, after the quasar SDSS J1148+5251 (Fan et al., 2003; Walter et al., 2003). Where necessary we use a flat -dominated cosmology with km s-1 Mpc-1 and (Spergel
et al., 2003). In this cosmology, kpc at .
2 TN J0924–2201: selection & characteristics
TN J0924–2201 was initially discovered (De Breuck et al., 2000) from radio surveys using the well established technique for finding HzRGs of selecting ultra-steep spectrum sources with faint K-band counterparts (e.g. Chambers et al., 1996; Blundell et al., 1998). Follow-up optical spectroscopy detected faint Lyman- emission from the host galaxy at a redshift of (van Breugel et al., 1999; Venemans et al., 2004). Based on its compact () radio morphology, under-luminous Lyman- emission compared with other HzRGs and rest frame 350 nm emission composed of several clumpy optical features, it was suggested that TN J0924–2201 is a young, primeval galaxy actively forming the bulk of its stars (van Breugel et al., 1999). We initially chose TN J0924–2201 as a candidate for CO observations because, as the most distant known member of a sample of HzRGs, it is presumably one of the youngest (Blundell &
Rawlings, 1999). The existence of molecular gas would provide independent evidence for ongoing massive star formation, expected if we are probing its formation epoch. The southern declination () of this source makes observations from millimetre telescopes in the northern hemisphere difficult, and its redshift moves all CO transitions out of any Very Large Array (VLA) band. We used the new wide bandwidth 1.2 cm and 3 mm receivers on the Australia Telescope Compact Array (ATCA) to search for CO (1-0) and CO (5-4) with GHz and GHz, respectively.
3 ATCA Observations
Observations were carried out with the ATCA during 2004 August and September. The ATCA is an array of six 22-m antennas with baselines ranging from 30 m to 6 km and capable of East-West, North-South and Hybrid array configurations. We utilised the maximum available bandwidth of the current correlator with 128 MHz/64 channel configurations for two adjacent IF bands. The spectral resolution of this configuration is 4.4 MHz. For the CO (1-0) observations, we used the hybrid H 168 array111The size of the naturally weighted restoring beam in the H 168 array at 18.6 GHz is , or kpc., tuning the IFs to 18.561 and 18.631 GHz respectively, allowing an overlap region (after bandpass correction) of 20 MHz. This setup benefited from a simultaneous velocity coverage of km s-1 and resolution of 72 km s-1 . System temperatures ranged from 30–50 K and phase stability was within over the course of the observations. Phase, amplitude, bandpass and astrometric calibration were acquired by short observations of PKS B0919–260 every 12–25 minutes depending on the weather. Absolute flux density calibration was ensured by snapshot observations of Mars. We estimate the calibration to be accurate to better than .
The observational setup was repeated in the H 75 array222The size of the naturally weighted restoring beam in the H 75 array at 92.8 GHz is , or kpc. with the IFs tuned to 92.853 and 92.921 GHz respectively for the CO (5-4) transition. System temperatures (measured once per hour using a 300 K mechanical paddle moved over the feedhorn) ranged from 200–350 K and phase stability was mostly within over the course of the observations. Phase and amplitude calibration were based on observations of PKS B0834–201 every 12 minutes and the bandpass was determined by 10 minute observations of either PKS B1253–055 or PKS B0537–441. The rms error in the pointing ranged from depending on the antenna (the primary beam at 93 GHz is ). We periodically observed the 0.5 Jy quasar PKS B0925–203, less than from TN J0924–2201, to verify the calibration and astrometry. We estimate the flux scale to be accurate to better than . Data reduction was carried out in accordance with standard ATCA calibration procedures for millimetre observing333http://www.atnf.csiro.au/computing/miriad. Overall, hours and hours of observing time were employed at 18.6 GHz and 92.9 GHz respectively to carry out this detection experiment. Table 1 gives a summary of our results.
4 Results
4.1 CO (1-0)
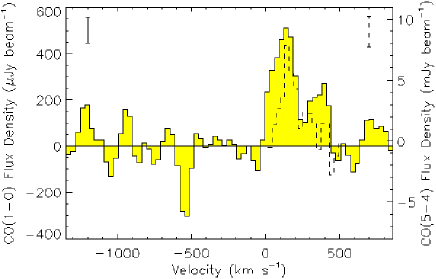
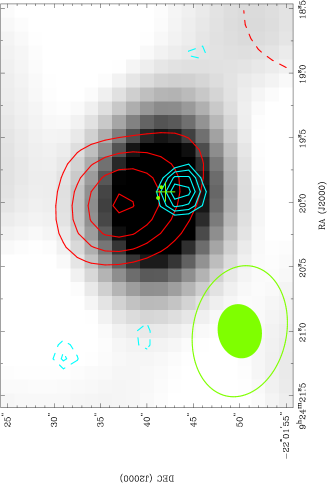
The CO (1-0) line is detected in at least five independent channels covering km s-1 and shown in Figure 1. We subtracted a 0.71 mJy continuum in the UV plane using a first order spectral baseline fit. The continuum image is shown in greyscale in Figure 2. The velocity-integrated, continuum-subtracted, flux density is Jy beam-1 km s-1 and the corresponding intrinsic CO line luminosity is K km s-1pc2. There are two kinematic features apparent in the spectrum: the brighter, dominant, emission centred at km s-1 () and a weaker feature lying km s-1 redward. Deeper observations are required to determine if the weaker feature is real. As commonly observed, the CO lies redward of the Lyman- derived redshift (see Table 1 in Klamer et al., 2004). There is no conclusive evidence for spatially extended gas, but the velocity-integrated emission (Figure 2) appears to be offset to the north of the radio galaxy by ( kpc). At this stage we do not consider this offset to be significant, since it is much less than a beam size away from the radio galaxy position. For comparison, the position angle of the projected radio axis is (see Figure 2). Deeper observations with higher spatial resolution are required to better constrain the spatial extent of this gas.
4.2 CO (5-4)
At 93 GHz our instantaneous velocity coverage was only km s-1 with a spectral resolution of 15 km s-1 . The resultant spectrum is shown in Figure 1 and the emission profile integrated from 0 to 300 km s-1 is shown in Figure 2. Although the zero level in the profile is well determined from offset positions in the image, our bandwidth is only marginally wider than the line width, so we have to consider the possibility of a spectral baseline offset due to continuum emission from the radio galaxy. However, the flux density we observe is more than 100 times that expected from the continuum. This is illustrated by the radio to sub-millimetre spectral energy distribution shown in Figure 3. Extrapolating the non-thermal synchrotron spectrum with a spectral index of , we expect a contribution of mJy whilst extrapolating from the 352 GHz SCUBA limit assuming a modified blackbody spectrum with and T=50 K, the expected contribution due to thermal dust radiation is mJy. The most likely source of the 93 GHz emission is therefore the redshifted CO (5-4) transition at . The velocity-integrated flux density is Jy beam-1 km s-1 , corresponding to K km s-1 pc2. Again, the emission appears offset from the radio galaxy position, the peak lying ( kpc) south. Again, the positional offset is less than a beam size. Deeper observations are required to constrain the spatial extent of the molecular gas, including whether there are physically distinct gas emitting regions.
5 Physical properties of the molecular gas
5.1 Mass Estimates
CO observations are translated into total H2 mass estimates, assuming that the observed CO traces molecular clouds on large scales and that the molecular gas mass dominates the total dynamical mass of the galaxy. These mass estimates are uncertain at best, but to facilitate comparison with observations from other HzRGs, we assume M M⊙ (K km s-1 pc2)-1 as measured for nearby ultraluminous infra-red galaxies (Downes & Solomon, 1998). Since molecular clouds provide both the fuel and the site for the next generation of star formation, our result implies that there is M⊙ of available gas from which to manufacture the next stellar generation. This estimate is consistent with M estimates of other HzRGs like 4C 60.07 (Greve et al., 2004; Papadopoulos et al., 2000) and B3 J2330+3927 (De Breuck et al., 2003). There is no direct evidence to indicate that TN J0924–2201 is gravitationally lensed. However, if lensing is important then , and hence M, are upper limits only.
5.2 Temperature and Density from LVG modelling
The ratio of the peak flux densities would be equal to the square of the ratio of the upper transition levels (1/25) in the event that both lines are optically thick and thermally excited. Under the assumption of optically thick gas, the ratio we measure is 1/(), which suggests the CO (5-4) transition is sub-thermal; however, the errors are large. We have used a standard single-component large velocity gradient (LVG) code, with a typical CO-to-H2 abundance X[CO]/(dv/dr)= (km s-1 )-1 pc, to further constrain the physical properties of the molecular gas. A good match to the observations is given by log(n(H (where n(H2) is measured in units of cm-3), T K and r kpc, but other density/temperature combinations are also consistent with the observed fluxes (see Figure 4). Observations of CO transitions higher than CO (5-4) are required to constrain the excitation conditions of the gas. If the observed offsets between the CO (1-0) and CO (5-4) transitions reflect physically distinct CO emitting regions, then the excitation conditions presented here become invalid.
5.3 Where is the dust?
At present, the most efficient technique for detecting high redshift molecular gas is to pre-select the dustiest objects, as determined from their large rest frame far-infra red luminosities using (sub)millimetre sensitive instruments like SCUBA on the JCMT or MAMBO on the IRAM 30m telescope. This also means that current samples are biased towards objects with the largest dust-to-gas ratios ( L⊙ K-1 km-1 s pc-2; Carilli et al., 2004). For comparison, the median ratio is 160 for nearby ultra-luminous infra red galaxies with L⊙ (Solomon et al., 1997) and about 50 for nearby luminous infra red galaxies with L⊙ L⊙ (Gao &
Solomon, 2004). The selection bias at high redshift is further compounded by the fact that initial CO detections are usually made in order lines, which prejudices the sample against regions of low density molecular gas where the higher order transitions are sub-thermally excited.
Five of the six published CO detections of HzRGs constitute the most FIR-luminous radio galaxies recently surveyed with SCUBA (Reuland et al., 2004). In this sample, approximately 50% of the 24 observed galaxies were not detected; TN J0924–2201 featured amongst these non-detections with W Hz-1, five times underluminous compared to the CO detected HzRGs in the sample. Therefore, TN J0924–2201 will have a dust-to-gas ratio at least five times smaller than the current sample of high redshift galaxies, similar to the nearby luminous infra-red galaxy population. The only other CO emitter at high redshift not selected on the basis of FIR emission — that we are aware of — is 53W002 at (Yamada et al., 1995; Scoville et al., 1997; Alloin et al., 2000). This source has a upper limit of 4.3 mJy at 850m (Archibald et al., 2001), corresponding to W Hz-1. An a posteriori detection of the dust content in 53W002 ( mJy at 1.3 mm; Alloin et al., 2000) suggests that a similar observation of TN J0924–2201 may also reveal its dust content. Thus 53W002 and TN J0924–2201 may be representative of a population of high redshift sources which remain undetected due to current selection techniques.
6 The co-evolution of a central Dominant and a protocluster
At the universe is only about a billion years old — time enough, however, to build a supermassive black hole, trigger powerful radio jets and produce a stellar population capable of enriching the interstellar medium with M⊙ of CO (assuming an abundance of CO relative to H2 of ). This rapid enrichment could be facilitated in part by the powerful radio jets themselves propagating into overdensities in the primordial gas, and shock-inducing massive star formation (Klamer et al., 2004; Bicknell et al., 2000).
Venemans et al. (2004) recently postulated that TN J0924–2201 resides within a protocluster environment after discovering six Lyman- emitters in a field ( Mpc) around the radio galaxy — the typical scale size for nearby rich clusters (Abell, 1958). Our CO observations substantiate a five-year old hypothesis that TN J0924–2201 is a young forming galaxy, potentially the primeval central dominant galaxy of a rich cluster. Thus it seems that cDs may form with their host environments from the earliest times in the Universe.
References
- Abell (1958) Abell G. O., 1958, ApJS, 3, 211
- Alloin et al. (2000) Alloin D., Barvainis R., Guilloteau S., 2000, ApJ, 528, L81
- Archibald et al. (2001) Archibald E. N., Dunlop J. S., Hughes D. H., Rawlings S., Eales S. A., Ivison R. J., 2001, MNRAS, 323, 417
- Bicknell et al. (2000) Bicknell G. V., Sutherland R. S., van Breugel W. J. M., Dopita M. A., Dey A., Miley G. K., 2000, ApJ, 540, 678
- Blundell & Rawlings (1999) Blundell K. M., Rawlings S., 1999, Nature, 399, 330
- Blundell et al. (1998) Blundell K. M., Rawlings S., Eales S. A., Taylor G. B., Bradley A. D., 1998, MNRAS, 295, 265
- Carilli et al. (2004) Carilli C. L., Bertoldi F., Walter F., Menten K. M., Beelen A., Cox P., Omont A., 2004, astro-ph/0402573
- Carilli et al. (1997) Carilli C. L., Röttgering H. J. A., van Ojik R., Miley G. K., van Breugel W. J. M., 1997, ApJS, 109, 1
- Chambers et al. (1996) Chambers K. C., Miley G. K., van Breugel W. J. M., Bremer M. A. R., Huang J.-S., Trentham N. A., 1996, ApJS, 106, 247
- De Breuck et al. (2003) De Breuck C., et al. 2003, A&A, 401, 911
- De Breuck et al. (2000) De Breuck C., van Breugel W., Röttgering H. J. A., Miley G., 2000, A&AS, 143, 303
- Downes & Solomon (1998) Downes D., Solomon P. M., 1998, ApJ, 507, 615
- Fan et al. (2003) Fan X., et al. 2003, AJ, 125, 1649
- Gao & Solomon (2004) Gao Y., Solomon P. M., 2004, ApJ, 606, 271
- Greve et al. (2004) Greve T. R., Ivison R. J., Papadopoulos P. P., 2004, A&A, 419, 99
- Klamer et al. (2004) Klamer I. J., Ekers R. D., Sadler E. M., Hunstead R. W., 2004, ApJ, 612, L97
- Le Fevre et al. (1996) Le Fevre O., Deltorn J. M., Crampton D., Dickinson M., 1996, ApJ, 471, L11
- Lilly & Longair (1984) Lilly S. J., Longair M. S., 1984, MNRAS, 211, 833
- McCarthy et al. (1990) McCarthy P. J., Spinrad H., Dickinson M., van Breugel W., Liebert J., Djorgovski S., Eisenhardt P., 1990, ApJ, 365, 487
- Papadopoulos et al. (2000) Papadopoulos P. P., Röttgering H. J. A., van der Werf P. P., Guilloteau S., Omont A., van Breugel W. J. M., Tilanus R. P. J., 2000, ApJ, 528, 626
- Pascarelle et al. (1998) Pascarelle S. M., Windhorst R. A., Keel W. C., 1998, AJ, 116, 2659
- Pentericci et al. (2000) Pentericci L., et al. 2000, A&A, 361, L25
- Pentericci et al. (1999) Pentericci L., Röttgering H. J. A., Miley G. K., McCarthy P., Spinrad H., van Breugel W. J. M., Macchetto F., 1999, A&A, 341, 329
- Reuland et al. (2004) Reuland M., Röttgering H., van Breugel W., De Breuck C., 2004, MNRAS, 353, 377
- Scoville et al. (1997) Scoville N. Z., Yun M. S., Windhorst R. A., Keel W. C., Armus L., 1997, ApJ, 485, L21
- Solomon et al. (1997) Solomon P. M., Downes D., Radford S. J. E., Barrett J. W., 1997, ApJ, 478, 144
- Spergel et al. (2003) Spergel D. N., et al. 2003, ApJS, 148, 175
- Stevens et al. (2003) Stevens J. A., et al. 2003, Nature, 425, 264
- van Breugel et al. (1999) van Breugel W., De Breuck C., Stanford S. A., Stern D., Röttgering H., Miley G., 1999, ApJ, 518, L61
- van Breugel et al. (1998) van Breugel W. J. M., Stanford S. A., Spinrad H., Stern D., Graham J. R., 1998, ApJ, 502, 614
- Venemans et al. (2004) Venemans B. P., et al. 2004, A&A, 424, L17
- Villar-Martín et al. (2003) Villar-Martín M., Vernet J., di Serego Alighieri S., Fosbury R., Humphrey A., Pentericci L., 2003, MNRAS, 346, 273
- Walter et al. (2003) Walter F., et al. 2003, Nature, 424, 406
- Yamada et al. (1995) Yamada T., Ohta K., Tomita A., Takata T., 1995, AJ, 110, 1564


| 18.6 GHz | CO (1-0) | CO (5-4) | |
|---|---|---|---|
| continuum | line | line | |
| Peak (mJy beam-1) | |||
| Width (km s-1 ) | aafootnotemark: | ||
| (Jy km s-1 ) | aafootnotemark: | ||
| RAJ2000 ()bbfootnotemark: | |||
| DECJ2000()bbfootnotemark: |
Note. — aThe weaker feature in the CO (1-0) spectrum has not been included in this measurement because within the 300-400 km s-1 velocity range, there are several other similar features in the image which decrease its significance. If this feature were included the velocity-integrated flux density of the CO (1-0) emission would be Jy km s-1 .bThese positions are offsets from high resolution VLA observations: RA, DEC (van Breugel et al., 1999). Positive offsets are North and East of the radio galaxy position.