What controls the [O iii] 5007 line strength in active galactic nuclei?
Abstract
Active galactic nuclei (AGN) display an extreme range in the narrow emission line equivalent widths. Specifically, in the PG quasar sample the equivalent width of the narrow [O iii] 5007 line has a range of (Å to 157Å), while the broad H line, for example, has a range of ten only (23Å to 230Å). The strength of [O iii] 5007 is modulated by the covering factor (CF) of the narrow line region (NLR) gas, its density (), and ionization parameter (). To explore which of these factors produces the observed large range in [O iii] 5007 strength, we measure the strength of the matching narrow H and [O iii] 4363 lines, detected in 40 out of the 87 PG quasars in the Boroson & Green sample. The photoionization code CLOUDY is then used to infer CF, , and in each object, assuming a single uniform emitting zone. We find that the range of CF () contributes about twice as much as the range in both and towards modulating the strength of the [O iii] 5007 line. The CF is inversely correlated with luminosity, but it is not correlated with as previously speculated. The single zone [O iii] 5007 emitting region is rather compact, having pc. These emission lines can also be fit with an extreme two zone model, where [O iii] 4363 is mostly emitted by a dense ( cm-3) inner zone at pc, and [O iii] 5007 by a low density ( cm-3) extended outer zone at pc. Such an extended [O iii] 5007 emission should be well resolved by Hubble Space Telescope imaging of luminous AGN. Further constraints on the radial gas distribution in the NLR can be obtained from the spectral shape of the IR continuum emitted by the associated dust.
keywords:
galaxies: active – quasars: emission lines – quasars: general.1 Introduction
Active galactic nuclei (AGN) can show both broad (FWHM km s-1) and narrow (FWHM km s-1) emission lines. While both lines are excited by the central ionizing continuum source, the broad lines arise from the immediate vicinity of the central massive black hole ( pc), and the narrow lines arise further out, sampling the host galaxy dynamics, and possibly chemical composition and gas distribution as well. The strength and profiles of the narrow emission lines were studied extensively over the past 30 years, revealing radial gradients in the density and ionization state of the gas, and some characteristic trends in the line profiles (e.g. Heckman et al. 1981; Osterbrock 1989; Peterson 1997; Vanden Berk et al. 2001).
One remarkable property of the narrow emission lines, which has not been explored yet in detail, is their extreme range of equivalent widths (EWs). Specifically, in the Boroson & Green (1992, hereafter BG92) sample of 87 quasars from the bright quasar survey (Schmidt & Green 1983), the narrow [O iii] 5007 line ranges in EW from 157 Å to undetectable ( Å), i.e. by a factor of , while in contrast the EW of the broad H line in the same sample ranges only over a factor of 10 (23 – 230 Å). The narrow line EW is mainly set by two factors, the covering factor (CF) of the photoionized gas at the narrow line region (NLR), and the line emissivity (assuming no foreground absorption). The CF is set by the spatial distribution of the gas at the NLR, and by the angular distribution of the illuminating ionizing radiation. The latter may be set by the continuum emission mechanism, or through obscuration further out (e.g. by the ‘torus’). The line emissivity for collisionaly excited lines, such as [O iii] 5007, is set by the gas electron density , the gas temperature, and by the gas ionization state. The last two properties are set by the ionizing photon flux, or equivalently the ionization parameter (, where is the density of H ionizing photons). Which of the above factors produces the large range in EWs of the narrow emission lines?
The purpose of this paper is to answer this question for the [O iii] 5007 line. We have chosen this line since it is generally the strongest and least blended narrow emission line in AGN. Our approach is to measure the strength of the narrow [O iii] 4363 and H lines in a large sample of AGN, where the [O iii] 5007 line was already measured. The [O iii] 4363/[O iii] 5007 line ratio is mainly a measure of , while the H line is dominated by recombination and thus mostly sensitive to the CF of the gas. The combination of the three lines allows us to determine the CF, , and of the [O iii] 5007 emitting gas, and thus find which factor most strongly modulates the strength of the line. This derivation relies on the simplifying assumption that H, [O iii] 5007, and [O iii] 4363 originate in a single zone with homogeneous gas properties. We relax this assumption by also making an extreme two zone approximation, where [O iii] 5007 is mostly emitted by an outer low density NLR component, and [O iii] 4363 by an inner high density component, and again explore whether the strength of the [O iii] 5007 line is mostly modulated by the CF or by the gas emissivity.
The [O iii] 5007 line is one of the main components contributing to the set of strongly correlated AGN emission properties, so called ‘eigenvector 1’ (hereafter EV1, BG92). We therefore also briefly explore whether the physical parameters controlling the strength of [O iii] 5007 are linked to other EV1 emission properties. The determination of and allows us to calculate the distance of the NLR from the central ionizing continuum source, , and we also look for relations between and other AGN properties. The paper is organized as follows, in Section 2 we provide a brief theoretical justification for the set of lines used in this analysis, and explain how the NLR parameters are derived. In Section 3 we describe the sample used and the narrow line measurement procedure. The results are described and discussed in Section 4, and the main conclusions are provided in Section 5.
2 Theoretical approach
The [O iii] 5007 and [O iii] 4363 lines are particularly useful for constraining and of the NLR gas which produces the [O iii] line emission. Both lines arise from the same element, eliminating abundance effects. Furthermore, they both arise from the same ionization state, eliminating ionization level corrections. Both lines arise through collisional excitation, and although they correspond to similar transition energy, they differ in two respects. First, [O iii] 5007 arises from excitation to the level, located 2.51 eV above the ground () level, while [O iii] 4363 arises from excitation to the level, 5.35 eV above the ground level. Thus, their ratio is a useful temperature diagnostic when eV. In addition, the two transitions have different radiative decay rates, leading to critical densities for collisional dexcitation of cm-3 for [O iii] 5007 and cm-3 for [O iii] 4363. Thus, the [O iii] 4363/[O iii] 5007 line ratio is also a useful density diagnostic, when the density is not much above or below the two critical densities (e.g. Osterbrock 1989). An additional advantage of the [O iii] 5007 line is that it is typically the main coolant of the NLR (amounting to as much as per cent of the total cooling), and thus its absolute intensity is only a weak function of the O abundance (through the metalicity dependence of the gas temperature).
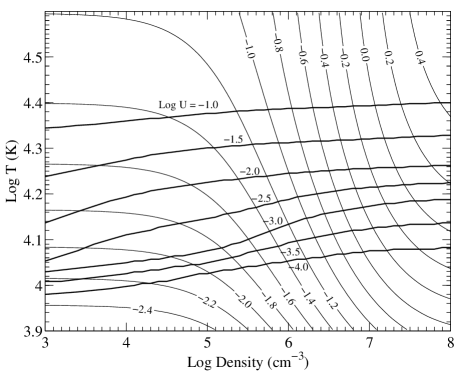
Figure 1 presents curves of constant log [O iii] 4363/[O iii] 5007 photon flux ratio as a function of the electron density and temperature. The calculations are based on a 6-levels [O iii] model (excitations to levels above the 6th level, , do not contribute significantly to the two [O iii] lines at the relevant temperatures). The level energies were obtained from Moore (1993, p. 267), and radiative transition probabilities and mean collision strengths from Pradhan & Peng (1995, table 1 there, for K, relevant here) 111Two collision strengths, (2S, 2S0) and (2S, 2D2), were not available, and we therefore assume are equal to 1.. The figure demonstrates the weaker dependence of the line ratio on at the lowest , and weaker dependence on as the highest .
In photoionized gas it is more natural to use , which is often a free parameter in photoionization calculations, rather than which is set by and through detailed photoionization calculations. Fig. 1 presents the dependence of on and , as deduced from the photoionization code CLOUDY (Ferland et al. 1998). It demonstrates the weak dependence of on , at a given , and the overall small range in (- K) when varies from to . Assuming a uniform gas, the measured value of [O iii] 4363/[O iii] 5007 (corresponding to a certain curve in Fig .1) yields the allowed range of as a function of the range in . E.g., if the measured line ratio is 0.1, then the implied density is to cm-3, for to . As can be seen in Fig. 1, the allowed range in increases as the line ratio gets smaller.
Breaking the , , degeneracy requires an additional line. The optimal line for that purpose is H. It is a nearly pure recombination line at the expected NLR conditions (where collisional and optical depth effects should be small), and thus its intensity provides an estimate of the fraction of ionizing radiation intercepted by the NLR, i.e. the NLR CF. The [O iii] 5007/H ratio provides the additional constraint on and , required to break the degeneracy. The H EW, together with the EW of [O iii] 5007, and [O iii] 4363, allow us to determine , , and the CF of the [O iii] emitting gas in the NLR. From the observational aspect the H line is also optimal, as it is located close to the two [O iii] lines, allowing all three lines to be obtained in a single spectrum, minimizing systematic measurement errors. Also, the close wavelength proximity of the lines minimizes dust reddening effects on the measured line ratios.
As noted above, we use the photoionization code CLOUDY to calculate the strength of [O iii] 5007, [O iii] 4363, and H, as a function of (from cm-3 to cm-3), (from to ), and the CF. The additional input model parameters for CLOUDY are a slab geometry with a total column of cm-2, ISM abundances with grains, and a standard Mathews & Ferland (1987; herafter MF) AGN continuum with a break at 1 (Ferland et al. 1998). The results are not sensitive to the assumed column since the dust opacity strongly suppresses line emission from columns beyond cm-2 (Laor & Draine 1993, hereafter LD). The effect of the ionizing continuum shape is explored by calculating the model results again with a different ionizing spectrum, as further described in Section 4.
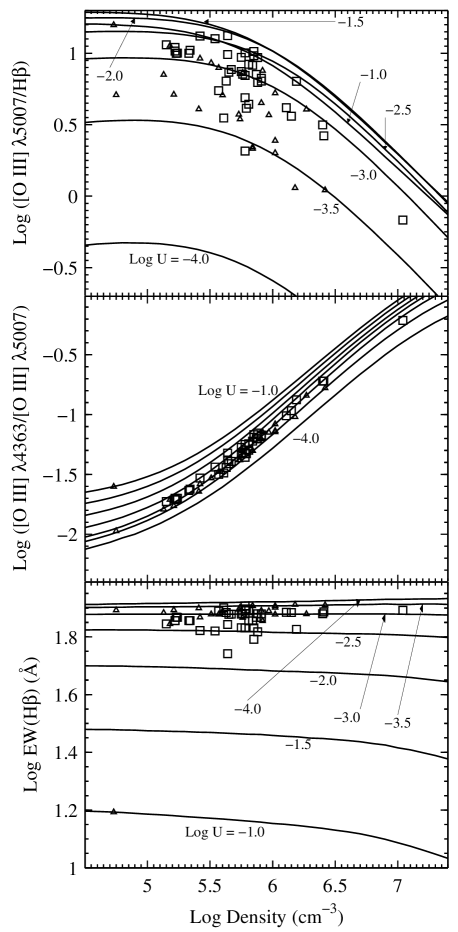
Figure 2 presents the calculated line flux ratios and EW as a function of for different values of . The upper panel shows the [O iii] 5007/H flux ratio. This ratio decreases with increasing due to collisional suppression of the [O iii] 5007 line at . The ratio increases with at low , as the fractional abundance of O iii increases, and starts decreasing at , as O gets ionized beyond O iii (the dust opacity suppresses emission from deeper layers where O is less ionized). The middle panel shows the [O iii] 4363/[O iii] 5007 flux ratio. This ratio is mostly set by due to the different of the two lines, as discussed above. The weak dependence on results from the weak dependence of on (Fig. 1). The lower panel shows the H EW for a CF = 1. At low the H EW is independent of and , as expected for a pure recombination line. At the H EW starts decreasing due to the increasing suppression of the line emission by absorption in dust within the ionized gas (Voit 1992; LD; Netzer & Laor 1993; Ferguson et al. 1997; Dopita et al. 2002).
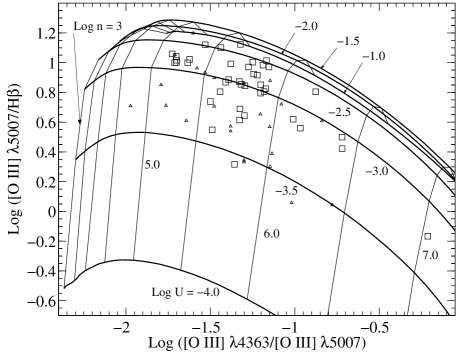
Figure 3 presents theoretical curves of the [O iii] 5007/H flux ratio as a function of the [O iii] 4363/[O iii] 5007 flux ratio for different values of and . This plot allows one to transform the two measured line ratios in a given object to the corresponding values of and in that object. The third parameter, the CF, is then set by the EW of either one of the three lines. There is a one to one transformation from the [O iii] 5007/H versus [O iii] 4363/[O iii] 5007 coordinate to the versus coordinate, as long as . Above that value there are two sets of solutions, one having , and the other , for a given set of [O iii] 5007/H and [O iii] 4363/[O iii] 5007 values (see Fig. 3). The presence of two solutions results from the non-monotonic dependence of [O iii] 5007/H on , mentioned above (Fig. 2, upper panel). The two solutions correspond to different CF values (the larger requires a larger CF to produce the observed H EW, Fig. 2 lower panel). Obtaining a unique solution requires additional constraints on or CF. As further described in Section 3, almost none of our objects happens to lie within the degenerate solution regime. However, note that photoionization models with , not explored here, produce lower [O iii] 5007/H ratios, which will be degenerate with some solutions. Such high models require a high CF, and they imply strong high ionization narrow lines, which we do not study here.
The above analysis is within the single zone approximation, i.e. all three lines are assumed to originate in gas with a given set of , and CF. In reality, there is likely to exist a distribution of values for these three parameters in the NLR, in which case the relative line strength will be a function of position in the NLR (e.g. Ferguson et al. 1997). The assumption of a single zone with uniform gas properties may not yield representative mean values in this case. To explore the effects of a non uniform cloud population, we repeated the analysis assuming two populations of clouds with very different [O iii] 5007 and [O iii] 4363 emissivities. The first population is assumed to have a density cm-3, and thus produces a high [O iii] 4363/[O iii] 5007 ratio, and the second population is assumed to have cm-3, and thus produces a ratio lower by a factor of (Fig. 3). Most of the [O iii] 4363 emission is expected to come from the first population of clouds, and most [O iii] 5007 from the second. Such a “two zone model” has six free parameters (, , and CF for each zone), and three need to be set since we only have three constraints (the EWs of H, [O iii] 5007, and [O iii] 4363). The additional parameter we fix is for the cm-3 zone, which implies this is an inner very compact zone. This rather high is motivated by the mean spectral energy distribution (SED) of AGN, which indicates a significant covering factor of very hot dusty gas with a high ionization parameter. The dust temperature indicates it is located outside the BLR, but on scales smaller than the “typical” NLR. The lack of strong line emission from the associated gas implies , to allow significant suppression of the line emission by the dust (Section 2). The remaining free parameters of the two zone model are the ionization parameter of the outer zone, , and the covering factors of the inner and outer zones, CFin, CFout, these are set as described below in Section 3.4.
3 Data Analysis
3.1 The data set
For the analysis we use the BG92 sample mentioned above (Section 1). This sample extends in luminosity from Seyfert galaxies with erg s-1 (calculated at rest frame 3000 Å using the continuum fluxes in Neugebauer et al. 1987, assuming km s-1 Mpc-1, ), to luminous quasars at erg s-1. This is a complete and well defined sample, selected based on (blue) color and (point like) morphology, independently of the emission line strengths and profiles (subject to the condition that broad emission lines are present).
Optical observations of the H region of the 87 objects are described in BG92, and were kindly provided by T. Boroson (private communication). These spectra do not extend down to [O iii] 4363 in all objects, and we therefore supplemented the BG spectra by optical spectra from Shang et al. (2003), kindly provided by Z. Shang (private communication) which also provide a higher S/N in some cases222The spectra obtained from Shang et al. (2003) are of PG 0953+414, PG 1216+069, PG 1322+659, PG 1427+480, PG 1512+370 and PG 1543+489.. The final sample contains 78 objects with spectra which contain the [O iii] 4363 region. The spectra were corrected for reddening, redshift, and possible slit losses, as described in Baskin & Laor (2005, hereafter BL05, Section 2.2 there).
3.2 The Fe ii subtraction
The [O iii] 4363 line is generally very weak, and its measurement requires a careful subtraction of the Fe ii emission multiplets. We used the I Zw 1 Fe ii template, kindly provided by T. Boroson, to subtract the Fe ii lines from the spectra (see Section 2.2 in BL05 for further details concerning the subtraction procedure).
The Fe ii template was constructed by subtracting all the none Fe ii emission from the observed spectrum of I Zw 1. However, this also requires estimates of the relative contributions of Fe ii and [O iii] 4363 near 4363Å, which may not be accurate, and could lead to biased estimates of the [O iii] 4363 strength in the Fe ii subtracted spectra. To check the accuracy of the Fe ii subtraction, we also used the more theoretically motivated Fe ii template of I Zw 1, independently constructed by Véron-Cetty, Joly & Véron (2004), kindly provided by M. Véron-Cetty. The BG92 template is rather smooth and featureless around 4363Å, and the Véron-Cetty et al. template has a sharp feature redward of 4363Å, but much weaker emission at 4363Å, compared to BG92. The Véron-Cetty et al. compilation of expected allowed and forbidden Fe ii emission lines indicates no significant feature near 4363Å. There was almost no effect on the [O iii] 4363 profile in I Zw 1 when using either the Véron-Cetty et al. template or the BG92 template to subtract the Fe ii emission. We therefore conclude that improper Fe ii subtraction is unlikely to significantly bias our measurements of the [O iii] 4363 line. In our analysis we used the empirically derived BG92 Fe ii template.
3.3 The measurement procedure
As noted above, there is likely to exist a distribution of , , and CF values for the [O iii] emitting gas in the NLR. To ensure as much as possible that the measured H and [O iii] 4363 emission originates in the same gas which produces the [O iii] 5007 emission, we use the [O iii] 5007 profile as a template for measuring the H and [O iii] 4363 lines. This ensures that all three lines originate in gas with the same line of sight velocity distribution, although it does not necessarily guarantee they all originate in NLR gas clouds with the same distribution of emission properties.
In each object we subtracted the maximum allowed scaled [O iii] 5007 profile which does not produce a dip in the broad H line and in the H+[O iii] 4363 blend, as determined by eye inspection. The subtraction was performed as follows. Both the [O iii] 5007 line and either [O iii] 4363 or H were transformed from wavelength scale to velocity scale, using measured from the [O iii] 5007 peak (T. Boroson, private communication, listed in BL05). Then, the maximal in the term was searched, where ‘line’ is either H or [O iii] 4363, such that the subtraction of the scaled [O iii] 5007 profile will not produce a dip in the measured line. The measured narrow line component equals the scaled [O iii] 5007 line, . To calculate the line EW the line profile was transformed back to wavelength dependence , integrated over , and divided by the continuum flux density at 4861 Å (the same wavelength used by BG92). The flux density at 4861 Å was measured by fitting a local power-law continuum to each spectrum between Å and Å. We measured the line EW directly, rather than infer it from the [O iii] 5007 EW measured by BG92 and the value of , since the [O iii] 5007 profile deduced here may not be identical to the one assumed by BG92 due to possibly different definitions of the continuum underlying [O iii] 5007.
To determine whether the measured line flux is significant or not, we need to evaluate the standard deviation, , of the flux measurement. We first measured the RMS of the flux density between 4500Å and 4600Å333Seven spectra have a feature in this range, and thus a slightly different range was chosen for them., multiplied the RMS by the wavelength width of a pixel (to convert flux density to flux), and then multiplied it by the square-root of the number of pixels in the full width at zero intensity of the [O iii] 5007 profile, to get . A measured line flux was accepted as significant if it is . Following BG92, we also adopted an EW of 0.5 Å as the lower detection limit (accounting for the minimum likely level of systematic errors). After exclusion of objects with an unmeasurable H narrow component, and an unmeasurable [O iii] 4363, the remaining sample contained 40 objects where all three lines are detected.
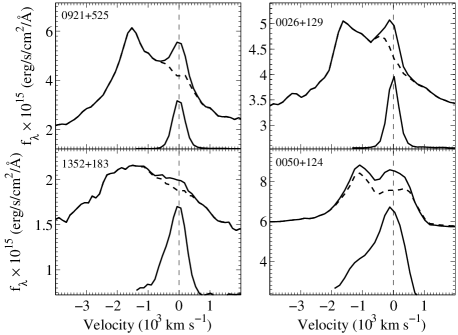
Figure 4 shows four representative cases of the [O iii] 5007 profile subtraction from the H+[O iii] 4363 blend. The two left panels present objects where the [O iii] 4363 emission is rather well fit using the [O iii] 5007 profile. The upper left panel is a clear detection, and the lower left one a marginally acceptable detection at . The two right panels in Fig. 2 demonstrate cases where a broad residual [O iii] 4363 component remains after subtraction of the scaled [O iii] 5007 profile. Such a broad residual component often remains, and it most likely indicates an inner higher density extension of the NLR, where the density is higher than the [O iii] 5007 critical density but it is lower than the critical density of [O iii] 4363. Such an inner, higher velocity, extension of the NLR would contribute to the [O iii] 4363 line and not to the [O iii] 5007 line (Nagao et al. 2001). This demonstrates that making inferences based on the total [O iii] 5007 and [O iii] 4363 line fluxes, rather than matched profile fluxes, could lead to inaccurate results.
3.4 The inferred NLR parameters
Table 1 presents the narrow “[O iii] 5007-like” H and [O iii] 4363 EW, measured as described above. We also list in Table 1 the [O iii] 5007 EW from BG92 (the Shang et al. spectra yielded consistent values). Column 1 lists the name of the object, columns 2 and 3 list the measured H EW in units of Å and its significance in units of . Column 4 lists the [O iii] 5007 EW in units of Å, as reported by BG92. Columns 5 and 6 list the measured [O iii] 4363 EW and its significance. Column 7 lists at 4861 Å in units of erg s-1, which allows a quick conversion of line EW to line luminosities. Columns 8, 9 and 10 list the inferred NLR parameters, (in units of cm-3), and CF (in per cent) for the single-zone model. Finally, columns 11, 12 and 13 list the CFin (in per cent), and CFout (in per cent) for the two-zones model.
| Object | H | [O iii] | [O iii] 4363 | Single zone | Two zones | |||||||
|---|---|---|---|---|---|---|---|---|---|---|---|---|
| EW | S/N | 5007 | EW | S/N | CF | CFin | CFout | |||||
| (1) | (2) | (3) | (4) | (5) | (6) | (7) | (8) | (9) | (10) | (11) | (12) | (13) |
| 0003+158 | 1.96 | 20.9 | 26 | 1.24 | 16.5 | 5.64 | 3.6 | 4.8 | 4.7 | |||
| 0003+199 | 5.34 | 22.9 | 22 | 1.04 | 6.8 | 5.79 | 6.8 | 4.8 | 6.1 | |||
| 0007+106 | 4.19 | 16 | 42 | 0.84 | 4.4 | 5.24 | 5.7 | 2.8 | 5.8 | |||
| 0026+129 | 3.10 | 34.9 | 29 | 1.54 | 21.2 | 5.75 | 4.6 | 6.9 | 3.9 | |||
| 0049+171 | 15.55 | 18.8 | 97 | 6.07 | 10.9 | 5.88 | 20.5 | 28.9 | 16.4 | |||
| 0050+124 | 6.97 | 41.4 | 22 | 4.19 | 27.5 | 6.40 | 9.2 | 21.4 | 5.6 | |||
| 0052+251 | 3.90 | 29.9 | 30 | 1.22 | 10.3 | 5.67 | 5.2 | 5.4 | 4.6 | |||
| 0838+770 | 3.58 | 8.8 | 13 | 1.40 | 4.4 | 6.15 | 4.7 | 7.0 | 3.5 | |||
| 0921+525 | 13.00 | 33.3 | 83 | 5.46 | 18.6 | 5.91 | 17.2 | 26.0 | 13.5 | |||
| 0923+129 | 7.04 | 24.7 | 31 | 1.56 | 8.2 | 5.81 | 9.1 | 7.3 | 8.1 | |||
| 0934+013 | 7.29 | 22.6 | 51 | 2.58 | 11.7 | 5.78 | 9.6 | 11.9 | 8.2 | |||
| 0953+414 | 1.87 | 10.0 | 18 | 1.16 | 7.2 | 5.85 | 2.8 | 5.3 | 2.3 | |||
| 1001+054 | 2.65 | 5.4 | 7 | 1.33 | 3.2 | 6.41 | 3.4 | 6.8 | 2.3 | |||
| 1048+342 | 2.72 | 5.9 | 28 | 1.90 | 5.5 | 5.85 | 4.4 | 8.4 | 4.4 | |||
| 1100+772 | 3.90 | 15.8 | 41 | 0.98 | 4.4 | 5.34 | 5.4 | 3.5 | 5.6 | |||
| 1119+120 | 2.66 | 23.0 | 19 | 0.91 | 9.7 | 5.76 | 3.5 | 4.2 | 3.0 | |||
| 1126041 | 3.47 | 12.4 | 19 | 0.60 | 3.2 | 5.57 | 4.5 | 2.6 | 4.1 | |||
| 1149110 | 4.64 | 16.7 | 33 | 2.07 | 9.5 | 5.87 | 6.3 | 9.8 | 4.9 | |||
| 1151+117 | 1.33 | 17.1 | 11 | 0.66 | 10.6 | 5.84 | 1.9 | 3.1 | 1.5 | |||
| 1202+281 | 5.64 | 37.3 | 36 | 1.30 | 9.8 | 5.63 | 7.4 | 5.7 | 6.6 | |||
| 1229+204 | 1.94 | 10.9 | 19 | 0.79 | 6.5 | 5.64 | 2.8 | 3.4 | 2.6 | |||
| 1244+026 | 8.21 | 28.1 | 17 | 0.75 | 3.5 | 5.78 | 10.2 | 3.5 | 9.6 | |||
| 1302102 | 2.16 | 12.8 | 9 | 0.88 | 5.5 | 6.11 | 2.8 | 4.4 | 2.1 | |||
| 1307+085 | 3.18 | 14.7 | 32 | 1.80 | 11.8 | 5.78 | 4.7 | 8.0 | 4.2 | |||
| 1309+355 | 2.55 | 18.0 | 19 | 0.89 | 7.1 | 5.75 | 3.4 | 4.1 | 2.9 | |||
| 1310108 | 8.24 | 39.2 | 77 | 5.41 | 30.6 | 5.88 | 12.5 | 24.8 | 10.0 | |||
| 1341+258 | 1.90 | 9.8 | 14 | 0.54 | 4.1 | 5.65 | 2.5 | 2.4 | 2.2 | |||
| 1351+236 | 2.46 | 11.2 | 12 | 0.57 | 3.0 | 5.78 | 3.2 | 2.6 | 2.8 | |||
| 1351+640 | 3.70 | 20.6 | 31 | 1.77 | 11.3 | 5.81 | 5.2 | 8.2 | 4.1 | |||
| 1352+183 | 1.57 | 4.8 | 10 | 1.33 | 3.6 | 6.19 | 2.3 | 6.6 | 1.2 | |||
| 1411+442 | 2.25 | 9.9 | 15 | 1.01 | 6.5 | 5.91 | 3.1 | 4.8 | 2.3 | |||
| 1425+267 | 3.61 | 20.0 | 36 | 0.84 | 4.9 | 5.33 | 5.0 | 3.0 | 5.0 | |||
| 1501+106 | 5.58 | 35.6 | 64 | 1.20 | 10.9 | 5.15 | 8.0 | 3.6 | 8.8 | |||
| 1512+370 | 5.50 | 20.9 | 57 | 1.14 | 5.2 | 5.22 | 7.7 | 3.8 | 7.9 | |||
| 1519+226 | 5.87 | 8.6 | 4 | 2.45 | 4.8 | 7.04 | 7.5 | 12.8 | 5.4 | |||
| 1534+580 | 5.99 | 48.3 | 79 | 2.33 | 25.3 | 5.42 | 9.0 | 7.8 | 12.5 | |||
| 1535+547 | 4.53 | 22.0 | 16 | 0.52 | 4.3 | 5.61 | 5.7 | 2.3 | 5.4 | |||
| 1545+210 | 2.61 | 11.2 | 33 | 1.20 | 6.5 | 5.54 | 4.0 | 4.4 | 5.3 | |||
| 1612+261 | 14.28 | 74.3 | 157 | 3.11 | 23.1 | 5.22 | 19.9 | 9.9 | 21.6 | |||
| 1704+608 | 2.70 | 15.2 | 27 | 0.52 | 3.4 | 5.23 | 3.7 | 1.8 | 3.7 | |||
To infer and CF we calculated theoretical values of the H flux, and [O iii] 5007/H and [O iii] 4363/[O iii] 5007 ratios using the photoionization code CLOUDY (v. 94.00). The calculations were made for a grid of models with (in steps of 0.5), and (in steps of 0.1). The H flux was converted to EW as follows. The choice of and corresponds to a given ionizing flux at the face of the photoionized slab, which is specified by the output of CLOUDY. We multiplied the H ionizing flux by 0.4 to get an approximate value for at (deduced from the spectral shape in fig. 7 of LD), and divided it by 4861 to get the continuum at 4861 Å. The H line flux from CLOUDY was then divided by this to get the predicted line EW for CF = 1. This procedure assumes a uniform spectral energy distribution (SED) in all objects, which may not correspond well with the range of observed SEDs in the PG sample quasars. However, as shown in Section 4.1.3, the likely range of SED shapes has only a minor effect on the deduced parameters.
For the single zone model we use the following algorithm to infer and CF from the H EW, [O iii] 5007/H and [O iii] 4363/[O iii] 5007 ratios.
-
1.
Assume , starting at .
-
2.
Calculate from the observed [O iii] 4363/[O iii] 5007 ratio for the assumed (Fig. 2, middle panel). The calculation is made using a linear interpolation scheme for log [O iii] 4363/[O iii] 5007 versus log , when the observed [O iii] 4363/[O iii] 5007 value is between grid points.
-
3.
Calculate the theoretical [O iii] 5007/H ratio for the assumed , and the calculated above (using a linear interpolation scheme as above).
-
4.
Calculate the theoretical [O iii] 5007 EW from the theoretical [O iii] 5007/H ratio found above, and the observed H EW.
-
5.
Repeat steps (i)-(iv) changing from to in steps of 0.1 (using linear interpolations between grid points).
-
6.
Adopt as the solution the values of and which yield the smallest difference between the observed and theoretical [O iii] 5007 EW, as calculated in step (iv).
-
7.
Calculate the theoretical H EW for the and of the solution (Fig. 2, lower panel). Obtain CF by dividing the observed H EW by the theoretical one.
This procedure is effectively identical to the one described in Section 2. The differences between the observed and calculated [O iii] 5007 EW are typically well below 10 per cent, which is generally within the [O iii] 5007 EW measurement errors. The resulting best fit and CF for each object are listed in Table 1.
As discussed in Section 2, in the two zone model we assume cm-3 for the outer zone, and cm-3 and for the inner zone, leaving CFin, CFout and as the remaining three parameters to be set by the observations. The assumed and for the inner zone imply log [O iii] 5007/H=0.2, log [O iii] 4363/[O iii] 5007=0.04 (see Fig. 3) and a calculated H EW of 12.21 Å for CFin=1. We now iterate over the possible range of log values for the outer zone. For each value for the outer zone we calculate [O iii] 5007/H [O iii] 4363/[O iii] 5007, and the H EW for CFout=1. We now write two linear equations for the observed [O iii] 5007 and [O iii] 4363 EWs in a given object, as a function of the above line ratios, the calculated H EWs, and the two unknowns, CFin and CFout, which we solve for. The solution produces the correct observed [O iii] 5007/H [O iii] 4363/[O iii] 5007 ratios by construction, and it also allows us to calculate the total expected H EW. The accuracy of the solution is measured by the difference between the observed and calculated total H EW. The value which minimizes this difference (typically less than 10 per cent) is taken as the best fit solution for the given object.
4 Results & Discussion
4.1 The distribution of and values
4.1.1 The Single Zone Approximation
As shown in Table 1 and Fig. 2, the values of of all 40 objects with detections (excluding one outlier, PG 1519+226) lie within a relatively small range (factor of ) around the critical density of [O iii] 5007 (i.e. within ). This is expected if there is a range of densities in the NLR, since the line emissivity per unit mass peaks close to the critical density, and thus the [O iii] 5007 emissivity weighted mean density is expected to be at , unless the distribution of CF with density is heavily weighted towards very high or very low densities.
We also find that all objects (except one) lie at . A similar selection effect may be present here as well. As Fig. 2 (lower panel) shows, the H line emissivity per unit solid angle (= EW/CF) drops at (due to dust suppression), and thus if there is a distribution of values in the NLR with comparable values of CF, most of the H emission would originate in gas with . However, at the O iii emission is suppressed because Oxygen becomes less ionized than O iii. Thus, the combined effects of dust suppression and ion abundance leads to a relatively small range of () where both the [O iii] lines and H are emitted efficiently.
In the above analysis we considered only objects where all the three narrow lines are detected. Ignoring upper limits may result in spurious trends or correlations. To explore that, we repeated the analysis described in Section 3 for all the objects where [O iii] 4363 was not detected, assuming the line EW equals the upper limit value (the larger of the 3 detection limit and 0.5 Å). These objects are also plotted in Figs. 2 and 3, and their distribution nearly overlaps the distributions of the detected objects. We also repeated the analysis arbitrarily assuming the [O iii] 4363 EW is a factor of 10 lower than the upper limit. This leads to a tail of objects extending to , but the distribution of values is not much affected. The extension to low occurs because is largely set by [O iii] 4363/[O iii] 5007, while is unchanged because it is largely set by [O iii] 5007/H, and it is nearly independent of the [O iii] 4363 EW when [O iii] 4363/H is low (Fig. 3).
4.1.2 The Two Zone Approximation
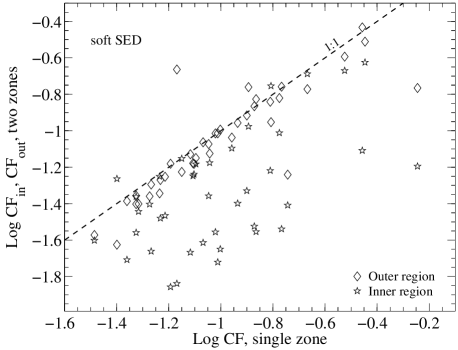
As described above, the two zone approximation we use assumes fixed values for in the two zones, and a fixed for the inner zone. For we find , with most objects in the range of to . This distribution is offset to somewhat higher values (by ) compared to the single zone approximation (Fig. 5).
4.1.3 Modified SED
Far UV observations of high quasars (Zheng et al. 1997), together with soft X-ray observations of low quasars (Laor et al. 1997), suggest a significantly softer ionizing SED than the one suggested by MF, which we used in the above analysis (but see Scott et al. 2004). To explore the possible role of the SED on the deduced NLR parameters we repeated the analysis in Section 3 with a modified softer SED, where we added a break at 1 Rydberg to a power-law slope of extending to 70 Rydberg ( keV), as suggested by the far UV to soft X-ray composite of Laor et al. (1997). The rest of the SED remains unchanged.
The resulting softer SED values, , and , are very similar to those obtained with the harder MF SED. Apart from two outliers, where log changed from to , due to the degeneracy of the solution at high (Fig. 3), for the other objects we find a very tight relation between and . Specifically, we find a best fit relation , with an RMS scatter of 0.05, and a Spearman rank order correlation coefficient . This relation implies an average systematic offset of to 0.11, for to , which is well within the likely systematic and statistical errors in our solution for . Similarly, for we find , an RMS scatter of 0.02, (excluding the two outliers), and again a negligibly small offset of 0.07 to 0.03 for to 7. For the soft SED covering factor CFs we get CFCF+0.24, with an RMS scatter of only 0.01 and . Thus, CFs is essentially perfectly correlated with CF, but it is offset to higher values by a factor of 1.74(=), as expected since the softer SED requires a larger CF to produce a given H EW. Note that the exact absolute value of the best fit parameters, , , and CF, for each object are not crucial for our study of the modulation of the [O iii] 5007 strength, and what mostly matters is the range of values for these parameters.
4.1.4 Comparison with Earlier Studies
Binette et al. (1996, and references therein) discuss evidence for the presence of significant contribution to the NLR emission from matter bounded gas. This component produces mostly high ionization lines, and it is invoked to explain the large relative strengths of the He ii 4686 and C iv 1549 lines, seen in the NLR emission of Seyfert 2 galaxies (e.g. Ferland & Osterbrock 1986), as well as the strength of other lines not measured in our sample. The single and two zone models we use do not include such a matter bounded gas component. However, we suspect that such a component may not be required by our data, and the anomalous strength of He ii 4686 may be interpreted differently, as further discussed below.
Binette et al. (1996) used a mean C iv 1549/H flux ratio of from Ferland & Osterbrock (1986). However, using the narrow C iv 1549 EW measurements available for our sample (BL05), we deduce a significantly lower mean value of , which is likely biased to large values as it does not exclude low significance level narrow C iv 1549 measurements. The weakness of the NLR C iv 1549 component in broad line AGN was already noted by Wills et al. (1993) in Hubble Space Telescope (HST) spectra of seven radio loud AGN444The apparently discrepant C iv 1549 NLR emission in Type II/Type I AGN is inconsistent with the inclination unification schemes for AGN, and this needs to be addressed in future studies.. The lower mean C iv 1549/H value is consistent with standard photoionization model predictions (e.g. Wills et al. 1993; Groves et al. 2004a), and thus there is no evidence from C iv 1549 for a matter bounded NLR component in our objects.
The mean He ii 4686/H flux ration in Seyfert 2 galaxies is (Ferland & Osterbrock, 1986). We measure a similar mean value of in 43 of our objects where a narrow “[O iii] 5007-like” He ii 4686 is detectable. As shown in the extensive set of calculations by Groves et al. (2004a; 2004b), dusty photoionized gas models with can produce He ii 4686/H in ionization bounded gas. The models of Binette et al. (1996) do not include dust, and these produce lower He ii 4686/H ratios, which lead Binette et al. to conclude that an additional population of matter bounded gas clouds must be present at the NLR. Dusty photoionized gas with produces a higher He ii 4686/H ratio since the H line originates from deeper layers compared to He ii 4686, and is thus more strongly suppresed by dust absorption. Most of the line emission in dusty photoionized gas originates within a surface layer with a column of cm-2, where the dust opacity is . The line emission from this surface layer mimics to some extent the line emission from matter bounded, dust free photoionized gas, as invoked by Binette et al. (1996).
Dopita et al. (2002) calculated photoionization models for isobaric dusty gas, and proposed that the ionization parameter in such gas tends to a constant value, independent of the surface gas density, once radiation pressure dominates gas presure. Dopita et al. further suggested this effect explains the small dispersion in the NLR line ratios (log [O iii] 5007/H0.9-1.2 in their sample), and the implied nearly constant in the NLR. However, here we find a much larger range (log [O iii] 5007/H0-1.1, Fig. 3), which implies a correspondingly larger range in . This argues against the effectiveness of the mechanism proposed by Dopita et al. to produce a fine tuned in the NLR. We note in passing that the dusty isochoric CLOUDY model used here produces nearly identical line ratios to those reported by Groves et al. (2004a; 2004b) for isobaric dusty gas with significant radiation pressure. For example, Groves et al. find log [O iii] 4363/[O iii] 5007 for cm-3, , and solar abundance (Fig. 13 in Groves et al. 2004b), while we find for the same parameters (Fig. 3). At , where radiation presure effects on dust are negligible, their model gives a ratio of , and CLOUDY gives an essentially identical value of .
4.2 Which parameter modulates most strongly the [O iii] 5007 EW?
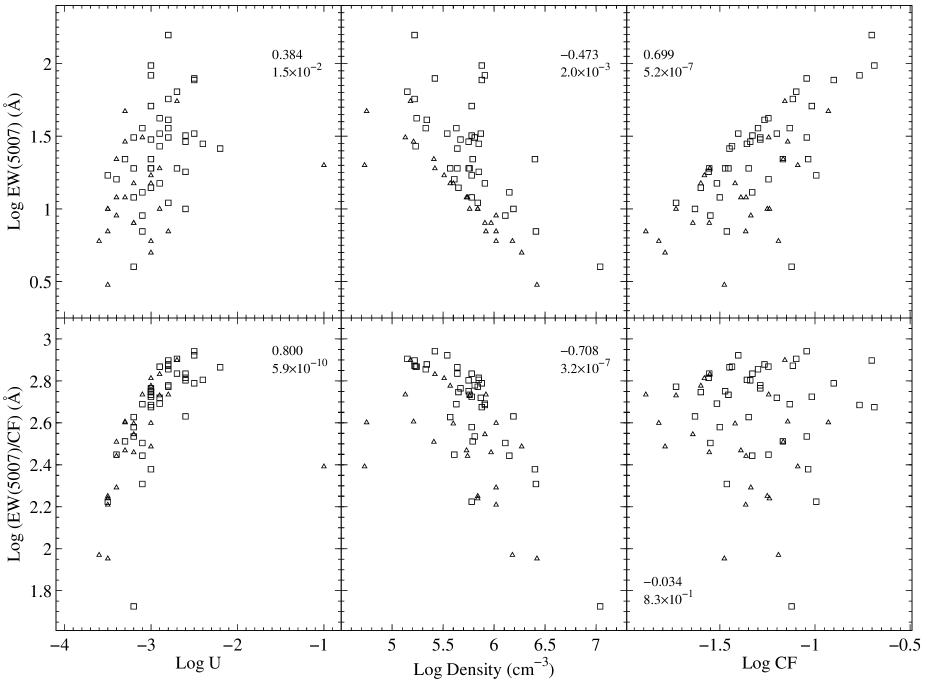
Figure 5 (upper panels) presents the dependence of the [O iii] 5007 EW on , and CF, for the single zone model. The [O iii] 5007 EW ranges over a factor of 40 (4Å to 157Å) in our sample of 40 AGN with complete detections (compared with a range of in the complete sample of 87 objects). The [O iii] 5007 EW is most strongly correlated with the CF. The Spearman rank order correlation coefficient, , for the 40 detected objects is 0.699, which has a null probability of Pr= (note that the distribution of the [O iii] 4363 non detections is consistent with the distribution of the detections). The CF covers a range of about 10 (1.9 to 20.5 per cent, Table 1), and since the EW of all lines is linear with CF, the CF modulates the EW by a factor of 10, making it the dominant factor in modulating the [O iii] 5007 EW.
The [O iii] 5007 EW is also significantly correlated with (, Pr = ), though the [O iii] 4363 non detections may affect the strength of this correlation if the true [O iii] 4363 EW are well below the upper limits. The range of cm-3 amounts to a modulation of the [O iii] 5007 EW by an additional factor of 3 (e.g. the curve in Fig. 2, upper panel). Finally, the [O iii] 5007 EW shows only a marginal correlation with (, Pr = , not affected by upper limits). Although the range of modulates the [O iii] 5007 EW by a factor of , its weak correlation with [O iii] 5007 EW indicates it mostly contributes to the scatter in the previous two relations, and does not have a large systematic effect on the range of [O iii] 5007 EWs.
The lower panel of Fig. 5 presents the dependence of the [O iii] 5007 EW/CF on and CF. The [O iii] 5007 EW/CF represents the [O iii] 5007 emissivity per unit solid angle of the NLR gas. This parameter ranges over a factor of 5, which represents the amount of [O iii] 5007 EW modulation by the combined effects of and . The NLR [O iii] 5007 emissivity per unit solid angle is strongly correlated with (, Pr = ) and somewhat less strongly with (, Pr = , again weakened by non detections). This emissivity is completely unrelated with CF (, Pr = 0.83). We finally note that , and CF, are not significantly correlated with each other.
As expected (Section 4.1.3), essentially identical results were obtained with the modified soft SED. Somewhat stronger correlations were obtained in the two zone approximation. Specifically, the [O iii] 5007 EW correlation with rose to 0.454 and with CFout to 0.778 (both parameters for the outer zone), while the correlations for the [O iii] 5007 emissivity (Fig. 5, lower panel) remained essentially unchanged.
4.3 Relation with EV1 parameters
The [O iii] 5007 line is one of the main components of the BG92 EV1 set of correlations. These correlations may be driven by some fundamental parameters, such as (BG92). Below we briefly explore whether the NLR physical parameters , and CF are correlated with some of the non-[O iii] 5007 EV1 components (as listed in BG92).
The CF is significantly correlated with the absolute band magnitude (, Pr = ), such that the CF decreases with increasing luminosity. This accounts for the tendency of the [O iii] 5007 EW to decrease with increasing luminosity in the BG92 sample (note that Shemmer et al. 2004 do not find this effect in luminous high- quasars). The only other parameter significantly correlated (i.e. Pr ) with CF is the EW of the broad He II line (, Pr = ). This correlation is not simple to interpret, and it may be induced by the strong inverse correlation of the broad He II EW with luminosity, and the above inverse correlation of luminosity and CF. Interestingly, there is no significant correlation of CF and (taken from BL05; , Pr = 0.41). Such a relation was suggested by BG92 as the physical mechanism driving the set of EV1 correlations (see also Kraemer et al. 2004).
The is significantly correlated with two surprising parameters, the soft X-ray slope (, Pr = ), and the compact to total radio flux ratio from Kellermann et al. (1989) (, Pr = ). A marginally significant correlation exists with the Fe II/H flux ratio (, Pr = ), which may point at a relation between the NLR density and the BLR metalicity.
The is significantly correlated with the continuum luminosity at 3000 Å, and with the broad H line FWHM, leading to a somewhat stronger, but hard to interpret correlation (, Pr = ) with the estimated black hole mass (, see BL05). A stronger correlation exists with the Fe II/H flux ratio (, Pr = ). Again, this may point at a relation between the NLR ionization level and the BLR metalicity.
The two zone analysis yields similar correlations for CFout with (, Pr = ), and with the broad He II EW (, Pr = ). But, there are no significant correlations with CFin. The correlations for are somewhat stronger than those for the single zone (with , , Pr = ; with Fe II/H , Pr = ).
4.4 The size of the NLR
The distance of the [O iii] 5007 emitting region from the central ionizing continuum source, , can be determined from the measured and for each object, and the estimated ionizing luminosity , as follows. By definition , where the ionizing photon density is given by , where is the mean ionizing photon energy (3.03 Rydberg, for the CLOUDY MF ionizing continuum). These relations give , where .
Figure 6 presents the luminosity dependence of for the single zone and for the two zone approximations. The correlation for the single zone is strong (, Pr = ), with a best fitting relation
where erg s-1. For the two zone approximation we get a somewhat weaker but still significant correlation of the size of the outer zone (, Pr = ), with a best fitting relation
The assumption of fixed and values in the inner zone implies pc by construction.
The single zone versus relation implies sizes which are much smaller than deduced through imaging of spatially extended [O iii] 5007 emission in Type I AGN with the HST (Bennert et al. 2002; Schmitt et al. 2003). For example, in four overlapping PG quasars (0026+129; 0053+251; 0953+414; 1307+085) Bennert et al. find -5.9 kpc, while we get -116 pc, i.e. about times smaller sizes. In the two zone approximation we get 1.3-1.7 kpc, i.e. within a factor of 2-3 of the Bennert et al. values. However, the Bennert et al. HST images appear to be measuring the kpc-scale ‘extended NLR’ (ENLR, Unger et al. 1987), which according to the surface brightness values in Bennert et al. (Table 2 there), may include a significant component of unresolved [O iii] 5007 emission. A more carefull analysis of these images is required to determine the fraction of unresolved [O iii] 5007 emission, and the implied constraints on the [O iii] 5007 radial emissivity distribution. Note also that the extrapolation of the Bennert et al. relation to higher implies values which are ruled out by ground based observations of high quasars (Netzer et al. 2004), also pointing at a more compact . Similarly, a compact NLR ( pc), consistent with our estimates, was deduced by Kraemer et al. (1998), based on detailed photoionization modeling of the narrow line emission in NGC 5548.
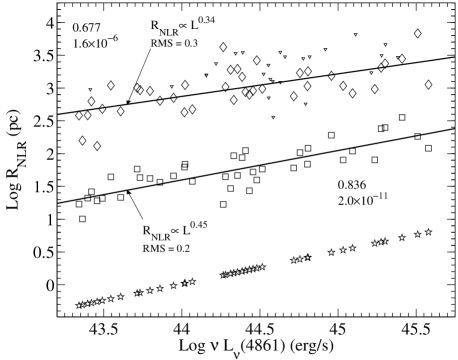
The slope of 0.45 for the single zone model implies that , i.e. is roughly constant. The scatter in the versus relation is only 0.2 (RMS in log ), which is significantly smaller than expected based on the measured range of values for and for 555Phenomenologically, this results from a weak anti-correlation between and , which produces a smaller than expected dispersion in , compared to the dispersion in each parameter.. The small spread in the versus relation, and a slope close to , indicate a small spread of at the [O iii] 5007 emitting region. It is not clear why such a small range in should be present 666The small spread in the BLR can be understood in terms of the critical required for dust sublimation (e.g. LD).. The two zone model shows a somewhat larger scatter (0.3 RMS in log ), and a flatter slope (0.34), which indicates a non-uniform .
The tight versus relation may be partly induced by the rejection of objects with non-detected [O iii] 4363. In these objects, the arbitrary assumption that the true [O iii] 4363 EW is 0.1 times the upper limit value leads to values which are an order of magnitude larger than deduced for the rest of the objects. Thus, higher quality optical spectra, with complete detections of [O iii] 4363, are required in order to measure more accurately the amount of scatter in the versus relation.
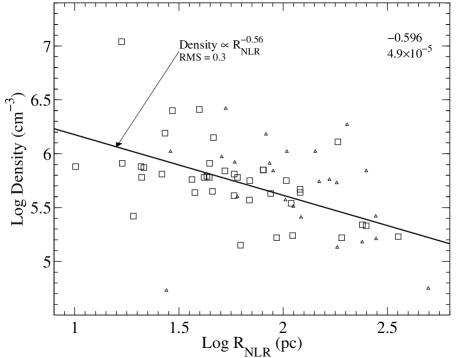
Figure 7 shows that there is also a significant inverse correlation between and (, Pr = ). The slope of the relation is . This relation is consistent with earlier findings of a negative radial density gradient in the NLR. In this case, inclusion of upper limits on [O iii] 4363 as detections, at a tenth of their value, extends the correlation to large and lower , indicating that this correlation cannot be induced by ignoring the non detections.
Inspection of the correlations of with the EV1 parameters yields that the broad H FWHM is also correlated with (, Pr = ). This leads to a a remarkably strong correlation of with (, Pr = ). This strong correlation stands in contrast with the lack of correlation of with (, Pr = 0.99). We note, however, that is not significantly correlated with (, Pr = ). We do not have a simple plausible explanation for the strong versus correlation. However, as mentioned above, one should note that this correlation is partly based on the versus relation, which needs to be verified with higher quality spectra allowing complete detections.
4.5 The CF of the NLR
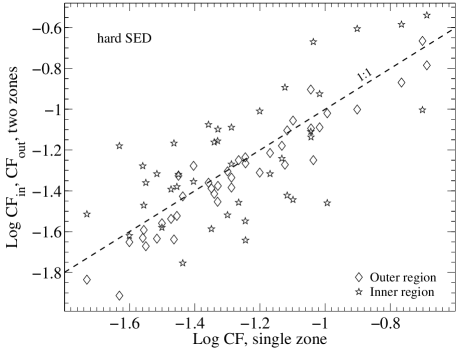
Figure 8 presents a comparison of the single zone CF and the two zone CFin and CFout, for both the hard MF SED, and for the softer slope SED (Section 4.1.3). In the two zone model with the soft SED we require the inner zone to produce a similar [O iii] 4363/[O iii] 5007 ratio as in the hard SED model, which lead to for the inner zone (rather than with the hard SED). As already noted above (Section 4.1.3), the softer SED implies CF values which are higher by 1.74 compared to the hard SED. A similar effect is seen in Fig. 8 for the two zone solution, where CFin and CFout in the soft SED solution are systematically higher than in the hard SED solution. For both SEDs CF and CFout are rather well correlated, but CFin can differ by a factor of 3-5 from CF. This is expected since CFin is largely set by [O iii] 4363, while both CF and CFout are largely set by [O iii] 5007.
Independent constraints on the radial distribution of the covering factor of dusty gas in the NLR can be obtained from models for the IR SED of AGN. In the two zone model, the inner zone is within a factor of few of the dust sublimation radius (e.g. Fig. 8 in LD), and the associated dust radiation should thus peak at , while the outer zone is at a larger radius, and should thus peak at . The ratio CFout/CFin should then determine the shape of the far to near IR SED. Interestingly, Fig. 8 indicates that this ratio is systematically different for the soft and the hard SEDs, which suggests one may be able to obtain constraints on the ionizing SED based on the observed NLR emission and IR SED. The two zone model presented here is obviously highly simplified, and a more realistic model should invoke a continuous radial distribution of dusty gas.
As discussed earlier, the large fraction of bolometric luminosity emitted in the IR ( in typical AGN), requires a correspondingly large CF of dusty gas (e.g. Sanders 1989). Earlier studies noted that the CF deduced based on the EW of NLR non-resonant recombination lines is only a few percent, and concluded that there must exist an additional NLR component with a large CF and (Voit 1992; LD, Netzer & Laor 1993). Our single zone model yields log CF (for the soft SED), which is still too low. A somewhat larger total CF is obtained with the two zone model, mainly due to our assumption of in the inner zone. As briefly mentioned in Section 2, some of our solutions with will be degenerate with models with (Fig. 3). Such high models will require a higher CF, which may be in better agreement with the IR constraints on the CF. However, the best test for such high models is through the various expected high ionization lines (originating in the surface layer where dust absorption is negligible).
Finally, we note that the [O iii] 5007 line is one of the main NLR coolants over a rather wide range of and (e.g. Ferguson et al. 1997), and thus should be a good tracer for most of the NLR gas. The [O iii] 5007 line becomes a negligible coolant at (e.g. Fig. 3), once most O is in O I and O II forms. However, a large covering factor of low NLR gas without [O iii] 5007 emission can be ruled out in most objects based on the following argument. Such a low component would account for a significant fraction of the H line EW, and thus the inferred [O iii] 5007/H ratio in the [O iii] 5007 emitting region will be significantly larger than the observed ratio. The commonly observed ratio of [O iii] 5007/H is already quite close to the maximum possible value in photoionization models (e.g. Fig. 2, upper panel), and it does not allow more than , of the H line to originate in non [O iii] 5007 emitting gas.
5 Conclusions
We use the [O iii] 5007 line profile to measure the EW of the [O iii] 4363 and H emission lines in the BG92 sample of bright AGN. All three lines are detected in 40 out of the 78 sample objects where optical spectra are available. The EW of the three lines are used, together with photoionization models, to infer , , and CF of the [O iii] 5007 emitting gas in the NLR. We find the main following results:
1. The inferred and in the single zone approximation show a relatively small range ( cm), which corresponds to the range where the [O iii] 5007 emissivity is maximized.
2. The strength of the [O iii] 5007 line is mostly modulated by the range of CF of the photoionized gas. The range of [O iii] 5007 emissivity per unit solid angle, set by , and , accounts for about half the range produced by the CF. Similar results are obtained for soft and hard ionizing SEDs, and for an extreme two zone approximation for the NLR.
3. The NLR CF is inversely correlated with luminosity, consistent with some earlier suggestions, but it is not correlated with , unlike earlier suggestions.
4. We find a rather tight radius luminosity relation, pc, in the single zone approximation. We also find an unexpected strong correlation of and . However, both relations may be induced by our [O iii] 4363 detection limits .
5. The observed line ratios can also be fit with a two zone model, where most of [O iii] 5007 originates in an cm-3 component at pc, and most of [O iii] 4363 in an cm-3 component at pc. Significant constraints on the spatial distribution of the [O iii] 5007 emission can be obtained through HST imaging of luminous Type I AGN, which should be able to resolve most of the [O iii] 5007 emission if it occurs in cm-3 gas.
Significantly higher quality optical spectroscopy of AGN, allowing complete detections of the [O iii] 4363 line, is required to establish the strength of the correlations with and .
Independent constraints on the radial distribution of the NLR gas covering factor can be deduced from the IR SED. These constraints, together with measurements of lower and higher ionization narrow lines, and more realistic photoionization models involving a radial distribution of dusty gas (e.g. Ferguson et al. 1997), can provide a better understanding of the origin of the observed extreme range in narrow line strengths in AGN.
acknowledgments
We thank H. Netzer for the many helpful comments. We also thank T. Boroson for providing the optical spectra and accurate redshifts for all objects, Z. Shang for providing optical spectra, M.-P. Véron-Cetty for providing the I Zw 1 spectra, and G. Ferland for making the photoionization code CLOUDY publicly available. This research was supported by THE ISRAEL SCIENCE FOUNDATION (grant #1030/04), and by a grant from the Norman and Helen Asher Space Research Institute.
References
- Baskin & Laor (2005) Baskin A., Laor A., 2005, MNRAS, 356, 1029 (BL04)
- Bennert et al. (2002) Bennert, N., Falcke, H., Schulz, H., Wilson, A. S., & Wills, B. J. 2002, ApJ, 574, L105
- Binette, Wilson, & Storchi-Bergmann (1996) Binette, L., Wilson, A. S., & Storchi-Bergmann, T. 1996, A&A, 312, 365
- Boroson & Green (1992) Boroson A. T., Green R. F., 1992, ApJS, 80, 109 (BG92)
- Dopita et al. (2002) Dopita, M. A., Groves, B. A., Sutherland, R. S., Binette, L., & Cecil, G. 2002, ApJ, 572, 753
- Ferguson, Korista, Baldwin, & Ferland (1997) Ferguson, J. W., Korista, K. T., Baldwin, J. A., & Ferland, G. J. 1997, ApJ, 487, 122
- Ferland et al. (1998) Ferland, G. J., Korista, K. T., Verner, D. A., Ferguson, J. W., Kingdon, J. B., & Verner, E. M. 1998, PASP, 110, 761
- Ferland & Osterbrock (1986) Ferland, G. J. & Osterbrock, D. E. 1986, ApJ, 300, 658
- Groves, Dopita, & Sutherland (2004) Groves, B. A., Dopita, M. A., & Sutherland, R. S. 2004a, ApJS, 153, 9
- Groves, Dopita, & Sutherland (2004) Groves, B. A., Dopita, M. A., & Sutherland, R. S. 2004b, ApJS, 153, 75
- Heckman, Miley, van Breugel, & Butcher (1981) Heckman, T. M., Miley, G. K., van Breugel, W. J. M., & Butcher, H. R. 1981, ApJ, 247, 403
- Kellermann et al. (1989) Kellermann, K. I., Sramek, R., Schmidt, M., Shaffer, D. B., & Green, R. 1989, AJ, 98, 1195
- Kraemer, Crenshaw, Filippenko, & Peterson (1998) Kraemer, S. B., Crenshaw, D. M., Filippenko, A. V., & Peterson, B. M. 1998, ApJ, 499, 719
- Kraemer, George, Crenshaw, & Gabel (2004) Kraemer, S. B., George, I. M., Crenshaw, D. M., & Gabel, J. R. 2004, ApJ, 607, 794
- Laor & Draine (1993) Laor A., Draine B. T., 1993, ApJ, 402, 441(LD)
- Laor et al. (1997) Laor, A., Fiore, F., Elvis, M., Wilkes, B. J., & McDowell, J. C. 1997, ApJ, 477, 93
- Mathews & Ferland (1987) Mathews, W. G. & Ferland, G. J. 1987, ApJ, 323, 456 (MF)
- Moore (1993) Moore C. E., 1993, Tables of Spectra of Hydrogen, Carbon, Nitrogen, and Oxygen Atoms and Ions. CRC Press, Boca Raton, Florida
- Nagao, Murayama, & Taniguchi (2001) Nagao, T., Murayama, T., & Taniguchi, Y. 2001, ApJ, 549, 155
- Netzer & Laor (1993) Netzer, H. & Laor, A. 1993, ApJ, 404, L51
- Netzer et al. (2004) Netzer, H., Shemmer, O., Maiolino, R., Oliva, E., Croom, S., Corbett, E., & di Fabrizio, L. 2004, ApJ, 614, 558
- Neugebauer et al. (1987) Neugebauer G., Green R. F., Matthews K., Schmidt M., Soifer B. T., Bennett J., 1987, ApJS, 63, 615
- Osterbrock (1989) Osterbrock, D. E. 1989, Astrophysics of gaseous nebulae and active galactic nuclei, Publisher: University Science Books, Mill Valley, CA.
- Peterson (1997) Peterson, B. M. 1997, An introduction to active galactic nuclei, Publisher: Cambridge, New York Cambridge University Press, 1997
- Pradhan & Peng (1995) Pradhan A. K., Peng J., 1995, in Space Telescope Science Institute Symposium Series No. 8, ed., Williams R.E., Livio M., Cambridge Univ. Press
- Sanders et al. (1989) Sanders, D. B., Phinney, E. S., Neugebauer, G., Soifer, B. T., & Matthews, K. 1989, ApJ, 347, 29
- Schmidt & Green (1983) Schmidt M., Green R. F., 1983, ApJ, 269, 352
- Schmitt et al. (2003) Schmitt, H. R., Donley, J. L., Antonucci, R. R. J., Hutchings, J. B., Kinney, A. L., & Pringle, J. E. 2003, ApJ, 597, 768
- Scott et al. (2004) Scott, J. E., Kriss, G. A., Brotherton, M., Green, R. F., Hutchings, J., Shull, J. M., & Zheng, W. 2004, ApJ, 615, 135
- Shang et al. (2003) Shang Z., Wills B. J., Robinson E. L., Wills D., Laor A., Xie B., Yuan J., 2003, ApJ, 586, 52
- Shemmer et al. (2004) Shemmer, O., Netzer, H., Maiolino, R., Oliva, E., Croom, S., Corbett, E., & di Fabrizio, L. 2004, ApJ, 614, 547
- Unger et al. (1987) Unger, S. W., Pedlar, A., Axon, D. J., Whittle, M., Meurs, E. J. A., & Ward, M. J. 1987, MNRAS, 228, 671
- Vanden Berk et al. (2001) Vanden Berk, D. E., et al. 2001, AJ, 122, 549
- Véron-Cetty, Joly, & Véron (2004) Véron-Cetty, M.-P., Joly, M., Véron, P. 2004, A&A, 417, 515
- Voit (1992) Voit, G. M. 1992, ApJ, 399, 495
- Wills et al. (1993) Wills, B. J., Netzer, H., Brotherton, M. S., Han, M., Wills, D., Baldwin, J. A., Ferland, G. J., & Browne, I. W. A. 1993, ApJ, 410, 534
- Zheng et al. (1997) Zheng, W., Kriss, G. A., Telfer, R. C., Grimes, J. P., & Davidsen, A. F. 1997, ApJ, 475, 469
Note added in proofs
Schmitt et al. (2003) surveyed with HST the extended [O iii] emission in a sample of 60 nearby Type I/II Seyfert galaxies. They find that the maximum detectable extent of the [O iii] 5007 emission is given by pc (assuming a mean [O iii] 5007 EW of 35 Å to convert their [O iii] 5007 luminosity to our continuum luminosity), which is (fortuitously) very close to our expression for . They also find that most of the [O iii] 5007 emission is significantly more compact, with half of the flux originating within pc, and typically a factor of two less in Type I AGN. This size is within a factor of 2-3 of our single zone .