Abstract
SHADES is a new, major, extragalactic sub-mm survey currently being undertaken with SCUBA on the JCMT. The aim of this survey is to map 0.5 square degrees of sky at a depth sufficient to provide the first, major ( source), unbiased sample of bright ( mJy) sub-mm sources. Combined with extensive multi-frequency supporting observations already in hand, we aim to measure the redshift distribution, clustering and AGN content of the sub-mm population. Currently % complete, the survey is due to run until early 2006. Here I provide some early example results which demonstrate the potential power of our combined data set, and highlight a series of forthcoming papers which will present results based on the current interim sample of m sources detected within the Lockman Hole and SXDF SHADES survey fields.
SHADES: The Scuba HAlf Degree
Extragalactic Survey
1 Survey Rationale

The sub-mm galaxy population continues to present a major challenge to theories of galaxy formation (e.g., Baugh et al. 2004, Somerville 2004), as current semi-analytic models cannot naturally explain the existence of a substantial population of dust-enshrouded starburst galaxies at high redshift. However, while now regarded as of key importance by theorists, the basic properties of sub-mm galaxies are not, in fact, well defined. Several redshifts have been measured (Chapman et al. 2003), some masses have been determined from CO observations (Genzel et al. 2004), and several individual SCUBA-selected galaxies have been studied in detail (e.g., Smail et al. 2003). However, these follow-up studies have had to rely on small, inhomogeneous, and often deliberately biased (e.g., lensed or radio pre-selected) samples of sub-mm sources, and until now no robust, complete, unbiased and statistically significant (i.e., sources) sample of sub-mm sources has been constructed.
SHADES (http://www.roe.ac.uk/ifa/shades), the Scuba Half Degree Extragalactic Survey, was designed to remedy this situation. It aims to map 0.5 square degrees with SCUBA to an r.m.s. noise level of mJy at m. The SHADES consortium consists of nearly the entire UK sub-mm cosmology community, coupled with a subset of the BLAST balloon-borne observatory consortium.
The survey has many goals (see Mortier et al. 2004), but the primary objective is to provide a complete and consistent sample of a few hundred sources with mJy, with sufficient supporting multi-frequency information to establish the redshift distribution, clustering properties, and AGN fraction of the bright sub-mm population. The aim is to provide this information, within the 3-year lifetime of the survey, by co-ordinating the SCUBA mapping observations with (i) deep VLA and Merlin radio imaging, (ii) Spitzer mid-infrared imaging, (iii) far-infrared maps of the same fields made with BLAST, (iv) optical and near-infrared imaging with UKIRT and the Subaru telescope, and (v) deep optical spectroscopy with Gemini, Keck and the VLT.
2 SCUBA mapping
SHADES is split between two fields – the Subaru SXDF field at RA , Dec (J2000), and the Lockman Hole centred on RA , Dec (J2000), with the goal being to map 0.25 square degrees in each. These two fields were chosen both to provide a spread in RA (to allow observation with the JCMT throughout the majority of the year), and because each field offered unique advantages in terms of low Galactic cirrus emission (crucial for BLAST and Spitzer observations) and existing/guaranteed supporting data at other wavelengths.
SHADES SCUBA observations commenced at the JCMT in December 2002. Full details on the observing technique can be found in Mortier et al. (2004).
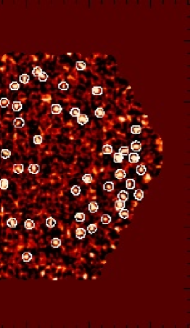
SCUBA Signal-to-Noise maps for the SXDF and Lockman SHADES fields obtained by Spring 2004 are shown in Fig. 1. The total area covered by these two maps is 700 square arcmin (402 square arcmin in the Lockman Hole, 294 square arcmin in the SXDF), of which an effective area of square arcmin has complete coverage.
The survey is therefore complete, and to date has yielded a total of 130 sources, whose reality is confirmed by 4 independent reductions undertaken within the consortium. (61 sources in the SXDF image (24 at , 53 at ) and 69 sources in the Lockman Hole image (22 at , 47 at )). Based on this interim reduction, we predict a final source list of sources.


3 VLA and Spitzer identifications
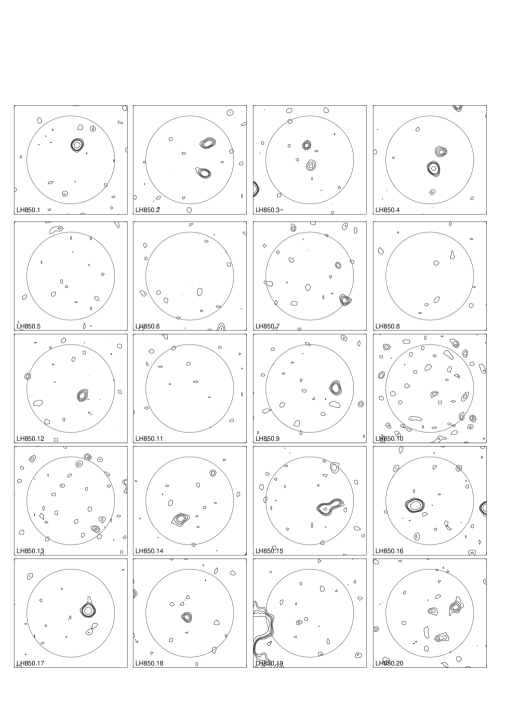
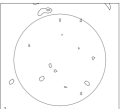
In Fig. 2 we show 20 example arcsec2 postage stamps extracted from our deep VLA 1.4 GHz images of the SHADES fields, centred on the positions of the SCUBA sources. Contours from the radio images are shown at and . The circles have a radius of 8 arcsec, which represents an appropriate search radius for radio counterparts, given the uncertainties in the SCUBA positions. What is striking about this plot is that (i.e., 75%) of these sources have radio counterparts. This figure is significantly higher than found from the radio follow-up of any previous SCUBA survey. Such a high radio-identification rate confirms the reality of the vast majority of the m sources. The fact that the figure is so high will also be in part due to the depth and quality of the radio data, but nevertheless it already seems clear that few of the SHADES sources can lie at redshifts significantly in excess of . A corollary to this is that we can now realistically expect to obtain an accurate ( arcsec) position for the vast majority of the SHADES sources, providing excellent prospects for subsequent unambiguous optical/IR identification, and optical/infrared spectroscopy. Moreover, for those sources which escape optical spectroscopy, the existence of a radio detection will still assist enormously in the derivation of accurate redshift estimates, especially in combination with BLAST and Spitzer data.
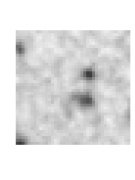
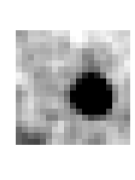
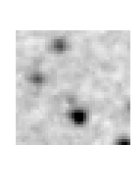
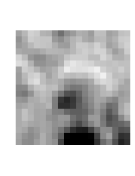
Even the high success rate of radio identification shown in Fig. 3 is not the whole story. The production of lower-resolution B+C array VLA maps (i.e., deliberately leaving out the A-array data) has revealed that even when, at first sight, a source appears to lack a radio identification, often an extended radio counterpart is found to exist in the lower-resolution map (resolved out in the A-array data). An example of this is shown in Fig. 3.
Also illustrated in Fig. 3 is the added value of combining the radio data with Spitzer imaging. Spitzer data for SHADES is being provided for the Lockman Hole field in collaboration with the Spitzer GTO consortium, and for the SXDF as part of the SWIRE survey. Figure 3 shows how these data can help both to differentiate between alternative radio counterparts, and to confirm the reality and dusty nature of tentative radio identifications.
4 Forthcoming papers
Detailed predictions of the extent to which SHADES can constrain the redshift distribution and clustering of submm sources are presented by van Kampen et al. (2004), while an overview of the survey strategy and design is provided in Mortier et al. (2004). In addition, three journal papers based on the current interim dataset are currently in preparation: Scott et al. (2005) will present the current sub-mm maps, source list and number counts, Ivison et al. (2005) will present radio and Spitzer identifications, and Aretxaga et al. (2005) will report the estimated redshift distribution of the current SHADES sample. This first set of data papers will be followed by publication of the full multi-frequency study of SHADES sources, and by a detailed comparison of our results with the predictions of current models of galaxy formation.
Acknowledgements.
I thank the members of the SHADES consortium, and also the staff of the JCMT, for their role in turning SHADES from a simulation into a real data set.1
References
- [1] Baugh C.M., Lacey C.G., Frenk C.S., Granato G.L., Silva L., Bressan A., Benson A.J., Cole S., 2004, MNRAS, in press (astro-ph/0406069)
- [2] Chapman S.C., Blain A.W., Ivison R.J., Smail I., 2003, Nature, 422, 695
- [3] Genzel R., et al., 2004, in: Multiwavelength mapping of galaxy formation and evolution, Bender R., Renzini A., eds., ESO Astroph. Symp., (Springer: Heidelberg), in press (astro-ph/0403183)
- [4] van Kampen E., et al., 2004, MNRAS, submitted (astro-ph/0408552)
- [5] Mortier A., 2004, MNRAS, submitted
- [6] Smail I., Ivison R.J., Gilbank D.G., Dunlop J.S., Keel W.C., Motohara K., Stevens J.A., 2003, ApJ, 583, 551
- [7] Somerville R.S., 2004, in: Multiwavelength mapping of galaxy formation and evolution, Bender R., Renzini A., eds., ESO Astroph. Symp., (Springer: Heidelberg), in press (astro-ph/0401570)