Temperature and polarization angular power spectra of Galactic dust radiation at 353 GHz as measured by Archeops
We present the first measurement of temperature and polarization angular power spectra of the diffuse emission of Galactic dust at 353 GHz as seen by Archeops on 20% of the sky. The temperature angular power spectrum is compatible with that provided by the extrapolation to 353 GHz of IRAS and DIRBE maps using Finkbeiner et al. (1999) model number 8. For Galactic latitudes deg we report a 4 sigma detection of large scale () temperature-polarization cross-correlation and set upper limits to the and modes at . For Galactic latitudes deg, on the same angular scales, we report a 2 sigma detection of temperature-polarization cross-correlation . These results are then extrapolated to 100 GHz to estimate the contamination in CMB measurements by polarized diffuse Galactic dust emission. The signal is then and for and 10 deg. respectively. The upper limit on and becomes . If polarized dust emission at higher Galactic latitude cuts is similar to the one we report here, then dust polarized radiation will be a major foreground for determining the polarization power spectra of the CMB at high frequencies above 100 GHz.
Key Words.:
Cosmic Microwave Background – Cosmology – Observations – Submillimetre – Polarization – Dust – Extinction – Foreground1 Introduction
The Cosmic Microwave Background (CMB) is now considered as one of the most sensitive probes to the physics of the early Universe. A great number of experiments have measured its temperature anisotropy power spectrum over a wide range of angular scales (for a review, see Wang et al. (2003)) until WMAP recently gave a cosmic variance limited estimate up to the rise of the second acoustic peak (Bennett et al. 2003a ).
CMB polarization provides a wealth of complementary information. First, it allows to break degeneracies that remain in the determination of cosmological parameters with temperature anisotropy data alone (see e.g. Zaldarriaga et al. (1997)). Perhaps more importantly, it sheds light directly on inflation through the mode that is generated only by primordial gravity waves produced during that era (Seljak & Zaldarriaga (1997); Kamionkowski et al. (1997)). Distortions of the mode by large scales structures weak lensing also induce a signal, distinguishable from the primordial by its non-gaussianity. This component in turn provides useful information about the dark matter distribution (e.g. Benabed et al. (2001)) and the mass of neutrinos at the precision of 0.04 eV for an experiment e.g. 20 times more sensitive than Planck (Kaplinghat et al. (2003)).
CMB polarization is however 2 to 5 orders of magnitude smaller than temperature anisotropies and therefore still remains to be accurately measured. It is now becoming accessible thanks to improved instrumental sensitivities. The first detection of the mode has been reported by DASI (Kovac et al. (2002)). This result has been confirmed by the same team (Leitch et al. (2004)), CAPMAP (Barkats et al. (2004)) and CBI (Readhead et al. (2004)). WMAP has also provided an estimate of the correlation spectrum (Kogut et al. (2003)) fully compatible with an inflationary scenario.
Instrumental sensitivity is not the only issue in the determination of the power spectrum of the polarized CMB anisotropies. Other astrophysical components also contribute to the sky brightness and polarization at the wavelengths of interest and must be subtracted. These foregrounds, mainly dominated by the diffuse Galactic emission and the one of extragalactic point sources, are often not well constrained or even not experimentally measured in the case of polarization.
Ground based experiments such as those mentionned above observe small regions of the sky. They can then choose them where foregrounds are weak and are less prone to contamination by Galactic emission. It is not the case for full sky experiments such as WMAP and Planck. At the Planck–HFI frequencies and for future bolometer experiments, the dominant component is the radiation from Galactic Interstellar Dust (ISD). The submillimetre and millimetre (hereafter submm) intensity of the ISD emission can be inferred from IRAS and COBE–DIRBE extrapolations (e.g. Finkbeiner et al. (1999), hereafter FDS) and has been measured on large scales by COBE–FIRAS (Reach et al. (1995); Boulanger et al. (1996); Lagache et al. (1998)). However, little is known about ISD polarization emission on scales larger than 10 arcmin, i.e. that are the most relevant for current CMB studies. Indeed, ground–based observations of submm ISD polarization are concentrated on high angular resolution (arcminute scale) star formation regions. Indirect evidence for large scale polarization comes from the polarization of starlight in extinction (Serkowski et al. (1975)), but as reviewed by Goodman (1996), these measurements of background starlight polarization lead to ambiguous interpretation. In particular, the visible data are biased by low column density lines of sight and do not fairly sample more heavily reddened ones. Direct submm measurements are therefore highly required both for Galactic studies of the large scale coherence of the magnetic field and in the field of CMB polarization, but are rather challenging as they require sensitivities comparable to those of CMB studies.
Recently, Benoît et al. 2004a have reported the first measurement of the submillimetre diffuse polarized emission by interstellar dust in the vicinity of the Galactic plane using the Archeops experiment. They show that the Galactic plane is significantly polarized at the 3–5% level and that dense clouds can be polarized up to 10% or more. This indicates that the dust intrinsic radiation is highly polarized and that the grain alignment mechanism is very effective. Considered with the possible large scale coherence of the polarization orientation, it shows that the dust polarized emission could be an important foreground for CMB polarization studies, especially on large angular scales.
Here, we wish to give a first answer to this question with the evaluation of the dust polarization power spectra away from the Galactic plane and in diffuse regions, on angular scales ranging from to . Section 2 briefly introduces Archeops and its polarization capabilities. Section 3 presents the processing applied to the data and Sect. 4 describes the evaluation of the polarized angular power spectra. Section 5 presents our main results. We conclude in Sect. 6 with the extrapolation of our results to lower frequencies where the CMB dominates, to give an estimate of the dust contamination in the measurements of the CMB polarization power spectra.
2 The Archeops instrument
Archeops 111http://www.archeops.org. is a balloon borne bolometer experiment that aimed at measuring the CMB temperature anisotropy over large and small angular scales. It provided the first determination of the spectrum from the COBE multipoles (Smoot et al. (1992)) to the first acoustic peak (Benoît et al. 2003a ) from which it gave a precise determination of the main cosmological parameters, such as the total density of the Universe and the baryon fraction (Benoît et al. 2003b ). Archeops was also designed as a test bed for Planck–HFI and therefore shared the same technological design: a Gregorian off–axis telescope with a m primary mirror, bolometers operating at common frequencies (143, 217, 353 and 545 GHz) cooled down at mK by a 3HeHe dilution designed to work at zero gravity and similar scanning strategy. A detailed description of the instrument and its performances can be found in (Benoît et al. (2002)) and (Benoît et al. 2003b ).
At GHz where dust thermal radiation is dominant, Archeops has 6 bolometers mounted in 3 Ortho Mode Transducer222Planck-HFI has since changed for the Polarized Sensitive Bolometer technology to measure polarization of radiation (hereafter OMT) pairs that are sensitive to polarization in order to study the properties of the polarized dust diffuse radiation. The three OMTs are oriented at 60 degrees from each other to enable the full recovery of the and Stokes parameters and to minimize the correlations in their determination. Archeops was launched on February 7th, 2002, from the CNES/Swedish facility of Esrange, near Kiruna (Sweden). The flight brought about 12 hours of high quality night data.
3 Data processing and map making
A detailed description of the data processing and the polarization map making is given in (Benoît et al. 2003b ) and (Benoît et al. 2004a ).
The main steps on the Archeops data processing are the followings. First, the reconstruction of the pointing during flight, with rms error better than 1 arcmin (Bourrachot (2004)), is performed using the data from a bore–sight mounted optical star sensor aligned to each photometer using Jupiter observations. Second, corrupted data (including glitches and bursts of noise) in the Time Ordered Information (TOI), representing less than 1.5%, are flagged and not considered in the following processing. Third, low frequency drifts on the data, generally correlated to house-keeping information (altitude, attitude, cryostat temperatures, the CMB dipole) are removed using the latter as templates. Fourth, high frequency decorrelation is performed in few chosen frequency intervals of Hz width to remove non-stationary high-frequency noise. Sixth, the corrected timelines are then deconvolved from the bolometer time constant and the flagged corrupted data are replaced by a constrained realization of noise. Finally, low frequency atmospheric residuals and noise are subtracted using a destriping procedure which preserves the sky signal to better than 2% on large angular scales (Bourrachot (2004)). To improve the quality of the removal of atmospheric residuals we have also performed a component separation analysis in the time ordered data using the SMICA-MCMD algorithm (Delabrouille et al. (2003)) over all the Archeops channels. From this analysis we have constructed a template of the atmospheric contribution to the Archeops data which has been fit and removed from each of 353 GHz bolometers preserving the dust emission to better than 5%.
The six bolometers are cross-calibrated as discussed on Sect. 4.3.2. The absolute calibration is obtained from a correlation between the Galactic latitude profiles from FIRAS “dust spectrum” maps and those of Archeops. It has an absolute accuracy of about 12%. This affects only the absolute values of but neither the degree of polarization nor its orientation. A detailed description of the calibration is given in Benoît et al. 2003b .
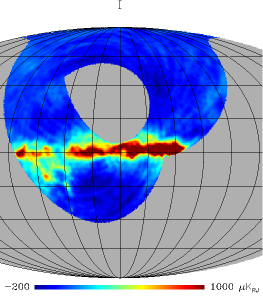
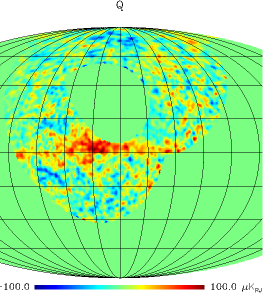
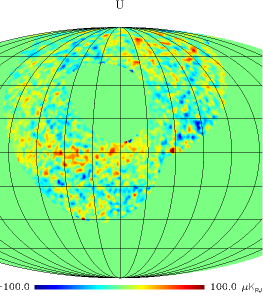
The data processed and calibrated as above have been projected into polarization maps using the algorithm described in Ponthieu (2003). The maps produced are shown on Figs. 1, 2, 3. A significant polarization level in the Galactic plane was first reported by Archeops (Benoît et al. 2004a ) for regions with longitudes between 100 and 120 degrees and between 180 and 200 degrees. The new data processing allows us to reconstruct polarization on all the Galactic plane observed by Archeops and to fill the gap between 120 and 180 degrees.
The noise correlation matrix on those maps have been computed using pure noise simulations which are described in Sect. 4.2.
4 Evaluation of the polarization power spectra
4.1 Formalism
For a direction of observation , we define the Stokes parameters , and in the tangential plane with respect to . The angle of the polarization is oriented from the North Galactic pole through East to the South Galactic pole (counterclockwise).
For statistical analysis, the use of and (Seljak & Zaldarriaga (1997)) is however more suitable because these quantities are scalar and independent of the coordinate system. We here estimate these quantities and the correlation between and using the method described in Chon et al. (2004). The spin-2 nature of Stokes parameters leads us to define
| (1) |
When the polarized two point correlation functions are estimated in real space between two directions and , one has to rotate by angles and respectively to align the axes defining for each direction of observation with the geodesic connecting and such that
| (2) | |||||
| (3) |
We then define the correlation functions
| (4) | |||||
| (5) | |||||
| (6) | |||||
where and are the reduced Wigner -matrices. The s angular power spectra are then obtained by the following integration:
| (7) | |||||
| (8) | |||||
| (9) |
We estimate those quantities with the software SpicePol (Chon et al. (2004)) that uses the HEALPix package (Gorski et al. (1998)) to compute the pseudo-s from the raw maps : , , , from which we obtain an estimate of the signal plus noise angular power spectra. The noise contribution is estimated through Monte-Carlo simulations (Sect. 4.2) and subtracted, producing estimates of the angular polarized power spectra. Because of approximations used by SpicePol it can not produce estimates of and .
The total uncertainty on the determination of the power spectrum includes both the variance of the noise and the variance of the signal itself. In the case of Galactic dust, there is no cosmic variance stricto sensu. Indeed, the dust distribution in the sky and its properties are not a particular realization of a Gaussian random field like in the case of the CMB anisotropies. Therefore, we compute the variance of the polarized power spectra considering only the noise-noise and the signal-noise contributions, and not the signal-signal covariance (sample variance) as follows
| (10) | |||||
| (11) | |||||
where stands for , or , is the noise and is the fraction of the sky taken for the analysis. The dominant term in Eq. (11) is the product of the covariance of temperature by the polarization noise . These relations are however only handy approximations to the true uncertainties and need an empirical adjustment of the parameter that is performed using the simulations described in Sect. 4.2. These simulations are also used to compute the noise power spectra.
The temperature power spectrum and its error bars are computed using the Xspect method (Tristram et al. (2004)) which uses 15 cross power spectra from the six detectors and no auto power spectrum in order to avoid corrections induced by the detector noise.
4.2 Instrumental noise
The noise power spectrum of the bolometers is estimated from a four step process already applied in Benoît et al (2003a) in the context of the evaluation. First, the Galactic plane region is masked and interpolated in the time domain with slowly varying functions. Secondly, these timelines are projected onto maps that are deprojected to obtain a second timeline with a higher signal to noise ratio. We then subtract this second timeline from the original one to obtain a noise dominated timeline and compute its time domain power spectrum. Simulations including realistic noise and Galactic contamination show that this process allows the recovery of the true noise power spectrum at the 5% level.
From these time domain noise power spectra, we generate noise timelines for the six polarized bolometers and project them onto maps in the same way as the real data. The same statistical analysis as the one applied to the data is performed on 250 of such noise maps to have a good estimate of the noise angular power spectra. These power spectra are then subtracted from the Archeops polarized angular power spectra in order to correct them from the noise bias. Finally, we compute the uncertainties on the polarization power spectra using equations (10) and (11).
4.3 Systematic effects
Three main sources of systematic effects are likely to affect the evaluation of the polarization correlations: the filtering applied to the data, the uncertainty on the cross-calibration between the detectors and the uncertainty on the knowledge of the exact orientation of the polarizers on the focal plane. We address these three issues separately.
4.3.1 Filtering
A bandpass filtering is applied to the data. The lower frequency bound is Hz, which corresponds to the first harmonic of the rotation of the gondola (2 rpm). Because of the spinning of the instrument, few physical components at frequencies below in the timeline are projected on the map. The high pass therefore ensures that no physically irrelevant and dipole-like components remain in the timelines. A low pass filtering is then applied to the timelines at Hz to remove high frequency noise. To correct from this effect on the angular power spectra we have computed an effective filtering function in the multipole space from simulations of temperature Gaussian fields with a flat power spectrum. The maximum correction is at low and is less than 2%.
We have also checked that the filtering did not induce any spurious polarization such as leaks from total intensity into polarization. For this we have applied the bandpass filter to simulated timelines, deprojected from the FDS template at 353GHz, for the six bolometers involved in the determination of the angular power spectra. Then, we have reconstructed , and maps for which we have extracted the temperature and polarization power spectra. No spurious polarization was produced at the level of 0.1%.
4.3.2 Cross calibration
Stokes parameters are mainly estimated from the differences of the outputs of bolometers that measure orthogonal polarization states. An error in the cross calibration between detectors generates a systematic leak of total intensity into polarization. The cross calibration of Archeops channels is described in details in Benoît et al. 2004a and relies on the scaling of Galactic intensity profiles computed from each bolometer. The cross calibration coefficients are then determined at the 2% level. In order to give a conservative upper limit to the effect of this uncertainty on the angular power spectra, we forced the cross calibration coefficients to values which deviate by 2% and maximized the relative difference between two orthogonal photometers. The angular power spectra were then estimated with this new set of coefficients and the error bars were derived from the standard deviation of 200 simulations, assuming a symmetric uncertainty. This uncertainty is about 5% of the statistical error bars.
4.3.3 Polarizer relative orientation
The accurate positioning of the polarizers in the focal plane is made difficult by the complexity of the instrument. We therefore checked that they were correctly placed during the pre–flight ground calibrations and found that they were indeed in their nominal configuration with a uncertainty of degrees. A mismatch between the assumed and the real orientations of the polarizers generates a relative error of a few percents on the reconstructed Stokes parameters (Kaplan et al. (2001)). In order to estimate the error induced by the uncertainty of the knowledge of the accurate positionning of the polarizers, we have performed simulations in which these angles are forced to random values different from those used for the , , reconstruction. The resulting uncertainty is of the same order as that of the cross calibration uncertainty, that is to say about 5% of the statistical error bars.
5 Results
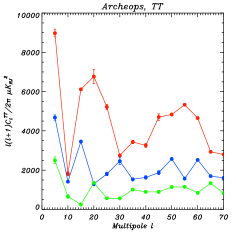
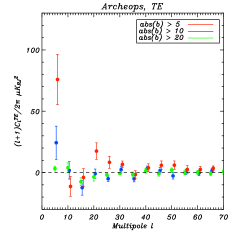
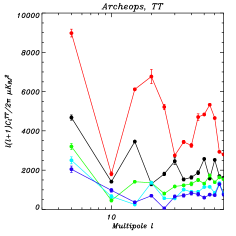
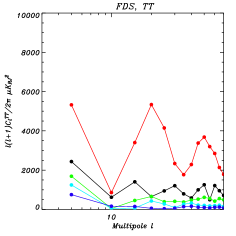
We estimate the angular power spectra as a function of cuts of the data in Galactic latitude in order to remove the effects of regions with the strongest dust emission along the Galactic plane. Figure 4 gives the power spectra for , , and . The spectrum for oscillates as a function of , with the amplitude of oscillation increasing with decreasing . These features are consistent with a Galactic origin for the signal as discussed in Sect. 5.1.1.
The Spectrum: on large angular scales there is a detection for with a magntidue of and a detection for with a magnitude of . For there is also a detection for , corresponding to a peak in the temperature spectrum at the same bin.
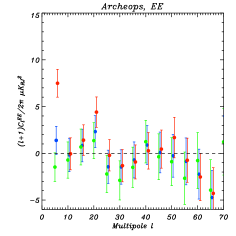
The Spectrum: on large angular scales there is a detection for with a magnitude of and a for . Otherwise, the power in the spectra is consistent with zero for all ’s for and for and at for all latitude cuts. Similar to the spectrum, the power measured for on all scales decreases with increasing latitude, which is consistent with a Galactic origin for the signal.
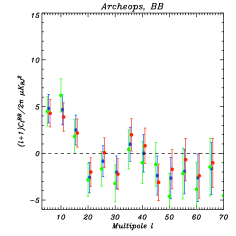
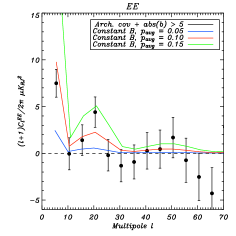
The Spectrum: there are detections of power in the first few bins and the spectrum is consistent with no power for . The power at the low bins does not depend on Galactic latitude cut. We argue below that models of polarization from dust emission predict a decrease of power in both the and spectra with Galactic latitude cut and therefore the signal at low is probably spurious. Unlike the CMB for which and have different physical sources, dust is expected to produce comparable amounts of and . Assuming a similar level of and and interpreting the data in terms of upper limits we provide a common upper limit to both modes at at 353 GHz for .
Since the Archeops data probe the dust diffuse emission and not local clouds in the Galactic plane it is likely that the orientation and coherence of the magnetic field is similar for latitudes larger than 5 and larger than 10 deg. Therefore, the more dust there is along the line of sight, the more intense the emission should be, and the more power we expect in the temperature and polarization spectra. According to these arguments there should be a monotonous decrease of power in the spectra with increasing latitude cuts, as observed for the , and data.
5.1 Comparison with models
In this section we compare our results to models of diffuse Galactic dust emission. First, we compare the power spectrum to those expected using a Galactic cosecant-law model and using the FDS model. Second, we obtain an alternative estimate of the TE spectrum by cross-correlating the FDS template with the Archeops Q and U maps. Finally, we compare the measured spectra to those calculated on the basis of a simplified physical model of polarized emission from dust.
5.1.1 Pure cosecant-law Galactic emission
Due to the disk geometry of the Galaxy, the integrated emission along a given line of sight increases as the absolute value of the latitude decreases. This is well approximated by a cosecant law of the form . When this Galactic contribution is subtracted, the angular power spectrum of the remaining diffuse dust has the form (Gautier et al. (1992); Wright (1998)).
We choose to leave the Galactic contribution in our data such that we can assess its magnitude and its potential contamination of CMB polarization experiments. (see Sect. 6). In order to estimate the influence of a cosecant law component in our data, we simulate such an emission analytically and with an amplitude compatible with the FDS template. The results are presented on Fig. 5 where we plot the angular power spectrum at different Galactic latitude cuts for the Archeops data, for the cosecant-law model and for the FDS template. There is a qualitative agreement between the oscillation pattern of the Archeops data for low Galactic latitude cuts and the pattern present for the cosecant-law model and for the FDS template. The agreement suggests that the cosecant-law emission dominates the observed Galactic dust emission at large angular scales.

5.1.2 -Archeops correlation
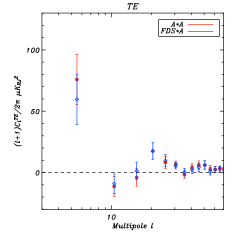
It is interesting to correlate the Archeops and data with available dust intensity maps. We quantify the correlation by calculating the cross-spectrum between the two data sets. This idea has already been succesfully applied to temperature anisotropy data sets (Abroe et al (2004); Tristram et al. (2004). For dust intensity we use the FDS template, based on IRAS m maps and extrapolated to 353 GHz (“model number 8”) (Finkbeiner et al. (1999)). We found that this model fits the Archeops temperature data at 353 GHz with fractional deviations of less than 20%. Figure 6 shows that the “FDSArcheops” cross-spectrum (in blue) and the “ArcheopsArcheops” power spectrum (in red) are consistent within the error bars. This result provides additional confidence that the detection of power in the ArcheopsArcheops spectrum at low is due to polarized dust and is not spurious. We note that the cross-spectrum with the FDS map avoids correlated noise that is inherent in the ArcheopsArcheops spectrum and thus the agreement between the two results suggests that correlated noise did not induce spurious results.
5.1.3 Comparison to a simple physical model of Galactic dust polarization
In a given direction of observation, the measured Stokes parameters are the result of the integral along the line of sight of the local Stokes parameters. These, in turn, depend on the local alignment of dust grains with the magnetic field and on the intrinsic degree of polarization. Precise modelling of the diffuse emission due to dust and its polarized angular power spectra is a complex problem. Previous work has shown that on large scales, the alignement of dust grains was compatible with a Galactic magnetic field aligned with the spiral arms (Fosalba et al. (2002); Benoît et al. 2004a and references therein). However, such work relate to data at low Galactic latitudes deg, and the extrapolation at higher latitudes yet remains uncertain due to lack of data. We here use a toy model of extrapolation at high latitudes of these polarization properties that gives qualitative agreement with the Archeops data.
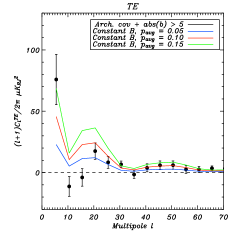
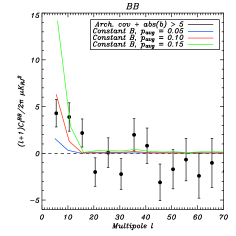
Since we are here looking at latitudes away from the Galactic plane, most of the dust that is being probed is in our vicinity. Typically, if we take the Galactic disk to be 200 pc thick, a line of sight at deg exits the plane at kpc from the observer. This is small compared to the size of the spiral arm in which we are located, and we therefore assume that the large scale magnetic field component aligned with the local spiral arm is along a constant direction on this portion of space. A realistic model would of course consider turbulence, but we are only interested here in a first order approximation. Based on Benoît et al. 2004a who showed that dust diffuse emission in the vicinity of the Galactic plane was polarized at the 5% level, and that some dense clouds were polarized at more than 10%, we present in Fig. 7 results with three assumptions for the level of polarization of Galactic dust: and 15%. We have only considered latitude cuts of deg. Given the simplicity of the model, the relative agreement between the data and the shape and amplitude of the models is encouraging.
6 Dust contamination in CMB polarization estimates
Our results can be used to estimate the contamination of dust to CMB polarized angular power spectra. For this we need to extrapolate our measurements at 353 GHz to lower frequencies where the CMB is usually measured since it is where it is more intense.
Note that this extrapolation concerns large dust grains only. It does not take into account the so-called “anomalous emission”, since (1) the latter does not contribute significantly at 353 GHz and (2) it is likely not to be polarized (e.g. Lazarian & Prunet (2001)). Dust thermal radiation is the dominant foreground at frequencies above GHz. At high frequencies it has long been described by a single grey body at a temperature of 17.5 K with a emissivity (Boulanger et al. (1996)). At low frequencies ( to GHz), the spectrum is not well constrained due to the lack of accurate measurements. We need to use the FIRAS and WMAP data jointly. The FIRAS data are used to compute the intensity value at 353 GHz and the WMAP data give the intensity value at 94 GHz. This then allows to derive the dust radiation spectral index.
To determine these dust intensities we use the method described in Lagache (2003) and derive the spectrum of the dust whose emission is correlated with the HI gas, using FIRAS and WMAP data in the Archeops region. We obtain a ratio corresponding to a spectral index of 1.7 that we use in the following. Note that this value is very stable when different (large) regions of the sky are averaged. This is also the same value as the one obtained by Finkbeiner et al (1999) in this frequency range (see discussion in Finkbeiner (2004)). Using this spectral index of 1.7, we find for the largest angular scales (), and for and 10 deg. respectively at 100 GHz.
These results suggest that dust may be a very significant foreground for measurements of the CMB polarization angular power spectra, particularly if they include Galactic latitudes below degrees. However, these measurements must be interpreted with care when considering the entire sky. Our data includes only of the sky and generalization to the entire sky is questionable because of the complexity of the statistical properties of dust.
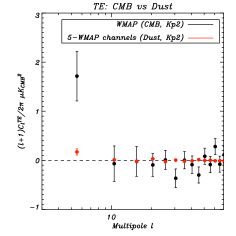
It is interesting to consider the relation between our results and those of the WMAP team. By combining data from five frequency bands at lower frequencies (23, 33, 41, 61 and 94 GHz) and for the entire sky the WMAP team has computed a value for the spectrum at of . Accurate extrapolation of the Archeops results into the WMAP data is complicated and is beyond the scope of this paper. (For example, it would require a detailed knowledge of the component separation methods, the relative weighting of the frequency bands and the shape of the beam). However, it is easy to illustrate that combining data at lower frequencies reduces the effects of dust substantially. We extrapolate our results to the WMAP frequency bands with a constant emissivity spectral index of 1.7 in antenna temperature. We use an equal weight per frequency and use only the area of the sky that overlaps the Archeops data and WMAP’s Kp2 mask. The result of this extrapolation is presented on Fig. 8. On scales of we find , which is about a factor of 10 smaller than both our estimate at 100 GHz, and WMAP’s reported result.
When extrapolated to 100 GHz the upper limits that we found on the and modes for become . We note that the CMB mode is expected to be at most at , if the reionization optical depth is as high as (Spergel et al. (2003)) and if the tensor to scalar ratio is the highest compatible with current CMB temperature anisotropy measurements. If the actual level of polarized dust over most of the sky is close to the upper limit we found in this work then a subtraction of a large foreground signal will be necessary even at 100 GHz in order to detect the primordial gravitational waves on large angular scales.
7 Conclusions
In this paper we have presented the first measurements of the angular power spectra of the Galactic dust polarized diffuse emission on approximately 20% of the sky at 353 GHz by Archeops. On angular scales , we obtain a detection of for deg. On the same angular scales and for , we have a detection . This decrease in power is expected from the cosecant behaviour of the large scale component of the total intensity, which is shown to dominate the total intensity angular power spectrum.
On the same sky coverage and for all angular scales , we set upper limits to the and polarization at . These results have been confirmed by using a template of the Galactic dust intensity from Finkbeiner et al (1999) in place of the Archeops total intensity map to compute the angular power spectrum. This spectrum agrees with the one derived from Archeops data alone on all angular scales within .
Furthermore, the high degree of polarization seen in the Galactic plane by Benoît et al (2004a) together with a simple model of the Galactic magnetic field and the alignment of dust grains, leads to estimates that are compatible with the data.
To estimate the contribution of Galactic dust to the measurement of polarized CMB anisotropies, we have extrapolated our results to the reference frequency 100 GHz, using a spectral index of 1.7, derived from FIRAS and WMAP data on the Archeops sky coverage. The mode becomes and on for and 10 deg respectively. The upper limit on the and modes becomes . These values show that even at 100 GHz where dust radiation is expected to be lower than the CMB, its polarization may be very significant compared to the CMB and should be subtracted with care from the observations.
The effects of the polarization of dust are less severe at low frequencies. When extrapolating our measurements at 353 GHz to 20 GHz with the constant spectral index 1.7 and weighting the 5 WMAP frequencies equally we find a level of for on the intersection between WMAP’s Kp2 mask and Archeops sky coverage. This is about a factor of 10 smaller then the WMAP team results.
The high level of polarization measured at 353 GHz by Archeops and anticipated at the reference frequency of 100 GHz, together with the uncertainties on dust spectral index and the extrapolation of its statistical properties to the whole sky call for further precise studies in order to subtract it precisely from CMB data. This is even more critical for the detection of the imprint of the primordial gravitational waves on the CMB mode, that is expected to be much smaller than the present upper limit on dust polarization.
Acknowledgements.
We would like to pay tribute to the memory of Pierre Faucon who led the CNES team on this successful flight. The HEALPix package was used throughout the data analysis Gorski et al. (1998). We also thank A. Starobinsky for fruitful discussions.References
- Abroe et al (2004) Abroe, M. E., Borrill, J., Ferreira, P. G., et al, 2004, ApJ, 605, 607-613
- Barkats et al. (2004) Barkats, D., Bischoff, C., Farese, P., et al., astro-ph/0409380
- Benabed et al. (2001) Benabed, K., Bernardeau, F., van Waerbeke, L., 2001, Phys. Rev. D, 63, 043501
- (4) Bennett, C. L., Hinshaw, G., Spergel, D. N, et al., 2003, ApJS, 148, 135H
- (5) Bennett, C. L., Hill, R. S., Hinshaw, G., et al., 2003, ApJS, 148, 97B
- Benoît et al. (2002) Benoît, A., Ade, P., Amblard, A., et al., 2002, Astropart. Phys. 17, 101
- (7) Benoît, A., Ade, P., Amblard, A., et al. 2003a, A&A. 399, L25
- (8) Benoît, A., Ade, P., Amblard, A., et al. 2003b, A&A. 399, L19
- (9) Benoît, A., Ade, P., Amblard, A., et al., 2004, A&A, 424, 571
- (10) Benoît, A., Ade, P., Amblard, A., et al. 2004b, in preparation
- Boulanger et al. (1996) Boulanger, F.; Abergel, A.; Bernard, J.-P, et al., 1996, A&A.,312, 256
- Bourrachot (2004) Bourrachot, A., 2004, PhD thesis, Université Paris VII
- Chon et al. (2004) Chon, G., Challinor, A., Prunet, S., Hivon, E., Szapudi, I., 2004, MNRAS, 350, 914
- Delabrouille et al. (2003) Delabrouille, J., Cardoso, J. F. and Patanchon, G., 2003, MNRAS, 346, 1089
- Fosalba et al. (2002) Fosalba P., Lazarian A., Prunet S., Tauber J. A, 2002, ApJ, 564, 762
- Gautier et al. (1992) Gautier, T. N.I., Boulanger, F., Perault, M., Puget, J.L., 1992, ApJ, 103, 1313.
- Goodman (1996) Goodman A. A., 1996, in Proc. Polarimetry of the Interstellar Medium, ASP Conference Series, eds. W. G. Roberge and D. C. B. Whittet, Vol. 97, 325.
- Gorski et al. (1998) Gorski, K. M. , Hivon, E., Wandelt, B. D., et al. 1998, Proceedings of the MPA/ESO Conferece on Evolution of Large-Scale Structure: from Recombination to Garching 2-7 August 1998; eds. A.J. Banday, R.K. Sheth and L. Da Costa, astro-ph/9812350, http://www.eso.org/science/healpix
- Heiles (1996) Heiles, C., in ASP Conf. Ser. 97, Polarimetry of the Interstellar Medium, ed. W. G. Roberge & D. C. B. Whittet, (San Francisco:ASP), 457
- Finkbeiner et al. (1999) Finkbeiner, D. P., Davis, M., Schlegel, D., 1999, ApJ, 524, 867
- Finkbeiner (2004) Finkbeiner, D. P., 2004, ApJ, 614, 186
- Kamionkowski et al. (1997) M. Kamionkowski, A. Kosowsky, A. Stebbins, Phys. Rev. D, 55, 7368, (1997)
- Kaplan et al. (2001) J. Kaplan, J. Delabrouille, Proceedings of the “Astrophysical Polarized Foregrounds”, 6-12 October 2001, Bologna, Italy
- Kaplinghat et al. (2003) Kaplinghat, M., Knox, L., Song, Y.-S., 2003, Phys. Rev. Lett., 91, 241301
- Kogut et al. (2003) Kogut, A., Spergel, D. N., Barnes, C., 2003, ApJ Suppl. 148, 161
- Kovac et al. (2002) J. Kovac, E. M. Leitch, C. Pryke, et al., Nature, 420, 772, (2002)
- Lagache et al. (1998) Lagache, G., Abergel, A., Boulanger, F., Puget, J. L., 1998, A& A, 333, 709
- Lagache (2003) Lagache, G., 2003, A& A, 2003, 405, 813L
- Leitch et al. (2004) Leitch, E., Kovac, J., Halverson, N., et al., astro-ph/0409357
- Lesgourgues et al. (2000) Lesgourgues, J., Polarski, D., Prunet, S., Starobinsky, A., 2000, AA, 359, 414
- Ponthieu (2003) N. Ponthieu, On behalf of Archeops collaboration, proceedings of the Workshop “The Cosmic Microwave Background and its Polarization”, Minneaolis, March 2003, New Astronomy Reviews, Eds. S. Hanany and K. Olive.
- Lazarian & Prunet (2001) Lazarian, A., Prunet, S., 2001, Astrophysical Polarized Foregrounds, AIP conf. proceedings, eds. S. Cecchini, S. Cortiglioni, R. Sault, and C. Sbarra.
- Reach et al. (1995) Reach, W. T., Dwek, E., Fixsen, D. J., et al., 1995, ApJ, 451, 188
- Readhead et al. (2004) Readhead, A., Myers, S., Pearson, T., et al., Science, 306:836–844, astro-ph/0409569
- Seljak & Zaldarriaga (1997) Seljak, U., Zaldarriaga, M., 1997, PRD 55, 1830
- Serkowski et al. (1975) Serkowski, K., Mathewson, D. S., Ford, V. L., 1975, ApJ. 196, 261
- Smoot et al. (1992) Smoot, G. F., Bennett, C. L., Kogut, ., et al., 1992, ApJ, 396, L1
- Spergel et al. (2003) Spergel, D. N., Verde, L., Peiris, H. V., et al., 2003, ApJS, 148, 175
- Tristram et al. (2004) M. Tristram, J. F. Macías-Pérez, C. Renault, D. Santos, astro-ph/0405575
- Tristram et al. (2004) M. Tristram, G. Patanchon, J. F. Macías-Pérez, et al, astro-ph/0411633
- Wang et al. (2003) Wang, X., Tegmark, M., Jain, B., Zaldarriaga, M., 2003, Phys. Rev. D., 68, 123001
- Wright (1998) Wright, E.L., 1998, ApJ, 496, 1.
- Zaldarriaga et al. (1997) Zaldarriaga, M., Spergel, D. N., Seljak, U., 1997, ApJ, 488, 1