The first detection of [O iii] emission from high–redshift damped Lyman– galaxies††thanks: Based on observations made at the European Southern Observatory Very Large Telescope, Paranal, Chile (ESO Programs 63.O-0618 and 65.O-0707)
Abstract
We present the detection of [O iii] emission lines from the galaxies responsible for two high–redshift damped Lyman– (DLA) absorption lines. We find two sources of [O iii] emission corresponding to the DLA absorber towards the quasar Q 22061958, and we also detect [O iii] emission from the galaxy responsible for the DLA absorber towards the quasar 2233.91381. These are the first detections of rest–frame optical emission lines from high–redshift DLA galaxies. Unlike the Ly line, the [O iii] line provides a measure of the systemic velocity of the galaxy. We compare the [O iii] redshifts with the velocity profile of the low–ionisation metal lines in these two absorbers, with the goal of distinguishing between the model of Prochaska and Wolfe of DLA absorbers as large rapidly rotating cold thick discs, and the standard hierarchical CDM model of structure formation, in which DLAs arise in protogalactic fragments. We find some discrepancies with the predictions of the former model. Furthermore the image of the DLA galaxy towards Q 22061958 shows a complex disturbed morphology, which is more in accord with the hierarchical picture. We use the properties of the rest–frame optical emission lines to further explore the question posed by Møller et al.: are high–redshift DLA galaxies Lyman–break galaxies (LBGs) selected by gas cross section? The measured velocity dispersions of the DLA galaxies are in agreement with this picture, while the data on the [O iii] luminosities and the velocity differences between the Ly and [O iii] lines are inconclusive, as there are insufficient LBG measurements overlapping in luminosity. Finally we estimate the star formation rates in these two DLA galaxies, using a variety of diagnostics, and include a discussion of the extent to which the [O iii] line is useful for this purpose.
keywords:
galaxies: kinematics and dynamics – galaxies: formation – galaxies: high redshift – quasars: absorption lines – quasars: individual(Q 22061958, 2233.91381)1 Introduction
The damped Lyman– (DLA) absorption lines detected in the spectra of quasars identify gas clouds that contain the majority of the neutral hydrogen in the Universe. Analysis of statistical samples of DLA absorbers has been used to study the cosmic history of star formation (e.g. Pei, Fall, and Hauser, 1999), and of metal production (Kulkarni and Fall, 2002). We are engaged in a programme to identify the galaxies (hereafter ‘DLA galaxies’) responsible for the DLA lines at high redshifts, (Warren et al., 2001; hereafter W01). The principal goal of this programme is to establish the connection between the population of DLA absorbers, and galaxy populations identified at high redshifts in deep imaging studies, firstly by comparing the measured properties of the detected DLA galaxies with the properties of other galaxy populations (Møller et al., 2002; hereafter M02), and secondly by measuring the gas cross sections of the absorbers, thereby establishing their space density (Fynbo, Møller, & Warren, 1999; Chen & Lanzetta, 2003).
DLA galaxies are difficult to identify because they typically lie at angular separations of order one arcsec from the quasar line of sight, and are therefore swamped by light from the quasar. We are aware of only eight high–redshift DLA galaxies with published spectroscopic confirmation of the redshift111as well as three unpublished (Djorgovski, private communication). For reference, we have summarised details of these detections in Table 1. In successive columns are listed (1) the quasar name; (2) the quasar redshift ; (3) the DLA redshift ; (4) a flag Y if , N otherwise (); (5) the column density ; (6) a flag Y if (the definition of DLA of Wolfe et al. 1986), N otherwise; (7) the metallicity, if an accurate Si or Zn value is available; (8) the reference for the metallicity; (9) the Ly luminosity; and (10) the reference of the discovery paper. We treat all these sources as DLA galaxies, but note that different individuals adopt narrower definitions of a DLA absorber dependent on the flags in columns (4) and (6), so that under the narrowest definition only three sources are DLA galaxies. For a discussion of the cases where , see Møller, Warren, and Fynbo (1998). Five of the DLA galaxies listed in Table 1 were discovered with telescopes of 4m–class, or smaller (the remaining three are from the current programme). Motivated by the high spatial resolution of HST, and the large light–gathering power of 8m–class telescopes, we are undertaking a survey to detect a significant sample of DLA galaxies (W01). We have obtained deep HST NICMOS and STIS images of the fields of 16 quasars, aimed at the detection of counterpart galaxies of 18 DLA absorbers and five Lyman–limit systems. In the NICMOS images we found 41 candidate DLA galaxies brighter than , within a box of side arcsec centred on each quasar (W01). We are using the VLT and Gemini telescopes to obtain confirmatory optical and near–ir spectra of these candidates.
| 1 | 2 | 3 | 4 | 5 | 6 | 7 | 8 | 9 | 10 |
| Quasar | ) | ) | [M/H] | M (refs) | Ly Lum | Original | |||
| cm-2 | cm-2 | erg s-1 | Discovery | ||||||
| PHL 1222 | 1.922 | 1.9342 | N | 20.36 | Y | — | — | [12] | |
| PKS 045802 | 2.286 | 2.0395 | Y | 21.65 | Y | Zn,Zn [5],[14] | [9] | ||
| PKS 0528250 | 2.797 | 2.8110 | N | 21.35 | Y | Si,Zn [7],[5] | [10] | ||
| PC 09534749 | 4.457 | 3.407 | Y | 21.2 | Y | Si[15] | [1] | ||
| Q 2059360 | 3.097 | 3.0825 | N | 20.85 | Y | — | — | [a,6] | [13] |
| Q 22061958 | 2.559 | 1.9205 | Y | 20.65 | Y | Si, Zn [14],[5] | [b] | [11] | |
| 2233.91318 | 3.298 | 3.1501 | Y | 20.00 | N | Si [c,8] | [2] | ||
| DMS 22470209 | 4.36 | 4.097 | Y | — | — | — | — | [4] | [3] |
Notes: [a] assumes a total flux erg s-1 cm-2, [b] this is the luminosity of N-14-1C, [c] lower and upper limits provided by ref.[8]. All values in columns 2, 3, 5 are taken from the summary of Warren et al. (2001), except for Q (taken from [7]), and for DMS (taken from [3]). The fluxes used to compute the luminosities are taken from the discovery paper, unless referenced otherwise. References are as follows: [1] Bunker et al. (2005, in prep.), [2] Djorgovski et al. (1996), [3] Djorgovski et al. (1998), [4] Djorgovski (private communication), [5] Kulkarni and Fall (2002), [6] Leibundgut and Robertson (1999), [7] Lu et al. (1996), [8] Lu et al. (1998), [9] Møller, Fynbo & Fall (2004), [10] Møller & Warren (1993), [11] Møller et al. (2002), [12] Møller, Warren & Fynbo (1998), [13] Pettini et al. (1995), [14] Prochaska et al. (2003a), [15] Prochaska et al. (2003b).
In M02, we reported preliminary results from this programme. We tested the hypothesis that DLA galaxies are Lyman–break galaxies, selected by gas cross section, by comparing several emission properties (size, colour, etc.) of three high–redshift DLA galaxies with the emission properties of Lyman–break galaxies of similar absolute magnitude and redshift. We found no significant differences and concluded that the data are consistent with the hypothesis posed. It must be appreciated, though, that the hypothesis that the two populations are drawn from the same parent population, with different selection criteria, allows for the possibility that the average properties of the population (e.g. their clustering amplitude) will differ. This will be true, for example, for any quantity that depends on luminosity, since the average luminosities of the two populations differ, due to the way they are selected. As noted by M02, the key to confirming the hypothesis conclusively is the detection of more DLA galaxies, which will allow the measurement of the relation between gas radius and galaxy luminosity, the Holmberg relation . The Holmberg relation provides the transformation between the luminosity distributions of the two populations (see Fynbo et al. 1999 for further explanation).
In this paper we report the detection of rest–frame optical emission lines from two DLA galaxies, with near–ir spectroscopy. These are the first detections of this kind222The detection of H and [O ii] reported by Elston et al., 1991, was not confirmed (Lowenthal, private communication).. The galaxies are two of the three studied in M02 (for the third, all the strong rest–frame optical emission lines lie at highly unfavourable wavelengths for observation). We use these results to extend our comparison of the properties of DLA galaxies and LBGs (of similar absolute magnitude and redshift) to include the rest–frame optical line luminosities and widths.
In the CDM scheme for the formation of structure in the Universe, galaxies grow hierarchically, and DLA absorption lines at arise when sightlines pass through protogalactic fragments. Prochaska and Wolfe (1997b) have argued for a very different picture, showing that that the detailed velocity structure of the low–ionisation metal absorption lines in DLA systems is consistent with the expectation for sightlines passing through large rapidly–rotating cold thick discs of neutral gas. However, it was subsequently shown by Haehnelt, Steinmetz, and Rauch (1998) that the absorption–line kinematic data alone do not permit an unambiguous interpretation, and are equally well explained by the dynamics of merging protogalactic fragments. Our detections of rest–frame optical emission lines from DLA galaxies provide important additional clues for the interpretation of the kinematics of these systems, supplementing the information provided by the absorption–line velocity profiles, and casting new light on this long–standing debate. In the same context we note that additional evidence in favour of the hierarchical picture comes from recent observations of the evolution of the sizes of galactic stellar disks (Ferguson et al., 2004, Bouwens et al., 2004), and comparison against predictions of the extent of the baryons in galaxies, as a function of redshift (Fall and Efstathiou, 1980, Mo, Mao, and White, 1998). All the same these analyses rely on assumptions about the extent to which stars map the baryons at any redshift. The analysis of the kinematics of DLA absorbers complements this approach.
The layout of the paper is as follows: in Section 2 we describe the observations and the data reduction; in Section 3 we present the measured properties of the detected lines; in Section 4 we analyse the kinematics of these systems, and in Section 5 we compare the measured properties of the detected galaxies against the properties of LBGs. In section 6 we estimate the star formation rates in these two DLA galaxies, using a variety of diagnostics. Section 7 provides a summary of the main results of the paper. Throughout, we assume a standard, flat CDM cosmology with and H km s-1 Mpc-1. For this cosmology an angle of 1 arcsec corresponds to the physical size 8.4 kpc at , and 7.7 kpc at .
2 Observations and data reduction
2.1 Observations
The observations were taken with the Infrared Spectrometer and Array Camera (ISAAC) instrument on the European Southern Observatory’s 8m UT1 telescope at the Very Large Telescope (ESO–VLT). We used the medium–resolution (MR) mode, with a arcsec slit, to obtain near–ir spectra of a number of targets in the NICMOS candidate list from W01. Results for three candidates are reported here. Results for other candidates will be reported elsewhere. We observed two candidates in the field of the quasar Q 22061958, in the H band, where the MR mode provides a wavelength coverage of m, with 1024 pixels, at a resolving power of 2700 for this slit, corresponding to 7 pixels. The third target was the known DLA galaxy in the field of the quasar 2233.91318 (Djorgovski et al., 1996, and see Table 1), which was observed in the K band, where the MR mode provides a wavelength coverage of m, at a resolving power of 2750, corresponding to 7 pixels. The spatial scale is arcsec per pixel. For spectroscopy in the near–ir it is common practice to nod the telescope between two positions and , in sequence etc. First–order sky subtraction is achieved by subtracting the average spectrum at position from the average spectrum at position , and vice versa. Instead, we placed the galaxy at six positions along the slit, , each separated by 7 arcsec. For each slit position, first–order sky subtraction at any position is achieved by subtracting the mean of the frames at all the other sky positions. For observations of faint targets, this procedure should lead to an increase in signal–to–noise (hereafter ) of a factor where is the number of slit–positions; for six slit–positions we expect an increase in of compared to the normal procedure.
The journal of observations is provided in Table 2. Columns 1 and 2 list the names of the quasar, and of the target DLA galaxy candidate. The target names are taken from W01, and may be decoded from the example N-14-2C: N=NICMOS candidate, 14=14th quasar in the list of 16 quasars targeted with NICMOS, 2=2nd nearest candidate to the line of sight to the quasar, C=compact morphology (as opposed to D=diffuse). As detailed in W01, in this context the meaning of ‘compact’ is that the of the detection, integrated over an aperture, is greater for the smaller aperture used, diameter arcsec, than for the larger aperture used, diameter arcsec. Successive columns in Table 2 list the date of observation, the total integration time, the wavelength range covered by the spectrum, the slit position angle, and the average seeing. The observations of 2000 Aug 2 were affected by cloud, while conditions were clear for the other two nights. Further details of the target DLA absorbers, and the candidate DLA galaxies, including accurate coordinates, are provided in W01. Notes on the three candidates follow.
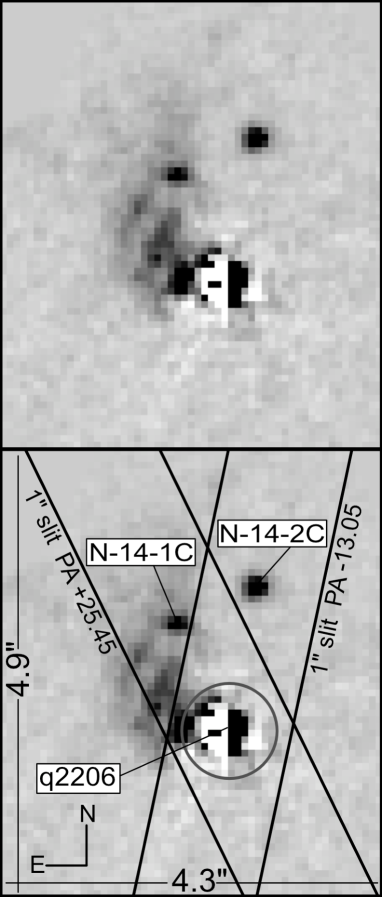
Quasar Q 22061958, candidates N-14-1C, N-14-2C: The spectrum of this quasar shows two high–redshift DLA absorbers, of redshifts , and . Our NICMOS observations of this field revealed two compact candidates with impact parameters arcsec. The nearest candidate to the line of sight to the quasar, N-14-1C, has impact parameter arcsec, and was detected at . Nevertheless this source was considered a marginal detection since the image is located on a diffraction spike. The second nearest candidate, N-14-2C, has impact parameter arcsec, and was detected at . As reported in M02, we succeeded in detecting Ly emission from N-14-1C, confirming that it lies at the redshift of the DLA absorber at . We also observed N-14-2C, but failed to secure a redshift. The source is redder than N-14-1C, is unresolved in the STIS and NICMOS images, and we assumed it was unrelated333Because of the wider slit used, arcsec, and the poor seeing conditions, although weak Ly emission was detected in the spectrum of N-14-2C, the flux was consistent with spillage from N-14-1C.. In this paper we show that, in fact, the two sources are at the same redshift.
The STIS image of this field, provided in M02, detects both candidates at much higher , by about a factor of five. This image was taken without a filter i.e. in ‘50CCD’ mode. Another version of this image is reproduced here in Fig. 1, rotated so that N is up (and E to the left). The deeper STIS image reveals a more complex morphology than the NICMOS image. In addition to the two compact sources, some diffuse emission surrounds N-14-1C, and extends to smaller impact parameters.
For the field of the quasar Q 22061958, the choice of central wavelength for the two observations attempted to maximise the chances of successful detections, from consideration of several factors: the wavelengths and probable relative strengths of the various rest–frame optical emission lines at the redshifts of the two absorbers; the wavelength regions of strong atmospheric absorption; the results from the optical spectroscopy; the wavelength coverage of the instrument; and the possibility of other galaxies undetected in the imaging observations, because at very small impact parameter. For both observations the slit was centred on the quasar and rotated to the position angle of the candidate. We chose the same wavelength range for both slit orientations, which provided simultaneous coverage of [O iii] 500.7 at (at m), and H and [O iii] 495.9 at (at and m). The purpose of the observation at PA25.45, then, was to detect the [O iii] 500.7 line from the confirmed galaxy N-14-1C, while also allowing the possibility of detecting the galaxy counterpart to the absorber if it lies at very small impact parameter. The purpose of the observation at PA13.05, was to search for [O iii] emission at either redshift from N-14-2C, as well as to search again for the galaxy at very small impact parameter. It would have been possible to observe both targets with a single slit orientation, offset from the quasar; however, we used two slit orientations as we considered it important to check for emission at very small impact parameter. In addition, in trying to detect faint emission lines from a galaxy where the spectrum overlaps spatially with the quasar spectrum, and where the quasar spectrum must be subtracted (see below), our experience is that this works best when the slit is aligned along the line joining the quasar and the galaxy.
Quasar 2233.91381, candidate N-16-1D: The spectrum of this quasar shows a strong Ly absorption line, , at . By the DLA definition of Wolfe et al. (1986), , this is not a DLA absorber, but a Lyman–limit system. We have included it in Table 1, since the measured column density lies only a little below this threshold. In this paper we treat the counterpart galaxy as representative of DLA galaxies. Nevertheless it should be borne in mind that the ionisation state of the gas in the absorber is dependent on column density (e.g. Viegas, 1995), and in this respect this absorber lies at one end of the distribution of the absorbers listed in Table 1. The nearest NICMOS candidate N-16-1D, was first detected in an optical image and identified as a candidate counterpart to the absorber by Steidel, Pettini, and Hamilton (1995), who called it N1. The galaxy was confirmed as the counterpart, on the basis of the detection of Ly emission at the DLA absorber redshift, by Djorgovski et al. (1996). We did not detect any candidates at smaller impact parameter in either our NICMOS image (W01) or our STIS image (M02) of this field. The wavelength range of our observations covered the three redshifted lines H486.1 (at m), [O iii] 495.9 (at m), and [O iii] 500.7 (at m). The impact parameter of this galaxy, arcsec in our NICMOS image, is the largest of all the eight confirmed galaxy counterparts listed in Table 1. We aligned the slit to cover both the quasar and the galaxy, again to check for the possibility that another galaxy at the absorber redshift lies at very small impact parameter.
2.2 Data reduction
For each source, for first–order sky subtraction we followed the procedure explained in the previous section. If the six–step–nod was repeated, the frames were reduced in sets of six. For six frames taken at positions ABCDEF, from each flat–fielded frame we subtracted the average of the other five frames. Second-order sky subtraction was achieved by fitting a polynomial up each column. The sky–subtracted frames were then registered to the nearest pixel, spatially and spectrally, and combined using inverse–variance weighting. Integer pixel shifts were used in order to keep the data in each pixel statistically indepedent. As a check of our six–step–nod observing procedure, we also reduced the data in the traditional way, by combining pairs of nod positions. This verified that the six–step–nod procedure achieved the expected improvement in . To establish the uncertainties, for each final 2D spectrum we formed a corresponding variance frame in two ways. In the first method we registered the raw frames using the same offsets as for the sky–subtracted frames. We then summed the counts at each pixel, and computed the variance as appropriate, from a knowledge of the measured gain and read noise, and assuming Poisson statistics. The second method measured the dispersion in the counts up each column in the final combined sky–subtracted frame, using a robust estimator. This provides an accurate measure of the average noise in the sky, but gives no information on the noise for individual pixels. The second method gave results some 20 to 30 per cent higher for the variance (10 to 15 per cent for the standard deviation) than the Poisson estimate; therefore we scaled the Poisson–estimated variance frame by this correction factor to produce the final variance frame.
The combined frame formed from the registered raw frames, referred to above, emulates the registration of the sky–subtracted frames, and therefore provided the means of accurate wavelength calibration, using the sky OH emission lines. This frame also provided the means of measuring the spectral resolution, from the widths of the sky lines, and yielded the values quoted above.
| Quasar | DLA candidate | Date | Integration | wavelength range | slit PA | seeing |
|---|---|---|---|---|---|---|
| (W01) | time s | m | °E of N | arcsec | ||
| Q 2206199 | N-14-1C | 2000 Aug 2 | 3600 | 25.45 | 1.0 | |
| Q 2206199 | N-14-2C | 2000 Jul 8 | 7200 | 13.05 | 0.8 | |
| 2233.91318 | N-16-1D | 2000 Jul 11 | 7200 | 158.45 | 0.8 | |
3 Results
3.1 Reduced 2D frames
Quasar Q 22061958, candidates N-14-1C, N-14-2C: The final 2D frames of the spectroscopic observations of Q 22061958 are shown in Fig. 2.
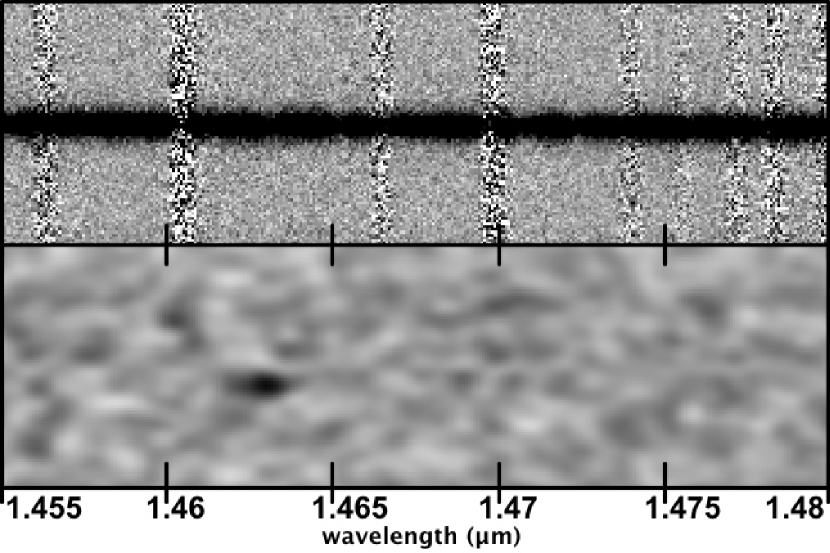
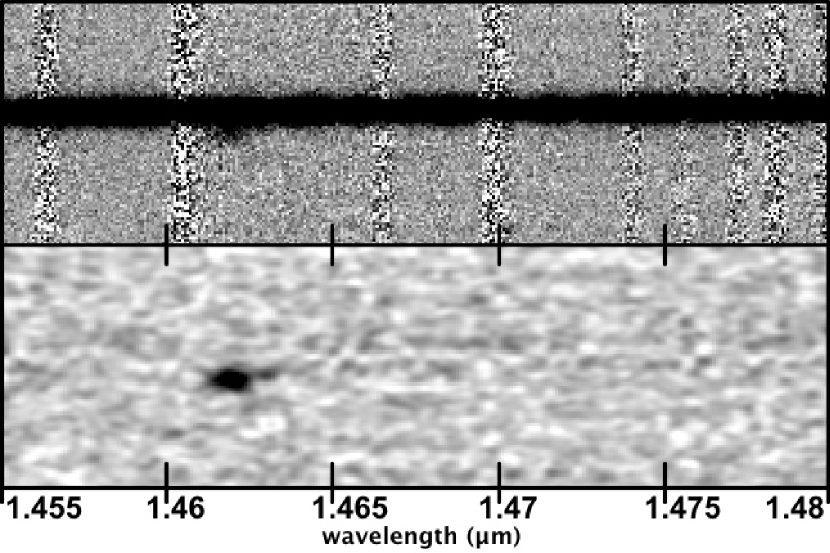
Because of the poorer seeing, shorter integration time, and non–photometric conditions, the of the spectrum of N-14-1C (top two panels in Fig. 2) is nearly a factor of two lower than for N-14-2C (bottom two panels). An emission line was detected at high significance from both candidates, with centroid below the quasar spectrum in each frame. For both candidates the impact parameter is small, and the quasar and galaxy spectra overlap. Therefore we used our SPSF software (Møller, 2000) to subtract the quasar spectrum, as described below. Fig. 2 provides the 2D spectra over approximately half the total wavelength range observed, for both candidates, both before and after subtraction of the quasar spectrum. From top to bottom, the panels show a) N-14-1C, raw, b) N-14-1C, after quasar subtraction, and smoothing to enhance the contrast of the line, c) N-14-2C, raw, d) N-14-2C, after quasar subtraction and smoothing. The measured spatial offsets of the emission lines from the quasar are provided in Table 3, together with the offsets measured in the NICMOS and STIS images. The spectroscopic and imaging offsets are consistent, confirming that the emission is associated with the targeted candidates. The SPSF routine works by firstly determining a normalised profile of the quasar, smoothly varying with wavelength. This profile is then scaled to the quasar counts at each wavelength, and subtracted. Regions where emission lines from the galaxy are detected are then masked, and the procedure is iterated. This worked well here because the galaxy continuum is negligibly faint, and because the emission is offset from the quasar centroid.
| Candidate | impact parameter (arcsec) | (spec.) | (M02) | ||
|---|---|---|---|---|---|
| spec. | image (NIC) | image (STIS) | (kpc) | (kpc) | |
| N-14-1C | 4.2 | ||||
| N-14-2C | — ∗ | ||||
| N-16-1D | 1.1 | ||||
∗ consistent with point source
For the candidate N-14-1C the detected line occurs at the expected wavelength for [O iii] 500.7 from the confirmed galaxy counterpart to the DLA absorber at redshift . For the candidate N-14-2C the detected line occurs at a very similar, but slightly shorter, wavelength, confirming that N-14-2C is part of the same DLA galaxy as N-14-1C, and not an unrelated source as was previously suspected. A faint, nevertheless significant, extension of the detected emission line, towards redder wavelengths and smaller impact parameters, is visible in the bottom panel in Fig. 2. As explained in the next sub-section, we interpret this as flux from N-14-1C leaking into the slit.
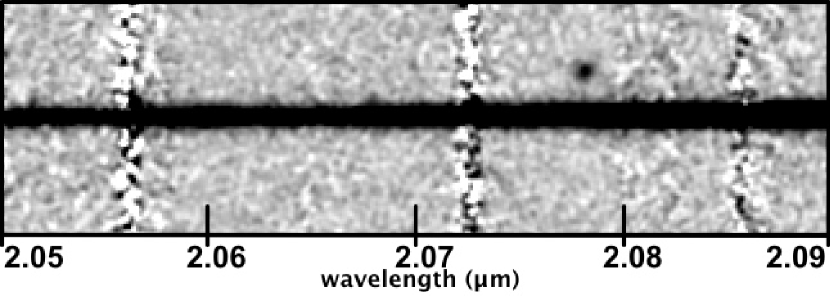
Quasar 2233.91381, candidate N-16-1D: Fig. 3 provides the 2D spectrum of our observation of the quasar 2233.91381 over approximately half the total wavelength range observed. An emssion line is clearly visible, at the expected wavelength for [O iii] 500.7 from the confirmed DLA galaxy counterpart to the Lyman–limit absorber at redshift . The frame has been smoothed to enhance the contrast of the line. Neither the [O iii] 495.9 nor the H486.1 lines were detected. The detected emission line is well separated from the quasar, so that it was not necessary to subtract the spectrum of the quasar. The spatial offset measured from the 2D spectrum, listed in Table 3, is somewhat smaller than the value measured from the NICMOS image, at the 3 significance level, while it is in agreement with the offset measured in the STIS frame. Such a discrepancy might be explained, for example, by variations in mean age of the stellar populations across the galaxy. It is interesting to note that the rest–frame UV continuum seems to trace the [O iii] line emission better than the rest frame optical continuum.
3.2 Extracted 1D spectra
The quasar 1D spectra and the corresponding variance spectra were extracted using the IRAF routine apall, with a 14–pixel aperture and an optimal profile weighting scheme. The same apertures, with appropriate vertical shift, were then applied to the extraction of the galaxy spectra, and the corresponding variance spectra, from the 2D frames with the quasar spectra subtracted. At this stage ww checked the variance spectra, by forming, for each galaxy, the ratio of the galaxy spectrum and the standard–deviation spectrum. As expected the counts in these spectra have mean zero, and standard deviation unity. From the frames formed by summing the registered raw frames, we re–extracted the quasar spectra, which now include sky. Vacuum wavelengths of sky emission lines in these spectra were used to calibrate the quasar and galaxy spectra onto a linear wavelength scale. All measured wavelengths quoted in this paper have been corrected to the heliocentric frame.
We used the spectra of bright AII and GIV stars, observed on the same nights, at similar airmasses to the targets, to flux calibrate the 1D spectra. The calibration curve was derived by taking the ratio of the observed spectrum of each standard, and a black–body spectrum of the correct brightness. The spectra of Q 22061958 are affected by atmospheric absorption bands, which are corrected for by this procedure. Neither of the detected emission lines is strongly affected by absorption. This procedure provides reasonably accurate calibration provided slit losses for the object and standard star are similar. Since our targets have angular size much smaller than the seeing this will be true if the seeing conditions were similar, which was true for the two nights which were clear. For the data taken on 2000 Aug 2 (N-14-1C), when conditions were not photometric, the calibration was derived from the ratio of the uncalibrated spectrum of the quasar from that night, to the calibrated spectrum of the same quasar observed on 2000 Jul 8 (N-14-2C). As an additional check we compared the calibrated fluxes of the quasars against the NICMOS photometry, finding agreement at the 0.1 mag. level. This check provides only an indication of the spectrophotometric accuracy, because the NICMOS and spectroscopic observations were separated by two years, and the quasars may have varied in the interim.
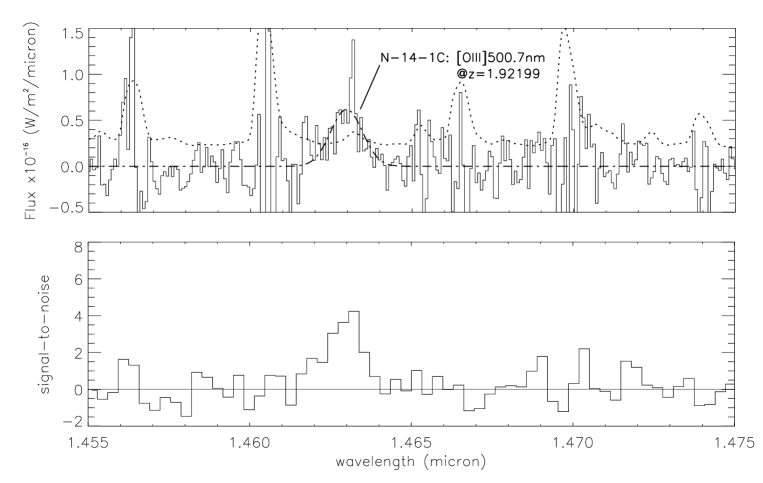
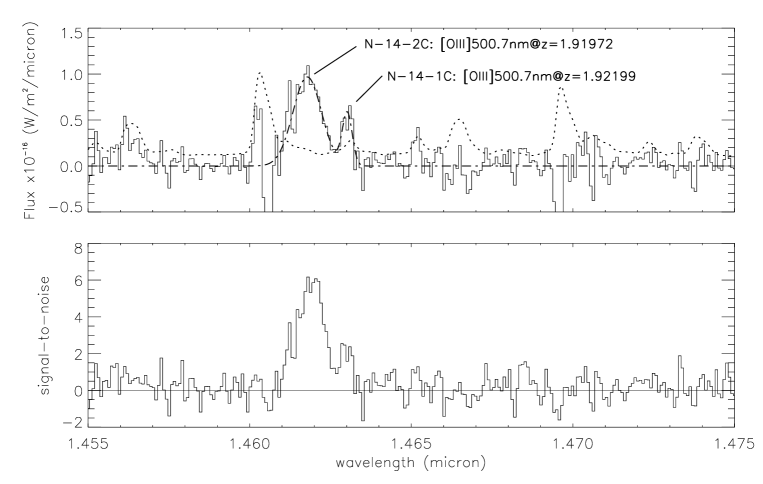
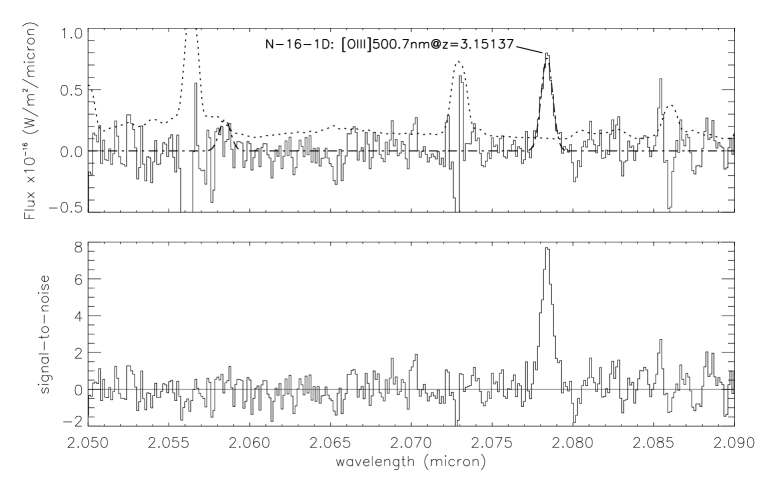
The galaxy 1D spectra are plotted in Figs 4 and 5. In each case we plot: i) the flux–calibrated 1D spectrum (solid), with the error spectrum (dotted), and our min– fit of a Gaussian to the detected emission line (dot–dashed), and ii) the ratio of the object and error spectra i.e. the spectrum. The errors are large at the wavelengths of the strong OH sky lines. Residuals from sky subtraction can mean that the significance of a detected line in the plotted spectrum may not always be easily appreciated. Plotting the spectrum can make this clearer.
Measurements of the three detected emission lines are summarised in Table 4. Col. 1 lists the galaxy name, and col. 2 provides the redshift of the DLA absorber (the meaning of ‘ELA’ is explained in the next section). For each detected emission line we made a min– fit of a Gaussian profile. The variables, then, are the line centre, line width (corrected for resolution), and line flux. Col. 3 provides the redshift of the detected [O iii] line; col. 4 lists the flux in the [O iii] 500.7 line; and col. 5 lists the line luminosity. Col. 6 provides the intrinsic line width (FWHM), which is converted to a 1D velocity dispersion in Col. 7. In Col. 8 we list the velocity difference between the DLA absorption line and the [O iii] 500.7 emission line. Col. 9 provides the velocity difference between any detected Ly emission and the [O iii] emission.
| 1 | 2 | 3 | 4 | 5 | 6 | 7 | 8 | 9 |
|---|---|---|---|---|---|---|---|---|
| Candidate | DLA(ELA) | ([OIII]) | Flux | Lum | FWHM | v(DLA-[OIII]) | v(Ly-[OIII]) | |
| ( erg s-1 cm-2) | (erg s-1) | ( km s-1) | ( km s-1) | ( km s-1) | ( km s-1) | |||
| N-14-1C | 1 | |||||||
| N-14-2C | — | |||||||
| N-16-1D | 2 |
1. Component 2 from Table 5A in Prochaska and Wolfe (1997a) 2. Strongest FeII 160.8 line (Lu, Sargent, and Barlow, 1997, 1998)
Candidate N-14-1C: The 1D spectrum of this candidate is shown in the top two panels of Fig. 4. The [O iii] 500.7 line is detected at , at a redshift . The line has FWHMkm s-1, corresponding to 14 pixels, which is greatly oversampled. Therefore in panel b) we plot the in pixels binned by a factor of four. In this plot the significance of the line is much more apparent.
We checked for the possibility that the galaxy counterpart to the DLA absorber lies at small impact parameter, by searching the spectrum of the quasar for the H and [O iii] 495.9 lines at this redshift. The lines are undetected. Deeper limits were reached at the other position angle, and are provided below.
Candidate N-14-2C: The 1D spectrum of this candidate is shown in the lower two panels of Fig. 4. As stated previously, the [O iii] line from N-14-2C, detected at lies at a lower redshift than N-14-1C. However the faint extension to the red, visible as a second peak in the 1D spectrum, lies at a redshift consistent with the redshift of N-14-1C. Therefore to measure the line we fit simultaneously two Gaussians, with the higher–redshift line fixed at the redshift of N-14-1C. As seen in the plot, this provides a good fit. The weaker line is detected at . There is no evidence for light from N-14-2C leaking into the spectrum of N-14-1C, but given the lower of the latter spectrum, and the slightly larger distance of N-14-2C from the slit edge, Fig. 1, this is not surprising.
We again checked for the possibility that the galaxy counterpart to the DLA absorber lies at small impact parameter, by searching the spectrum of the quasar for the H and [O iii] 495.9 lines at this redshift. The lines are undetected. We measured fluxes of erg s-1 cm-2, and erg s-1 cm-2for these lines, respectively.
Candidate N-16-1D: The [O iii] 500.7 emission line is visible in the two panels of Fig. 5. In measuring the properties of the line, because the recorded spectrum covers both lines, [O iii] 495.9, 500.7, we fit both lines simultaneously, with flux ratio 1:3. The [O iii] 500.7 line is detected at . The [O iii] 495.9 line is not significantly detected because it is a factor of three weaker, and lies in a region of higher noise. The H line was not detected. We measured a flux of erg s-1 cm-2for this line.
4 Kinematics
Prochaska and Wolfe (1997b, hereafter PW97) have conjectured that DLA absorption lines arise in large, cold, rapidly–rotating discs, of circular velocity km s-1, from an analysis of the detailed velocity structure of the low–ionisation metal absorption lines. Typically the strongest component of the absorption complex occurs at either the blue or red limit of the velocity spread, resulting in a characteristic asymmetric profile with a sharp line edge. They were able to explain this ‘edge–leading asymmetry’ (hereafter ELA) in terms of the line of sight passing through a thick disc. Consider a gaseous disc with a flat rotation curve, of circular velocity , and in which the number density of absorbing clouds declines monotonically with distance from the centre. The simplest case is if the galaxy is viewed edge–on, degrees. Then the full circular velocity is recorded at the point at which the line of sight passes closest to the centre. This also corresponds to the strongest absorption if the face–on surface density is a declining function of distance from the galaxy centre. Elsewhere along the line of sight the column density is lower, and only a component of the circular velocity is recorded. This explains the ELA profile for the edge–on case. The line edge occurs at either the blue or the red end of the profile, depending on whether the gas is rotating towards or away from the observer, respectively.
At smaller inclinations, degrees, the situation is more complicated, because the absorption profile depends also on the density distribution of clouds perpendicular to the disc, and on the point at which the line of sight crosses the disc mid–plane. In some situations the absorption profile can be reversed, in the sense that the strongest absorption can correspond to the minimum component of rotational velocity (PW97, fig. 2). Finally, the absorption profile also varies with impact parameter, in the sense that one observes a smaller spread of velocities at larger impact parameter.
The PW97 picture of DLAs arising in large, cold, rapidly–rotating thick discs is inconsistent with the CDM hierarchical model of structure formation, which for these redshifts predicts smaller disks with smaller rotation speeds. Nevertheless, as shown by Haehnelt et al. (1998), the absorption line data itself may be equally well explained by the CDM hierarchical model. In this case, the line profiles are caused by a mixture of random motions, rotation, infall, and mergers. Therefore the ELA test, on its own, cannot distinguish between the two models.
As pointed out by Warren & Møller (1996), PW97, and Lu, Sargent, & Barlow (1997, hereafter LSB), measurement of the galaxy systemic velocity, through the detection of an emission line, provides a vital additional datum for the interpretation of the kinematics and possible distinction between these two pictures. The first application of this, was the analysis by LSB of one of our targets, the DLA absorber in the spectrum of the quasar 2233.91381. LSB used the redshift of the Ly emission line from N-16-1D, measured by Djorgovski et al. (1996), as the galaxy systemic redshift; however, the Ly line, being a resonance line, is subject to complex radiation transfer processes, which result in an asymmetric emission line profile. In the population of Lyman–break galaxies, Pettini et al. (2001) find that, relative to the rest–frame optical emission lines, the Ly emission line is redshifted by typically between 200 and 1000 km s-1, while the interstellar absorption lines are blueshifted by similar amounts. They interpret this as the signature of strong galactic winds. The rest–frame optical emission lines, unaffected by resonant scattering, provide the best measurement of the galaxy systemic velocity, while the Ly line is unreliable.
We now turn to the interpretation of our results, in the light of this discussion. Relevant quantities are summarised in Table 4. We discuss the quasar 2233.91381 first, because it is the simpler case.
Quasar 2233.91381: The redshift of N-16-1D, from the [O iii] 500.7 line, is , which we take to be the systemic redshift of the galaxy. The low–ionisation metal absorption lines in this system display edge–leading asymmetry, towards the blue. We are interested in the redshift of the ELA line edge, which we take as recorded by the strongest FeII 160.8 line, at . This is entered in Table 4 as . The absorption line is plotted in fig. 1 of LSB, and the redshift is taken from Lu, Sargent, & Barlow (1998). No error is quoted, and we will adopt a uncertainty of km s-1, based on an inspection of the spectrum. The DLA(ELA) line, then, is blueshifted by km s-1 relative to the systemic velocity, while the Ly line is redshifted by km s-1.
In the PW97 picture, these features (blue–side ELA line edge, blueshifted relative to the systemic velocity, and a substantial velocity difference) are the characteristics of a line of sight that intersects the disc mid–plane close to the major axis, at small impact parameter. An example is given by profile no. 3, in fig. 14 of PW97. Because the intersection is close to the maor axis, we may approximate the velocity difference of km s-1 to . We note that this implies a substantially smaller mass than inferred by LSB, who used the velocity difference given by the Ly line, km s-1, but is nevertheless in line with the proposal of PW97 of a typical circular velocity of km s-1.
Although the analysis presented so far sits well with the PW97 picture, a prediction of their model, not only for lines of sight such as this, but for all lines of sight, is that the systemic velocity should lie outside the velocity range of the low–ionisation metal absorption–line profiles. This does not appear to be the case here. LSB argue that the FeII line is the best tracer of the neutral gas, and state that the velocity spread is km s-1, meaning that the FeII absorption profile extends as far as km s-1 redward of the systemic velocity. This contradicts the prediction of PW97. The velocity difference is significant, although not large, and the effect would need to be seen in a number of systems before ruling out the model.
Quasar Q 22061958: A detailed analysis of the velocity profiles of both low–ionisation and high–ionisation metal absorption lines in the absorber has been presented by Prochaska and Wolfe (1997a). The velocity profile of the low–ionisation absorption lines shows several components, with the two strongest separated by 65 km s-1. There is a sharp cut–off to the blue of the lower–redshift component (fig. 2 and table 5A in Prochaska and Wolfe, 1997a), and they considered the profile “to be consistent with an edge–leading asymmetry, but note that its shape is not as suggestive as the majority of the other cases”. Accepting this judgment, we select the strongest blue component, , as the redshift of the leading edge, entered as DLA(ELA) in Table 4. The other components identified extend redward over an interval of 140 km s-1.
We now have to choose between N-14-1C, which is redshifted by km s-1 relative to the ELA redshift, or N-14-2C which is blueshifted by km s-1. The former is the simplest interpretation within the PW97 picture. As for N-16-1D, above, the data are then consistent with an interpretation of a line of sight that interesects the mid–plane near the major axis, in which case we may approximate the velocity difference of km s-1 to . Again this value is in line with the proposal of PW97 of a typical circular velocity of km s-1. Furthermore, in this case the systemic velocity lies outside the velocity range of the low–ionisation metal absorption–line profiles, in agreement with the prediction of PW97. However, if the whole system is a large disk, it is then curious that N-14-1C is fainter than N-14-2C, if it is the galaxy nucleus. A further difficulty with this interpretation is the velocity of N-14-2C. In the rotating disc hypothesis the only points blueshifted by as much as the ELA line are other points along the major axis. But this would pass from N-14-1C and run close to the quasar position. N-14-2C lies almost perpendicular to this line (Fig. 1). Therefore it must be concluded that it is a separate object. When we consider also the disturbed appearance of the DLA galaxy in this field, Fig. 1, these results are certainly more in agreement with the CDM hierarchical picture than with the cold large disc hypothesis.
To summarise, the kinematic evidence from these two fields is in agreement in a number of respects with the picture of PW97 of DLA absorbers as arising in large rapdily–rotating cold discs. Nevertheless there are two significant discrepancies with the predictions of PW97: in the case of the quasar 2233.91381, the DLA galaxy systemic velocity lies within the absorption velocity field, rather than outside; in the case of the quasar Q 22061958, we are unable to incorporate the velocity of N-14-2C in a consistent way, and this, coupled with the morphology of the system, supports the hierarchical picture. Clearly the detection of rest–frame optical emission lines from a larger sample of DLA galaxies would be extremely useful, to extend this comparison.
5 Comparison with the properties of LBGs
In this section we extend the analysis of M02, comparing the properties of DLA galaxies and Lyman–break galaxies, to include properties of the rest–frame optical emission lines. The aim is to test the hypothesis that DLA galaxies are Lyman–break galaxies, selected by gas cross section. As explained in M02, and in the Introduction section here, although the average properties of the two populations may differ (because of the different selection criteria), if the hypothesis is correct, the properties of individual DLA galaxies should lie within the range of the properties of a comparison sample of Lyman–break galaxies of similar absolute magnitude and redshift. This will be true regardless of how the DLA galaxies were selected.
The new observations give us three extra parameters to use. These are the luminosity weighted velocity dispersion, as recorded by the width of the [O iii] line, the [O iii] line luminosity, and the velocity difference between the Ly emission line and the [O iii] line. Although our measurements of the three sources considered here are for the [O iii] line, we suppose that for the comparison sample of LBGs any rest–frame optical emission line is satisfactory for the first and third of these parameters.
The comparison data are drawn from the studies of Pettini et al. (2001), and Erb et al. (2003), hereafter P01, E03, which provide the largest samples of LBGs with spectroscopic detections of rest–frame optical emission lines. P01 report observations of 19 targets, with mean redshift 3.1, and E03 report observations of 16 targets, with mean redshift 2.3. Some of the relevant quantities were not included in these papers, but were kindly made available to us by the authors. In total these two samples provide 32 measurements (or upper limits) of the velocity dispersion, 11 measurements of the [O iii] line luminosity, and 18 measurements of the velocity difference. For consistency with M02, we use the AB continuum absolute magnitude at a rest–frame wavelength of 150m,, as the measure of galaxy luminosity.
5.1 Velocity dispersion
In Fig. 6 we plot velocity dispersion against absolute magnitude for our three sources, and the 32 LBGs. All values are intrinsic, i.e. have been corrected for the resolution of the observations. Two of the DLA measurements lie within the spread of values for the LBGs. The third, N-16-1D, lies below the spread of points. Nevertheless, a number of the LBG values are upper limits.We conclude that there is no evidence for a difference between DLA galaxies and LBGs, based on this plot.

5.2 [O iii] Luminosity
In Fig. 7 we plot [O iii]500.7 line luminosity against absolute magnitude for the three [O iii] line detections reported here, and for the 11 LBGs. Unfortunately the two samples are disjoint in absolute magnitude, preventing a valid comparison of the hypothesis under test. The average [O iii] luminosity of the DLA galaxies is a factor of three smaller than the average luminosity of the LBGs. A trend of decreasing line luminosity with rest–frame UV continuum luminosity would be expected, since the continuum records the flux from the stars that are the ionising sources. A linear relation between the two quantities, indicated by the curve in Fig. 7, is a reasonably good representation of the trend.

5.3 Velocity difference
For two of the three sources discussed in this paper, Ly emission has been detected. The velocity differences between the Ly and [O iii] lines, , Table 4, are km s-1 for N-14-1C, and km s-1 for N-16-1D. In Fig. 8 we plot these values against absolute magnitude, together with the data for the 18 LBGs. It is striking that the values for the two DLA galaxies are smaller than all the values for the LBGs, with the exception of one galaxy. Nevertheless there is some evidence for a trend in this plot, of smaller with fainter luminosity. Considering only the small sample of four LBGs of similar luminosity to the DLA galaxies, the two DLA galaxies lie within the range of the LBG galaxies, albeit near the lower envelope. On this evidence we cannot rule out the hypothesis of M02, and a larger sample of faint LBGs would be useful.
There are two possible selection effects which could explain the low values of measured for the DLA galaxies. For DLA galaxies at small impact parameter, Ly emission with large will be much harder to detect, as lying in the wing of the absorption line, rather than in the clean central region where the quasar flux is completely absorbed. Secondly, any sample of DLA galaxies is liable to be biased toward strong Ly emission, since this is how they are confirmed spectroscopically. As shown by both Adelberger et al. (2003) and Shapley et al. (2003), in LBGs self–absorption of the Ly line redshifts the emission line, since the absorption occurs on the blue side. Therefore, galaxies with weaker Ly emission tend to have larger velocity offsets, and vice versa.

6 Star formation rate
It is possible to estimate the star formation rate (SFR) in these three sources in a number of ways. We begin with the calibration of Kennicutt (1998) relating SFR to unextinguished rest–frame UV luminosity density:
The V band magnitudes of the three sources N-14-1C, N-14-2C, and N-16-1D, are, respectively 24.69, 25.01, and 25.75. The first and third of these values were taken from M02, while the second value has not been published before. Photometry of the field of Q 22061958 is quite difficult because of the irregular morphology of the galaxy. The two values quoted here are aperture magnitudes within a diameter of 0.6 arcsec. Without any correction for extinction these yield the values of SFR quoted in Table 5, Col. 1. There is substantial diffuse emission in the field of Q 22061958. We have estimated that the total flux in the field, from the two sources plus the diffuse emission, corresponds to V=22.70. This value is surprisingly bright, but is very uncertain because of the difficulty of subtracting the bright image of the quasar. This total magnitude corresponds to a SFR of 35 yr-1. Interestingly, Wolfe et al. (2004) find that the mean UV intensity in the absorber, measured from our STIS photometry, is in good agreement with that inferred from spectroscopy of the CII∗ absorption line – supporting the use of this absorption line as an indicator of star formation.
The relation between SFR and unextinguished H flux provided by Kennicutt (1998) is:
Where available, H (or H) is preferred to the UV continuum as a star formation gauge, because the observation is made at a longer wavelength, and so is less affected by uncertain corrections for extinction. Unfortunately H is unobservable from the ground for our two DLA absorbers, as is H for the absorber towards Q 22061958. For the absorber towards 2233.91381 the H line, at m, lies in a region of strong atmospheric absorption, and was not detected. Using the upper limit to the line flux, and assuming (Osterbrock, 1989), yields the upper limit to the SFR for N-16-1D quoted in col. 2 of Table 5.
The Ly line is readily extinguished by dust, and therefore is only useful in providing a lower limit to the SFR. Assuming yields the lower limits to the SFR listed in col. 3 of Table 5, for the two sources with detected Ly.
All the above estimates are subject to large uncertainty. Therefore it is of interest to consider the usefulness of the [O iii] 500.7 line as a star formation indicator. Kennicutt (1992) shows that there is large scatter in a plot of [O iii] luminosity against H luminosity, for a sample of nearby galaxies, and as a consequence advises against its use as a star formation indicator. Differences in ionisation parameter, , and metallicity might explain the scatter. To examine this further we used the relations provided by Kewley & Dopita (2002) to compute the luminosity ratio H/[O iii] as a function of these two parameters. The results are plotted in Fig. 9. This plot was derived by combining the curves provided in figs 1 and 5 of Kewley & Dopita (2002), and assuming the ratio quoted above.

Of particular interest here is the fact that within the range of values of the metallicities for these two DLA absorbers, Table 1, the ratio H/[O iii] is very insensitive to metallicity, and near the minimum value i.e. the inverse is near the maximum value. This would explain why the [O iii] lines were relatively easily detected in these systems. For these metallicities the SFR depends much more strongly on ionisation parameter than metallicity. It is then of interest to estimate typical values of for LBGs. A useful diagram for this is Fig. 10. Here we have used the same two plots from Kewley & Dopita to derive curves of constant and constant metallicity as a function of the two observables and . For values of these two parameters for LBGs taken from table 3 of Pettini et al. (2001), we determine typical values of . Returning to Fig. 9, for the metallicities of the two DLAs, this implies that H is weaker than [O iii], with ratio H.

To summarise this calculation: by using the measured metallicities of the DLA absorbers; assuming that the ionisation parameters are similar to those existing in LBGs; and assuming that the metallicities are applicable to the regions of star formation, we are able to estimate the (unobservable) H flux in these two DLA galaxies directly from the [O iii]500.7 flux. This leads to the star–formation rates entered in col. 4 of Table 5.
We now compare the results between these various SFR indicators. For N-14-1C, where Ly is strong, it is likely that there is not much dust, and the fact that the [O iii] SFR value is only a factor two greater than the UV and Ly values agrees with this. The ratio of the [O iii] to UV estimate is larger for N-14-2C than for N-14-1C. This would indicate that the system is dustier, which is in accord with the redder colour and the absence of Ly emission. With the caveat that the total magnitude for this field, including the diffuse emission, is very uncertain, the [O iii] estimates would suggest that the correction for extinction to the total SFR estimate from the UV continuum luminosity, given above, is about a factor of two; this indicates a total SFR, corrected for extinction, of about 70 for this system. Finally the four estimates for N-16-1D are all in agreement with each other. Nevertheless, in the context of the discussion for N-14-2C it is surprising that the ratio of the [O iii] to UV estimate is so large for this object. Overall, there is gratifying agreement between the different methods used to estimate SFRs.
Returning now to the use of the [O iii] luminosity as an indicator of the star formation rate, the foregoing analysis would suggest that, provided independent information on the ionisation parameter and metallicity are available, the [O iii] luminosity can provide an estimate of the star formation rate that is accurate to better than a factor of two. Clearly this is not a method that has any general application, but it could be useful for other DLA galaxies, where [O iii] may be the only detectable line.
| Candidate | UV | H | Ly | [O iii] |
|---|---|---|---|---|
| N-14-1C | — | |||
| N-14-2C | — | — | ||
| N-16-1D | ∗ |
∗ upper limit
7 Summary
We summarise the main results of the paper.
1. We have detected [O iii] 500.7 emission lines from three sources associated with high–redshift DLA absorption lines. These are the first detections of their kind. Two of the sources are identified with the same DLA absorber, at , seen in the spectrum of the quasar Q 22061958, and the third source is the galaxy counterpart to the absorber seen in the spectrum of the quasar 2233.91381, previously detected in Ly.
2. Comparison of the [O iii] emission redshift with the detailed velocity structure seen in the absorption profile of low–ionisation metal lines, allows a new test of the model of Prochaska and Wolfe (1997b) of DLA absorbers as large rapidly–rotating cold thick disks, which contradicts the CDM hierarchical picture. Some of the predictions of this model are borne out by the data, but we note two significant discrepancies. The detection of rest–frame optical emission lines from DLA absorbers provides a valuable test of this model. More detections could provide a definitive test.
3. The properties of the detected rest–frame optical emission lines provide further investigation of the question posed by Møller et al. (2002),: are DLA galaxies are Lyman–break galaxies selected by gas cross section? Comparison of the measured velocity dispersions, [O iii] line luminosities, and the velocity difference between the [O iii] and Ly lines reveal no clear contradictions of the hypothesis. Again a larger sample would be valuable in testing this suggestion more strongly.
4. We have described a method to estimate the SFRs in these two DLA galaxies using the [O iii] luminosity, and assuming that the measured metallicity of the DLA is applicable to the regions of star formation. We find gratifying agreement between the SFRs estimated in this way, and those estimated using the traditional indicators.
Acknowledgments
We thank Max Pettini, Dawn Erb and Alice Shapley for providing further data and useful communications on the Lyman–break galaxy sample.
References
- Adelberger et al. (2003) Adelberger K. L., Steidel C. C., Shapley A. E., Pettini M., 2003, ApJ, 584, 45
- Bouwens et al. (2004) Bouwens R. J., Illingworth G. D., Blakeslee J. P., Broadhurst T. J., Franx M., 2004, ApJ, 611, L1
- Chen & Lanzetta (2003) Chen H.-W., Lanzetta K. M., 2003, ApJ, 597, 706
- Djorgovski et al. (1996) Djorgovski S. G., Pahre M. A., Bechtold J., Elston R., 1996, Nat, 382, 234
- Djorgovski (1998) Djorgovski S. G., 1998, in Petitjean P. & Charlot S., eds., Structure and Evolution of the Intergalactic Medium from QSO Absorption Line System, Proceedings of the 13th IAP Astrophysics Colloquium, Paris, France. Editions Frontieres p.303 (astro-ph/9709001)
- Elston et al. (1991) Elston R., Bechtold J., Lowenthal J., Rieke M., 1991, ApJ, 373, L39
- Ferguson et al. (2004) Ferguson H. C. et al., 2004, ApJ, 600, L107
- Erb et al. (2003) Erb D. K., Shapley A. E., Steidel C. C., Pettini M., Adelberger K. L., Hunt M. P., Moorwood A. F. M., Cuby J.-G., 2003, ApJ, 591, 110 (E03)
- Fall and Efstathiou (1980) Fall S. M., Efstathiou G., 1980, MNRAS, 193, 189
- Fynbo, Møller & Warren, (1999) Fynbo J. U., Møller P., Warren S. J., 1999, MNRAS, 305, 849
- Haehnelt et al. (1998) Haehnelt M. G., Steinmetz M., Rauch M., 1998, ApJ, 495, 647
- Kennicutt (1998) Kennicutt R. C., Jr. 1998, ARA& A, 36, 189
- Kennicutt (1992) Kennicutt R. C., Jr. 1992, ApJ, 388, 310
- Kewley & Dopita (2002) Kewley L. J., Dopita M. A., 2002, ApJS, 142, 35
- Kulkarni & Fall (2002) Kulkarni V. P., Fall S. M., 2002, ApJ, 580, 732
- Leibundgut & Robertson (1999) Leibundgut B., Robertson J. G., 1999, MNRAS, 303, 711
- Lu et al. (1993) Lu L., Sargent W. L. W., Barlow T. A., Churchill C. W., Vogt S. S., 1996, ApJS, 107, 475
- Lu, Sargent & Barlow (1997) Lu L., Sargent W. L. W., Barlow T. A., 1997, ApJ, 484, 131 (LSB)
- Lu, Sargent & Barlow (1998) Lu L., Sargent W. L. W., Barlow T. A., 1998, AJ, 115, 55
- Mo et al. (1998) Mo H. J., Mao S., White S. D. M., 1998, MNRAS, 295, 319
- Møller & Warren (1993) Møller P., Warren S. J., 1993, A&A, 270, 43
- Møller, Warren & Fynbo (1998) Møller P., Warren S. J., Fynbo J. U., 1998, A&A, 330, 19
- Møller, Fynbo & Fall (2004) Møller P., Fynbo J. U., Fall S. M., 2004, A&A, 422, 233
- Møller (2000) Møller P., 2000, ESO Messenger, 99, 31
- Møller et al. (2002) Møller P., Warren S. J., Fall S. M., Fynbo J. U., Jakobsen P., 2002, ApJ, 574, 51 (M02)
- Osterbrock (1989) Osterbrock D. E., 1989, Astrophysics of Gaseous Nebulae and Active Galactic Nuclei, Mill Valley: University Science Books
- Pei, Fall & Hauser (1999) Pei Y. C., Fall S. M., Hauser M. G., 1999, ApJ, 522, 604
- Pettini et al. (1990) Pettini M., Hunstead R. W., Smith L. J., Mar D. P., 1990, MNRAS, 246, 545
- Pettini et al. (1995) Pettini M., Hunstead R. W., King D. L., Smith L. J., 1995, in Meylan G., ed. QSO Absorption Lines, Springer, Berlin p. 55
- Pettini et al. (2001) Pettini M., Shapley A. E., Steidel C. C., Cuby J.-G., Dickinson M., Moorwood A. F. M., Adelberger K. L., Giavalisco M., 2001, ApJ, 554, 981 (P01)
- Prochaska & Wolfe (1997a) Prochaska J. X., Wolfe A. M., 1997a, ApJ, 474,140
- Prochaska & Wolfe (1997b) Prochaska J. X., Wolfe A. M., 1997b, ApJ, 487, 73 (PW97)
- Prochaska et al. (2003) Prochaska J. X., Gawiser E., Wolfe A. M., Castro S., Djorgovski S. G., 2003a, ApJ, 595, L9
- Prochaska et al. (2003b) Prochaska J. X., Gawiser E., Wolfe A. M., Cooke J., Gelino D., 2003b, ApJS, 147, 227
- Shapley et al. (2003) Shapley A. E., Steidel C. C., Pettini M., Adelberger K. L., 2003, ApJ, 588, 65
- Viegas (1995) Viegas S. M., 1995, MNRAS, 276, 268
- Warren & Møller (1996) Warren S. J., Møller P., 1996, A&A, 311, 25
- Warren et al. (2001) Warren S. J., Møller P., Fall S. M., Jakobsen P., 2001, MNRAS, 326, 759 (W01)
- Wolfe et al. (1986) Wolfe A. M., Turnshek D. A., Smith H. E., Cohen R. D., 1986, ApJS, 61, 249
- Wolfe et al. (2004) Wolfe A. M., Howk J. C., Gawiser E., Prochaska J. X., Lopez S., 2004, ApJ, 615, 625