email: koppen@astro.u-strasbg.fr 22institutetext: International Space University, Parc d’Innovation, 1 Rue Jean-Dominique Cassini, F–67400 Illkirch-Graffenstaden, France 33institutetext: Institut für Astronomie, Universitäts-Sternwarte Wien, Türkenschanzstr. 17, A–1180 Vienna, Austria
email: hensler@astro.univie.ac.at 44institutetext: Institut für Theoretische Physik und Astrophysik, Universität Kiel, D–24098 Kiel, Germany
Effects of episodic gas infall on the chemical abundances in galaxies
The chemical evolution of galaxies that undergo an episode of massive and rapid accretion of metal-poor gas is investigated with models using both simplified and detailed nucleosynthesis recipes. The rapid decrease of the oxygen abundance during infall is followed by a slower evolution which leads back to the closed-box relation, thus forming a loop in the N/O-O/H diagram. For large excursions from the closed-box relation, the mass of the infalling material needs to be substantially larger than the gas remaining in the galaxy, and the accretion rate should be larger than the star formation rate. We apply this concept to the encounter of high velocity clouds with galaxies of various masses, finding that the observed properties of these clouds are indeed able to cause substantial effects not only in low mass galaxies, but also in the partial volumes in large massive galaxies that would be affected by the collision. Numerical models with detailed nucleosynthesis prescriptions are constructed. We assume star formation timescales and scaled yields that depend on the galactic mass, and which are adjusted to reproduce the average relations of gas fraction, oxygen abundance, and effective oxygen yield observed in irregular and spiral galaxies. The resulting excursions in the N/O-O/H diagram due to a single accretion event involving a high velocity cloud are found to be appreciable, which could thus provide a contribution to the large scatter in the N/O ratio found among irregular galaxies. Nonetheless, the N/O-O/H diagram remains an important indicator for stellar nucleosynthesis.
Key Words.:
Galaxies: abundances – Galaxies: evolution – Galaxies: dwarf Irregular – Galaxies: ISM1 Introduction
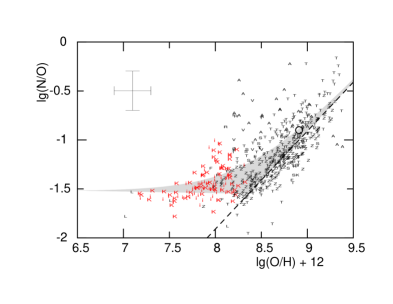
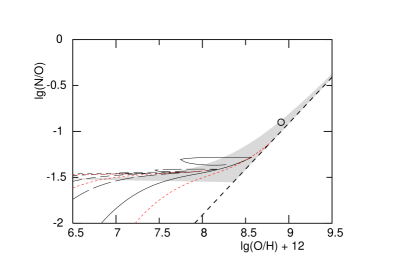
The nitrogen-to-oxygen abundance ratio in extragalactic Hii regions has long been found to increase with the oxygen abundance among spiral galaxies (Edmunds & Pagel 1978, Vila-Costas & Edmunds 1993, Henry & Worthey 1999 – Fig. 1). Irregular galaxies are located in this plot near the lower end of the spiral sequence, and form a cloud with an appreciable amount of scatter around and over a range of oxygen abundances between 7 and 8.5.
Such a behaviour can be interpreted by galactic chemical evolution models as a signature of how the production of nitrogen in stars varies with metallicity. The closed-box Simple Model (neglecting the stellar lifetimes) predicts that the relation of an abundance ratio with the abundance of a primary element mirrors the metallicity dependence of the yield of element , strictly independent of the star formation history and the specific recipe for star formation rate (SFR). This also implies that the relation in the diagram can be interpreted as an evolutionary sequence from metal-poor to metal-rich systems.
Thus, the N/O-O/H diagram has found a good use in infering the mode of nitrogen synthesis in stars. Since the ascending part of the diagram follows roughly a unity slope, it is taken to indicate secondary nitrogen production (i.e. with a yield proportional to the oxygen abundance). The horizontal part, where the irregular galaxies are found, then corresponds to the primary nitrogen component, i.e. with constant yield (e.g. van Zee 1998). Thus it appears that primary production dominates in the early phases of chemical evolution and secondary production in more evolved stages.
This behaviour appears to be somewhat difficult to reconcile with what is known from stellar nucleosynthesis studies. While secondary nitrogen production occurs in massive stars, an important contribution comes from intermediate-mass stars in the form of a predominantly primary production due to the Third Dredge-Up mixing freshly synthesised carbon into higher layers, where it can be turned by hot-bottom burning into nitrogen (e.g. van den Hoek & Groenewegen 1997). Thus, once the system is evolved enough for all intermediate-mass stars to contribute, the N/O ratio would remain rather constant instead of increasing with O/H.
Several simplifications enter into such an interpretation. One is that the lifetimes of nitrogen-producing intermediate mass stars are not negligibly short compared to the star formation. Such a delayed production makes the N/O ratio rise slower with time (and hence oxygen abundance) until it reaches the Simple Model relation, thus making the slope of the relation somewhat steeper during the early phases (e.g. Matteucci 1986). With this caveat, the N/O-O/H diagram is still an important instrument to probe stellar nucleosynthesis.
The other, more important generalization of the Simple Model is the accretion of gas, whether by infall from outside the galaxy or outside the disk, or inflow within the disk of the galaxy. Köppen & Edmunds (1999) showed that as long as the ratio of accretion and SFRs decreases monotonically with time – which occurs in most chemical evolution models, e.g. with the infall rate falling off exponentially with time – the N/O-O/H relation remains within a factor of two close to the closed-box relation. N/O ratios lower than that are not possible in any kind of infall model.
Detailed chemical evolution models – which take into account all the abovementioned details and processes – have confirmed that the N/O-O/H diagram still remains a very sensitive indicator of stellar nucleosynthesis. Henry et al. (2000) identified the horizontal part at as the result of primary nitrogen production in intermediate mass stars. Because the lag times for nitrogen ejection are shorter than the long average star formation timescales in irregular galaxies, the N/O ratio reaches the plateau at lower oxygen abundances than in spiral galaxies. The rise of the N/O-ratio in more evolved systems is explained by the oxygen yield not being constant, but decreasing with metallicity. Such a behaviour would be expected from the evolution of massive stars whose substantial mass loss due to stellar winds increases with metallicity (Maeder 1992).
There remains another potentially important aspect of accretion models: Köppen & Edmunds (1999) also showed that N/O ratios higher than obtained from the closed-box relation at the same O/H are possible, if the ratio of accretion and SFR increases so strongly and rapidly that the metallicity decreases in time.
In recent years, it has become more apparent that intergalactic space is pervaded by neutral gas clouds. Among them are the isolated Compact High Velocity Clouds (CHVCs), defined to be kinematically not associated with a galaxy and not to have a stellar counterpart (Braun & Burton 1999, 2000, Kilborn et al. 2000, de Heij et al. 2002). Whether these clouds are left-over building blocks of galaxies (Blitz et al. 1999), remnants of galactic winds and fountains, tidal debris, or the product of ram-pressure stripping, their presence implies that they are likely to interact with galaxies. With typical sizes of 15 kpc and gas masses of several with clumps ten times smaller, they could affect the chemical evolution of the galaxy.
One pertinent feature of the observed N/O-O/H diagram is the large amount of scatter, which is larger than the uncertainties of the observational material and the analysis methods (Henry & Worthey 1999). In particular, one notes that while there seems to be a plateau at , there are more objects above this value than below. This tendency raises the question whether episodic infall – the consequence of a collision with an intergalactic gas cloud – could contribute to the observed distribution of objects in the N/O-O/H plot.
Over the past years much data on the gas content and the chemical composition of irregular galaxies of various masses has become available. This material will serve as a constraint to and a comparison with the chemical evolution models, in particular the relations between current gas mass and gas fraction, metallicity, and effective yield.
In this paper, we first study the basic effects of rapid, massive infall on the secondary/primary relation (Section 2) in order to show the basic behaviour and to identify the conditions under which strong deviations from the closed-box relation can arise. Section 3 presents the systematic relations among the observational data for a sample of gas-rich galaxies. Detailed numerical models for the chemical evolution of galaxies which undergo a recent infall episode are described in section 4 along with the results and the comparison with observational material. Discussion and Conclusions follow as sections 5 and 6.
2 Effects of sudden gas infall on abundances
The study by Köppen & Edmunds (1999) of the consequences of arbitrary infall of metal-poor gas on the chemical signatures of galaxies showed that the determining factor is the temporal behaviour of the ratio of the rates of mass accretion and star formation . If this quantity decreases monotonically with time, the galaxy evolves with a metal yield smaller than the true yield, but the abundance ratio of secondary and primary elements remains proportional to the primary abundance and is confined to a rather narrow region close to the prediction by the Simple Model .
On the other hand, abundance ratios larger than these limits can only be reached if the accretion is massive and rapid enough to cause a decrease of the primary metallicity.
In the following we study more closely the basic behaviour of the chemical evolution of galaxies that undergo such a massive infall of metal-poor gas. We consider models in which the finite delay between star formation and metal production is neglected. Oxygen is assumed to be produced primarily, with a yield , to give results comparable to observed values. Nitrogen is taken to be produced purely in secondary mode with . The SFR is supposed to be proportional to the gas mass, with a timescale of 5 Gyr. We note that this choice of the SFR does not determine the basic behaviour in the N/O-O/H diagram, although it does affect the exact shape and timing of the evolutionary tracks.
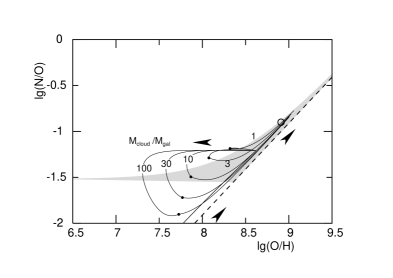
In Fig. 2 we show the evolution of nitrogen and oxygen of models which are closed-box, except for an infall of metal-poor gas starting at 5 Gyr age and lasting for 1 Gyr. It is evident that in order to have a significant deviation from the closed-box secondary-primary relation, the mass of the infalling gas must be substantially larger than the mass of the galaxy.
Immediately before the infall starts, all models have a gas fraction of 0.55 and an oxygen abundance . The commencement of the infall raises the accretion ratio from 0 to about 10 and 1000 for and 100, respectively. We note that in galaxies larger in size than a HVC, will represent only that part of the galaxy which mixes with the infalling gas and forms stars. The oxygen abundance is strongly reduced due to the ‘dilution’ by the accreted metal-poor gas. As the gas in the galaxy accumulates, the star formation rate increases. Since the star formation timescale is longer than the duration of the accretion event, the enhancement of the SFR takes place appreciably after the infall. Thus we deal not with a proper starburst – in the sense of a reduced star formation timescale – but rather with a galaxy which becomes more gas-rich and thus makes more stars. The oxygen synthesized by the massive stars limits the excursion of the oxygen abundance, and it also brings down the N/O ratio. When the infall stops – marked by a dot on the tracks – the gas fraction is between 0.67 and 0.90 for and 100, respectively. After this, the models continue to evolve like closed boxes, albeit with different initial conditions, and the tracks return to the Simple Model secondary-primary relationship. The overall effect is that the model traces a ‘loop’ above the Simple Model relation in the N/O-O/H diagram.
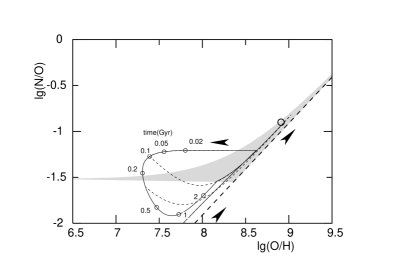
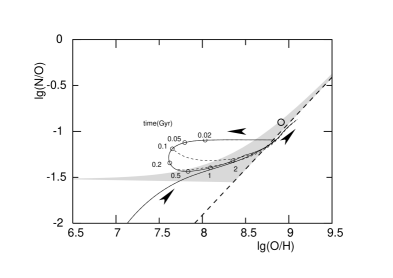
For the extreme model with an infall rate of /Gyr we follow in Fig. 3 the evolution along this loop. Because of the high infall rate the decrease in [O/H] takes place rapidly. Depending on the duration of the infall episode, the model returns within less than one star formation timescale to the Simple Model relation. If the infall episode lasts only a short time (e.g. 0.1 Gyr), the increased primary production of oxygen then leads to an evolution towards the lower right (similar to the zig-zag curves of Garnett’s (1990) starburst model), followed by the (secondary) production of nitrogen leading towards the upper right, towards the Simple Model relation. If the infall lasts for a time comparable to the star formation timescale, the oxygen production may just compensate the continuing ‘dilution’ by the infalling gas. The oxygen abundance may remain nearly constant and thus one may obtain a rather large and deep loop leading again towards the close-box relation.
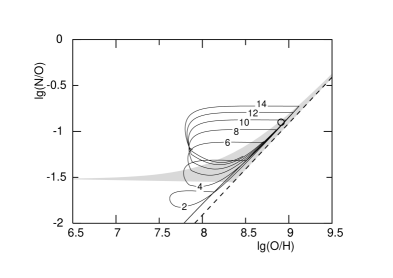
The horizontal excursion of the loop depends essentially on the mass ratio of infall gas and the gas present in the galaxy. In Fig. 4 we study the influence of the time at which the accretion starts. As the gas fraction decreases from 0.80 (at 2 Gyr), 0.36 (at 8 Gyr) to 0.16 (at 14 Gyr), the loop makes a larger excursion when less gas remains available in the galaxy.
Finally, we present the evolution for the same model as in Fig. 3 but with the nucleosynthesis prescriptions we shall use in the further modeling (Section 4): the production of nitrogen is taken from the stellar yields of van den Hoek & Groenewegen (1997). The SFR is assumed to be directly proportional to the gas mass with a timescale of 5 Gyr. Because the primary production from intermediate mass stars is important for nitrogen, the loops are less extended in the N/O ratio.
This figure also demonstrates that the loops done with the full and detailed nucleosynthesis prescription obey the characteristics predicted from the basic models:
-
•
the N/O ratio does not reach below the limiting locus given by the closed-box model relation: this region in the diagram cannot be entered by evolution (Köppen & Edmunds, 1999).
-
•
during the accretion event, the N/O ratio does not become larger than the value just before the event. The abundance ratio cannot be changed by accretion of metal-poor gas, but only by the production of oxygen and subsequently of nitrogen.
-
•
the extent of the loop is governed by the mass ratio of the accreted gas and the gas left in the galaxy just before the event: If one neglects metal production during the event, infall of of pure hydrogen gas by a galaxy with a gas mass of and metallicity leads to a reduced gas metallicity of .
-
•
the initial phase of a strong reduction of the oxygen abundance is rather short: it is determined by the infall rate which must be high if one wants a large excursion from the closed-box relation. Hence, it is more likely to observe accreting galaxies during the phase when they evolve back towards the closed-box relation.
-
•
short episodes of accretion lead to excursions mainly to lower oxygen abundances, while those comparable to the star formation timescale are necessary to make excursions towards lower N/O ratio: in short infall the gas is only ‘diluted’ whereas during longer episodes the resultant secondary (or delayed) production of nitrogen follows only after the self-production of oxygen has started.
We note that genuine starbursts – periods when the constant of the SFR is strongly enhanced – lead to a different characteristic behaviour, in particular that the N/O-ratio reaches values below the closed-box relation (cf. the zig-zag tracks from Garnett, 1990)
3 Observed relations among gas-rich galaxies
From the literature we collect observational data on gas-rich galaxies. Data on abundances, Hi masses, gas fractions etc. are taken from Kobulnicky & Skillman (1996), Broeils & Rhee (1997), van Zee et al. (1997a, 1997b, 2001), Carignan & Purton (1998), Mateo (1998), Duc et al. (1999, 2001), Izotov & Thuan (1999), van Zee (2001), Kennicutt & Skillman (2001), Garnett (2002), Salzer et al. (2002), Young et al. (2003). Data for the same object from different sources are combined, with preference given to the more recent data.
3.1 Mass-metallicity relation
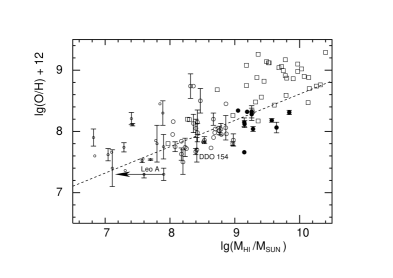
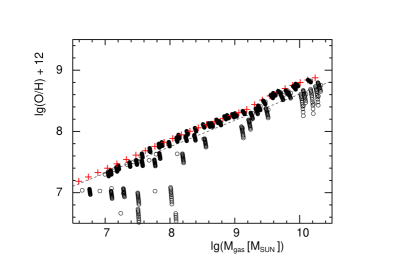
We show in Fig. 6 the relation between oxygen abundances at the effective radius and the Hi mass of irregular and spiral galaxies. There are 81 galaxies in this sample, and an overall regression can be obtained as
| (1) |
which is almost identical to the relation obtained by Garnett (2002)
| (2) |
It is worth noting that spiral galaxies tend to have higher metallicities than this relation predicts for their masses. On the other hand, irregular galaxies with Hi masses larger than have lower metallicities.
3.2 Gas fractions and effective yields
Garnett (2002) deduced gas fractions for 36 objects. For another 54 galaxies, we compute them from the ratio of Hi mass to blue luminosity and the extinction-corrected B–V colour index, using the recipe of van Zee (2001):
| (3) |
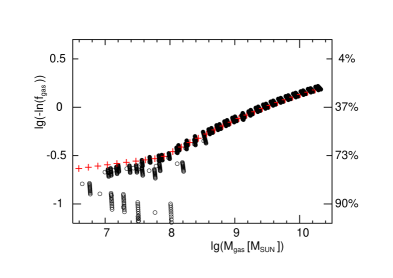
where the last two terms are based on the photometric properties of synthetic stellar populations. The gas fractions are clearly correlated with the Hi masses (Fig. 14), despite a large amount of scatter. It might be that this scatter is greater among dwarf galaxies.
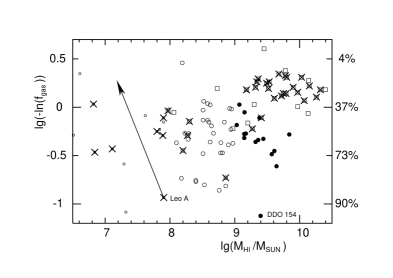
This behaviour is evident both from the galaxies with gas fractions from Garnett (2002) – marked by a cross – as well as in those whose gas fraction we computed from their Hi masses and blue luminosities.
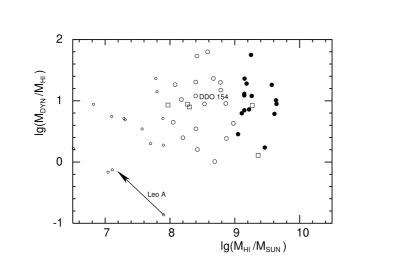
The Hi component in spiral and irregular galaxies is usually much larger in extent than the stellar disk. Thus the observed Hi mass may not be representative of the gas fraction in the galaxy. An example is Leo A where Young & Lo (1996) find that emission from the inner galaxy is about 20 percent of the whole emission. We show its position in all figures for the entire Hi mass, but with an arrow pointing towards the loci if we took an Hi mass five times smaller. Fig. 8 shows that this galaxy also has a very low ratio of dynamical to Hi mass, significantly smaller than most other galaxies. However, if one reduces the true galactic gas mass, this object becomes more similar to the others.
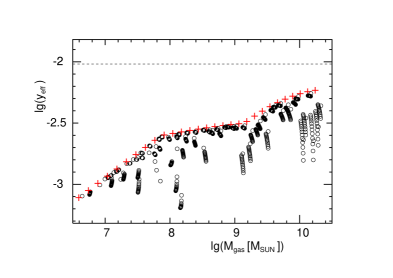
With the knowledge of the gas fraction we can compute the effective yields, i.e. we compare the oxygen abundances and gas fractions with the Simple Model relation. Figure 9 shows that despite an appreciable amount of scatter, there is a clear trend that more massive galaxies have higher effective yields. Spiral galaxies seem to be a natural extension of the irregulars. This relation might indicate that the true yield is smaller in less massive galaxies, such as via a steeper IMF, but it could also reflect that the effective yield is lower, because the stellar ejecta are less likely to be held back by the galaxies’ gravitational potential.
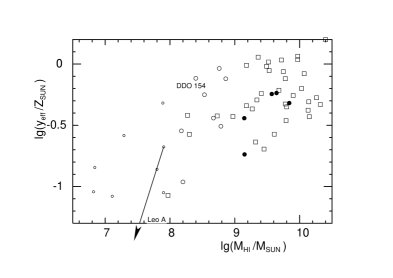
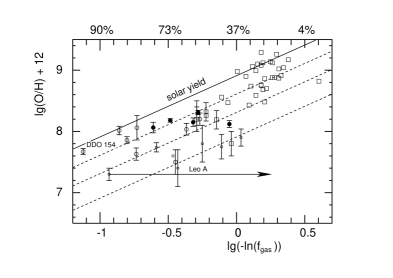
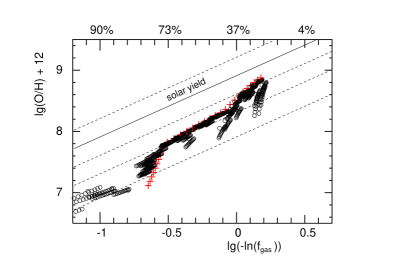
Figure 10 shows the oxygen abundances plotted against the gas fractions, and compared to the Simple Model. It presents essentially the same information as Figs. 7 and 9, but for a smaller number of galaxies for which all three data are available. Among the irregular galaxies one notes a clear trend of more massive objects having a higher effective yield, but the tendency for them to also have a lower gas fraction is much less evident than in Fig. 7. Most probably this impression is due to the smaller number of objects and the large amount of scatter in all diagrams, some of which may well be genuine. The spiral galaxies are less gas-rich and have higher effective yields, and they might be interpreted as an extension of the irregular galaxies to higher masses.
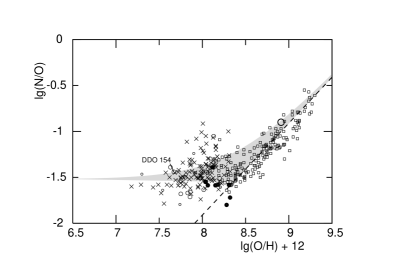
Finally, we show the N/O-O/H diagram for the galaxies in our sample. For spiral galaxies we show the individual Hii region data of van Zee et al. (1998b) in Fig. 11.
3.3 Diameters
Since the excursion from the closed-box relation in the N/O-O/H diagram is determined by the mass ratio of infalling material to the gas still within the galaxy, we also need to consider what fraction of the galaxy will be affected by the infall of the gas cloud. According to Braun & Burton (2000), a clump in a high velocity cloud has a typical size of 1 kpc (a few arcmin at 1 Mpc distance). In a collison with a galaxy larger than this, only a fraction of the gas in the galaxy will participate and thus the chemical evolution is expected to be affected in this partial volume. To estimate this fraction, we need to know the size of the Hi component of the galaxy.
Broeils & Rhee (1997) established a tight relation between the diameter and the mass of the Hi disk in 108 spiral and irregular galaxies:
| (4) |
They also found a tight relation between the diameter of the optical disk and the Hi mass:
| (5) |
If we assume for the exponential scale length of stellar disk:
| (6) |
we get a very good match with the corresponding data of the objects in our sample, as shown in Fig. 12. Most of these data are from van Zee et al. (1997a, 2001) who find that the integrated luminosity profiles of the irregular systems are reasonably well fit by an exponential disk, and determine disk scale lengths by matching the surface brightness distributions in the R-band.

van Zee et al. (1997b, 1998c) find that the ratio of the diameters seen in Hi and the optical is about 2 for ‘normal’ and low surface brightness dIrrs and between 3 and 5 for BCDGs. There is no strong trend with Hi mass, as shown in Fig. 13.

4 Models with detailed stellar nucleosynthesis
We present calculations of the chemical evolution of galaxies of a range of masses, using detailed stellar nucleosynthesis prescriptions and follow the evolution due to the accretion of a clump of metal-free gas, taking into account that only the star-forming region is affected where the abundances are determined from the Hii region, so that in larger galaxies only a fraction of the galactic gas is involved. These models are constructed under the constraint of matching the various observational relations discussed above, and to show whether this process explains the scatter among the irregular galaxies in the N/O-O/H diagram.
4.1 Assumptions of the underlying model
For the prescriptions of stellar nucleosynthesis we follow Henry et al. (2000) and use the results of Maeder (1992) for massive stars and van den Hoek & Groenewegen (1997) for intermediate mass stars. We assume a Salpeter IMF with a stellar mass range from 0.1 to 100 . This gives a ratio for the very low mass galaxies, slightly larger than the observed limit of . Although this offset is still well within the observational uncertainties and the accuracy of the nucleosynthesis results, it can be removed by slightly increasing the oxygen yield by a factor of 1.2. Thus the yield for oxygen (at solar metallicity) is 0.026, about twice the solar oxygen abundance. Instead of introducing a galactic mass loss of some kind – with its associated free parameters – we reduce both oxygen and nitrogen stellar yields by a common factor which depends on the galactic mass :
| (7) |
with . The SFR
| (8) |
is assumed to depend on the instantaneous masses of gas and stars , thus on the total mass and the gas fraction. One advantage of this form is a well defined star formation timescale . In order to give a reasonable match of the observed dependence of gas fraction with gas mass, (Fig. 7) we assume this relation
| (9) |
Here we do not assume the factor used by Henry et al. (2000) which enhances the SFR for higher metallicities. We also assume that the galaxy is formed by a slow continuous infall with a rate of
| (10) |
with a total evolution time of Gyr and a timescale Gyr, taken from the solar neighbourhood. This assumption is not crucial for our results: computation with a true closed-box model gives slightly larger oxygen abundances for the more massive galaxies.
4.2 Modeling the accretion event
From Braun & Burton (2000) we take that a typical CHVC has an extent of about 10 kpc (1 degree at 1 Mpc distance) with embedded clumps of about 1 kpc size (a few arcmin to 20’). The clumps have Hi column densities of about cm-2 and thus masses of about , while the envelope (with cm-2) is about 100 times more massive. For a typical relative velocity of the cloud of 100 km/s, this gives a duration of 10 to 100 Myr for an accretion of the clump and the entire cloud, respectively. It is much faster than the star formation timescale, estimated from the gas consumption, which is several Gyr. This implies that the deviation from the closed-box evolution cannot be a fully developed loop (cf. Figs. 3 and 5), but rather consists of an excursion to lower oxygen abundances, followed by the track evolving back towards the closed-box relation.
As a simple approach the clump is assumed to affect only the region within kpc of the galaxy’s centre. For such a central collision, it is straightforward to estimate the mass fraction of the galaxy:
| (11) |
with the scale length of the exponential Hi disk, which we take to be one sixth of the Hi diameter . Combining this with the relation (Eq. 5) of Broeils & Rhee (1997) between Hi diameter and mass, we get that while a gas clump would affect more than 80 % of the mass of galaxies below , it can influence only 14 % and 1.8 % in a galaxy with and . This means that a gas mass of less than is involved, and hence the accretion of a gas clump will make a significant impact on the chemical evolution of the galaxy’s centre. For each galaxy we compute two models: one for the unaffected portion is done without an infall event, the other including the infall event. The stellar and gas masses of both parts are then added together. The metallicities are taken only from the affected part, since this will be what is measured in the current Hii regions.
All galaxies evolve following the above presciptions, until the present epoch – 13 Gyr after the start of the evolution. At that time a metal-poor gas cloud is accreted over a duration of 100 Myrs with a constant rate. The mass of the cloud is randomly picked between and following a probability distribution proportional to . We do not need to consider smaller masses because of their negligeable effects. In all following figures we show the evolution of the models during the time interval between 13 and 15 Gyr after start of the evolution, i.e. what would be observable from now on.
4.3 Results: gas fractions
Comparison of the gas fractions (Figs. 7 and 14) show that the average relation among irregular and spiral galaxies is reasonably well matched with our recipe (Eq. 9). The space between models with and without infall events would evidently be occupied by events involving less massive clouds, which presumably occur more often.
However, the models have far less scatter in the gas fraction than is evident from the observations. For masses less than about the infall event causes some variation of the gas fraction. But for higher masses the region affected by the accreting gas cloud is rather small, and thus the overall gas fraction is determined by the global SFR, which we had assumed to be a unique function of the galactic mass only. This assumption – taken for reasons of simplicity – does not appear to be generally valid. We take this as evidence of a genuine variation of the star formation timescale between individual galaxies, but we do not propose to model this here, because we wish to avoid introducing further free parameters.
In Fig. 7 one notes the presence of a few very low mass galaxies with low observed gas fraction: UGC 12613 (type Im V, , ), Pegasus (T = 10, 6.82, 0.033), and UGC 11755 (BCD/E, 8.19, 0.46). They could be interpreted in terms of our models as dwarf galaxies with a SFR higher than our recipe, having never undergone an accretion event, and thus continuing to use up their original gaseous material. On the other hand, there are the more massive irregulars with high gas fractions. The accretion event scenario might account for them, if gas clouds of about to were involved. But they could also merely have a SFR lower than the other galaxies.
4.4 Results: metallicity
Our choice of the yield reduction factors (Eq. 7) gives a satisfactory match of the effective yields of the models (Fig. 15) with what is deduced from the observations (Fig. 9). The observed mass-to-metallicity relation is also reasonably well reproduced by the models (Fig. 17).
The oxygen abundances and gas fractions, in relation to the Simple Models are shown in Fig. 16. Comparison with Fig. 10 confirms that the choices for the dependencies of SFR and effective yields on galactic mass are quite reasonable. It also emphasizes that the irregular galaxies of moderate and high mass but large gas fractions (see Fig. 10) are not well represented. While the two assumed relations could not model this, the episodic infall also cannot account for the presence of these galaxies. The low surface brightness “quiescent” irregular galaxy DDO 154, with its high gas fraction and high yield but otherwise with average properties (cf. Kennicutt & Skillman 2001) is a particularily striking example, as shown in Fig. 10.
Our recipes for star formation and yield were chosen so that the resulting models give a reasonable match of the dependences of metallicity, gas fraction, and effective yield with the gas mass. The oxygen abundances for massive galaxies thus are slightly higher than Garnett’s (2002) mean relation, just as in the observations (Fig. 6). Among the dwarf galaxies, the models seem to indicate the presence of many objects with very low metallicities. However, one must keep in mind that here the accretion of small clouds will dominate: events with clouds less massive than the minimum of we show in the figures would fill up the space in the figures between the locus of the crosses and the model tracks with infall. As these events can be expected to be more frequent than collisions with larger clouds, the emphasis in the diagram would be towards the less perturbed systems.
4.5 Results: the N/O-O/H Diagram
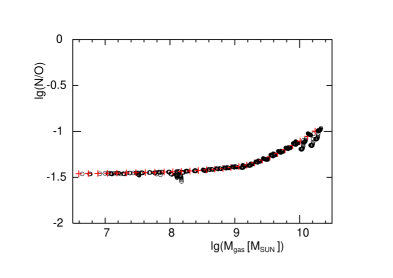
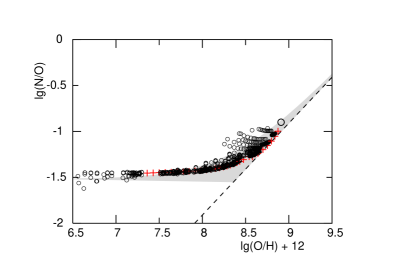
In the diagram of nitrogen-to-oxygen abundance ratio versus oxygen abundance (Fig. 18), excursions from the closed-box relation (indicated by the chain of plus-signs) are rather large but limited to a reduction in O/H in the horizontal part i.e. involving less massive galaxies. In the ascending part there are also quite strong effects due to more massive and hence metal-rich galaxies, which may populate the region above the horizontal part.

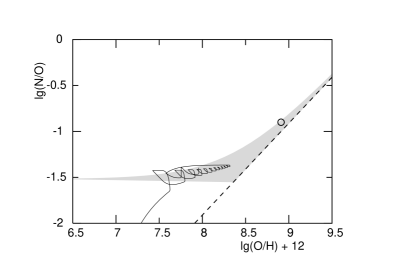
If one looks at the evolutionary tracks in this diagram (Fig. 19), one notes that – by construction – low mass galaxies due to their longer star formation timescale evolve only until the horizontal part of the observational diagram, while more massive ones can reach up to the ascending branch. For instance the model of evolved (up to the present time) to a gas fraction of about 10% and an oxygen abundance somewhat larger than the sun, when the infall occurs. That a rather large loop is obtained has three reasons: firstly, a cloud affects only 0.002 of the galaxy’s gas mass i.e. about which yields a reduction of the oxygen abundance by nearly 0.8 dex. Secondly, the star formation timescale is rather short – 1.06 Gyr – and thus during the 100 Myr of the infall an appreciable quantity of oxygen is produced, and the N/O ratio can also be reduced (cf. Fig. 3). Thirdly, the high star formation leaves a smaller gas mass in the galaxy at the start of infall. Note that during the infall episode the loop is passed through quickly, thus there is little chance to detect a galaxy in such a state. It is more likely to be found after the event when it evolves towards the closed-box relation. The enhanced density of symbols on these upward curved tracks makes them easily identified in Fig. 18. Since the infall onto a less massive galaxy (e.g. ) affects the entire galaxy, the effects on abundances are also quite substantial, though not too evident in the diagram: the reduction of oxygen abundance is about 1 dex. But the evolutionary track after the event is at nearly constant N/O ratio, due to the slower SFR. This gives sufficient time for a stellar generation to eject all the delayed primary nitrogen from intermediate mass stars along with the undelayed oxygen.
As is evident from the tracks before the infall event, their slope becomes steeper in more massive galaxies. This is because the higher star formation rate makes the effect of the time-delay of the nitrogen production in intermediate mass stars more pronounced. Thus, it is possible that the loop of a more massive galaxy may descent somewhat below the tracks of less massive galaxies.
5 Summary and discussion
Our model calculations demonstrate that it is possible to obtain a significantly broadened N/O-O/H relation by the galaxies evolving towards the closed-box relation after having undergone an episode of strong infall.
One prediction of our scenario is that galaxies at high N/O ratio would tend to be more massive, as they originate from galaxies which would have evolved into the ascending branch, and the infall would have preserved the enhanced N/O ratio. Also, we expect that in the horizontal part and in the lower ascending part there is a mixture of less massive galaxies without an infall event which experience a long evolution due to slow star formation and of more massive ones having undergone an infall episode. Comparison with Fig. 11 shows a substantial amount of mixture, but the observational uncertainties in the abundances and the lack of Hi mass determinations do not permit to clearly confirm or disprove the expected trends.
5.1 The N/O ratio
The computed N/O ratios as a function of galactic Hi mass, presented in Fig. 20, are nearly constant for small masses, since the loops due to infall events take place in the flat part of the N/O-O/H diagram (cf. Fig. 5). Only for high mass models does the ratio increase by about 0.5 dex. This is because the massive objects would cover the ascending branch. Here, infall episodes may lower the N/O ratio, but only by about 0.2 dex.
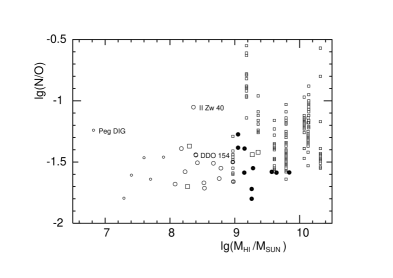
Among the observations (Fig. 21) we note that apart from II Zw 40 and the Pegasus dwarf, the irregular galaxies show no clear trend with Hi mass, but seem to scatter around a constant value. In this figure none of the objects marked with crosses in Fig. 11 is present. The Hii region data from spiral galaxies show the range of N/O ratios met in these objects. On average, the values are slightly higher than among the irregular galaxies.
For II Zw 40, Kobulnicky & Skillman (1996) give while Izotov & Thuan (1999) give which is more like the other objects. The value for the Pegasus dwarf of is found by Skillman et al. (1997) to be one sigma above the values of the other irregular galaxies. For this exceptional object, the authors discuss several possible explanations, including a different IMF and time delayed nitrogen production. This would remain valid in the context of episodic infall. We shall not consider these two cases. We also note that our models with their single dependence of parameters on galactic mass cannot account for the appreciable scatter in the diagram.
5.2 Models with additional starbursts
To explore the additional effects due to the presence of genuine starbursts, we compute the same series of models with a bursty star formation history. We apply the following ad-hoc recipe: for all galaxies less than the star formation rate is 10 times the continuous rate used before, for a duration of 200 Myr beginning every full Gyr, but during the 800 Myrs in between the rate is one hundred times less the continuous rate. This increases the scatter in the N/O-O/H diagram (Fig. 22) somewhat. One notes that the closed-box relation is no longer as strictly obeyed as a limit; as expected, several points lie below the relation.
Likewise, in all the other diagrams the amount of scatter among the dwarf galaxy models is further increased, although this does not significantly change the relations seen in Figs. 14 to 17. The evolutionary tracks (Fig. 23) before the infall event show the typical Garnett zig-zag curves, although somewhat modified because of the continuous infall. The accretion event gives a large loop, with a variation of about 0.1 dex in the N/O ratio.
6 Conclusions
We examine the chemical evolution following the rapid infall of metal-poor gas into a galaxy. First, we consider models with a simplified nucleosynthesis recipe and explore the influence of the various parameters, and under which circumstances one achieves large deviations from the closed-box Simple Model. We find that
-
•
excursions in the N/O-O/H diagram are in the form of loops but only towards the ‘upper-left’ side of the closed-box relation, that is towards smaller oxygen abundances and larger N/O ratios.
-
•
during the infall, the oxygen abundance is decreased due to dilution of the galactic gas, followed after the infall by the evolution towards the closed-box relation.
-
•
in order to have large excursions, the mass of the infall gas must be much larger than the mass of the gas present in the galaxy (or in the star-forming region of large galaxies).
-
•
also, the infall rate must be greater than the SFR.
-
•
in order to form large loops, the duration of the event must be of the order of the star formation timescale.
These results, which may also be obtained by analytical solutions, are also found from numerical models with a detailed nucleosynthesis recipe and taking into account the finite stellar lifetimes.
We then examine the possible effects of HVCs colliding with gas-rich galaxies on the chemical evolution of the galaxy. From the properties attributed to HVCs we estimate that
-
•
a passage would occur for 10 to 100 Myr which is suitably short compared to the star formation,
-
•
the gas masses of to would be sufficient to cause a large influence on dwarf galaxies,
-
•
in massive (and large) galaxies the HVCs size of 1 to 10 kpc would restrict any observable effects to a partial volume of the galaxy.
This implies that such a collision could be expected to leave observable marks in the chemical properties of the galaxies, different from what a closed-box evolution predicts. Based on the experiences of the simplified models – but confirmed with the detailed models, the above characteristics also imply that
-
•
full loops in the N/O-O/H diagram are not realized, because the infall duration is short,
-
•
large loops or excursions will be rare, since they require the encounter with a massive cloud component which most probably is a rare species,
-
•
because of the short infall duration, galaxies are most likely to be observed during the slow evolution back towards the closed-box relation. If infall triggers enhanced star formation, the galaxies might be very bright at that early stage.
To model the global properties of galaxies of various masses, we assumed relations of star formation timescale and yield on galactic mass which we adjusted to reproduce the observed average relations of gas fraction, oxygen abundance, and effective yield with Hi mass. Evidently, our models cannot account for the appreciable dispersion of the observed galactic properties, because e.g. infall happens in reality during all stages of evolution. Following the chemical evolution for the 2 Gyrs after a single encounter with a HVC, we find that among galaxies less massive than about the deviations from models without infall events are substantial enough to provide some contribution to the observed scatter of galactic properties.
In the N/O-O/H diagram, the galaxies are mainly caught on the slow way back to the closed-box relation. Bright starburst galaxies might be observable at earlier stages, such as near the largest decrease in oxygen abundance. All this adds a quite significant dispersion towards the ‘upper-left’ side. Thus the dispersion of irregular galaxies towards N/O ratios higher than the plateau at might well be objects that had evolved until higher metallicities than they now have, but which suffered an infall episode with a HVC.
On the other hand, we note that the deviations remain somewhat limited; galaxies are likely to be observed in the vicinity of the closed-box relation. Thus, the N/O-O/H plot retains its sensitivity to the way the two elements are produced and incorporated in the interstellar gas. The diagram remains a very useful tool to infer details about stellar nucleosynthesis.
Acknowledgements.
The authors are grateful to Andreas Rieschick for stimulating discussions. J.K. acknowledges support by the University of Vienna for his visit and the hospitality of the Vienna Institute of Astronomy where the studies were completed.References
- (1) Blitz L., Spergel D.N., Teuben P.J., Hartmann D., Burton W.B., 1999, ApJ 514, 818
- (2) Braun R., Burton W.B., 1999, A&A 341, 437
- (3) Braun R., Burton W.B., 2000, A&A 354, 853
- (4) Broeils A.H., van Woerden H., 1994, A&AS 107, 129
- (5) Broeils A.H., Rhee M.-H., 1997, A&A 324, 877
- (6) Carignan C., Purton C., 1998, ApJ 506, 125
- (7) de Heij V., Braun R., Burton W.B., 2002, A&A 392, 417
- (8) Duc P.-A., Papaderos P., Balkowski C., Cayatte V., Thuan T.X., van Driel W., 1999, A&AS 136, 539
- (9) Duc P.-A., Cayatte V., Balkowski C., Thuan T.X., Papaderos P., van Driel W., 2001, A&A 369, 763
- (10) Edmunds M.G., Pagel B.E.J., 1978, MNRAS 185, 78P
- (11) Garnett D.R., 1990, ApJ 360, 142
- (12) Garnett D.R., Skillman E.D., Dufour R.J., et al., 1995, ApJ 443, 64
- (13) Garnett D.R., 2002, ApJ 581, 1019
- (14) Henry R.B.C., Worthey G., 1999, PASP 111, 919
- (15) Henry R.B.C., Edmunds M.G., Köppen J., 2000, ApJ 541, 660
- (16) Izotov Y.I., Thuan T.X., 1999, ApJ 511, 639
- (17) Kennicutt R.C., Skillman E.D., 2001, ApJ 121, 1461
- (18) Kilborn V.A., Stavely-Smith L., Marquarding M., et al., 2000, AJ 120, 1342
- (19) Köppen J., Edmunds M.G., 1999, MNRAS 306, 317
- (20) Kobulnicky H.A., Skillman E.D., 1996, ApJ 471, 211
- (21) Maeder A., 1992, A&A 264, 105
- (22) Mateo M., 1998, ARAA 36, 435
- (23) Matteucci F., 1986, PASP 98, 973
- (24) Pisano D.J., Kobulnicky H.A., Guzman R., Gallego J., Bershady M.A., 2001, ApJ 122, 1194
- (25) Salzer J.J., Rosenberg J.L., Weisstein E.W., Mazzarella J.M., Bothun G.D., 2002, AJ 124, 191
- (26) Skillman E.D., Bomans D.J., Kobulnicky H.A., 1997, ApJ 474, 205
- (27) van den Hoek, Groenewegen M.A.T., 1997, A&AS 123, 305
- (28) van Zee L., 2001, AJ 121, 2003
- (29) van Zee L., Haynes M.P., Salzer J.J., 1997a, AJ 114, 2497
- (30) van Zee L., Haynes M.P., Salzer J.J., Broeils A.H., 1997b, AJ 113, 1618
- (31) van Zee L., Salzer J.J., Haynes M.P., 1998a, ApJ 497, L1
- (32) van Zee L., Salzer J.J., Haynes M.P., O’Donoghue A.A., Balonek T.J., 1998b, AJ 116, 2805
- (33) van Zee L., Skillman E.D., Salzer J.J., 1998c, AJ 116, 1867
- (34) van Zee L., Salzer J.J., Skillman E.D., 2001, AJ 122, 121
- (35) Vila-Costas M.B., Edmunds M.G., 1993, MNRAS 269, 199
- (36) Young L.M., Lo K.Y., 1996, ApJ 462, 203
- (37) Young L.M., van Zee L., Lo K.Y., Dohm-Palmer R.C., Beierle M.E., 2003, ApJ 592, 111