11email: ruben@iac.es; cmt@iac.es; jalfonso@iac.es 22institutetext: Laboratoire d’Astrophysique de Marseille, BP8, Traverse du Siphon, F-13376 Marseille, France
22email: jorge.iglesias@oamp.fr 33institutetext: Instituto de Astrofísica de Andalucía, CSIC, Apdo. 3004, E-18080 Granada, Spain
33email: jvm@iaa.es
The V-band luminosity function of galaxies in A2151
We present a wide field -band imaging survey of approximately 1 deg2 ( Mpc2) in the direction of the nearby cluster of galaxies Abell 2151 (the Hercules Cluster). The data are used to construct the luminosity function (LF) down to , thus allowing us to study the dwarf galaxy population in A2151 for the first time. The obtained global LF is well described by a Schechter function with best-fit parameters and . The radial dependence of the LF was investigated, with the faint-end slope tending to be slightly steeper in the outermost regions and farther away than the virial radius. Given the presence of significant substructure within the cluster, we also analysed the LFs in three different regions. We find that the dwarf to giant ratio increases from the northern to the southern subcluster, and from low to high local density environments, although these variations are marginally significant (less than 2).
Key Words.:
galaxies:photometry – galaxies:luminosity function – galaxies:clusters:A21511 Introduction
The luminosity function (LF) of galaxies (that is, the probability density of galaxies in a certain population of a given luminosity) is one of the key observable quantities for galaxy evolution theories (Binggeli, Sandage & Tammann 1988), although the link between the data and the underlying physics is still not easily understood (Benson et al. 2003). Galaxies in high density environments, such as rich galaxy clusters, can evolve rapidly (less than 1 Gyr) due to different physical processes, e.g. harassment (Moore et al. 1996), ram-pressure stripping (Gunn & Gott 1972; Quilis, Moore & Bower 2000), tidal effects and mergers (Toomre & Toomre 1972; Bekki, Couch & Shioya 2001; Aguerri, Balcells & Peletier 2001) or starvation (Bekki, Couch, & Shioya 2002). The LF should reflect this important role of the environment in regulating galaxy evolution. Recent results from large surveys (De Propris et al. 2003) point towards the composite LF of cluster galaxies having a characteristic magnitude that is approximately 0.3 mag brighter and a faint-end slope (directly related to the ratio of dwarf to giant galaxies, D/G) that is approximately 0.1 steeper than those found for field galaxies. As hierarchical galaxy formation theories predict the formation of large numbers of low mass halos, the latter observational evidence may indicate the existence of some mechanism that eliminates at least the visible component of galaxies in low density regions (Tully et al. 2002).
A2151 (the Hercules cluster), together with A2147 and A2152, forms part of the Hercules Supercluster, one of the largest and most massive structures in the local Universe (Chincarini, Thompson & Rood 1981; Barmby & Huchra 1998). The kinematical analysis of Barmby & Huchra (1998) reveals that A2151 and A2147 are probably bound to each other, and that the supercluster as a whole may also be bound. A2151 () is an irregular and spiral-rich cluster ( 50%, Giovanelli & Haynes 1985). There is strong evidence (from optical and X-ray studies) suggesting that the cluster is still in the process of collapsing: the lack of hydrogen deficiency in the spiral population (Giovanelli & Haynes 1985; Dickey 1997), the bumpy distribution of the hot intracluster gas and its low X-ray flux (Magri et al. 1988; Huang & Sarazin 1996), and the presence of at least three distinct subclusters (Bird, Davis & Beers 1995, BDB hereafter). All this evidence indicates that A2151 is a young and relatively unevolved cluster, thus making it an excellent target for studying the LF and establishing comparisons with more evolved systems. Throughout this article we assume a value of km s-1 Mpc-1, which puts A2151 at a distance of 147 Mpc.
The aim of this paper is to study the LF of A2151 down to the dwarf regime,thus extending the previous work of Lugger (1986), who computed the -band LF of the cluster over a wide area (4.6 4.6 Mpc2) but only down to . The paper is arranged as follows: in Section 2 we describe the observations and data reduction procedures. Section 3 gives the details of the source extraction and star/galaxy separation, and the estimate of the limiting magnitudes of the sample. In Section 4 we present the LF in A2151 and analyse possible variations of its parameters within location in the cluster. Finally, Section 5 discusses the results.
|
a Coordinates correspond to the centre of the WFC. See http://www.ing.iac.es/Astronomy/instruments/wfc/index.html for a detailed description of the spatial arrangement of the mosaic.
2 Observations and data reduction
Observations were carried out with the Wide Field Camera at the 2.5 m Isaac Newton Telescope (INT), located at the Observatorio del Roque de los Muchachos during four different runs in the period 1999–2002. The WFC consists of four thinned AR-coated EEV 4k 2k CCDs and a fifth one acting as an autoguider. The pixel scale is 0.33 arcsec pixel-1, giving a total field of view of about 34 34 arcmin2. A square area of about 11 11 arcmin2 is lost at the top right corner of the field due to the particular arrangement of the detectors. The top left corner of Detector #3 is also lost because of filter vignetting.
We imaged a mosaic of five overlapping pointings covering a total area of about 1.05 deg2 ( Mpc2) in the direction of the Abell 2151 cluster. The total exposure time for each field was 2 900 s using the Harris broad-band filter. A control field outside the Abell 2151 cluster was also observed in order to get the background galaxy counts with the same instrumental configuration as the cluster counts. Two 1000 s exposures were taken in the direction of the Landolt 107 field. The average seeing of the fields ranged between 1.1 and 1.7 arcsec, with a maximum value of 2 arcsec in one of the CCDs. Table 1 shows a detailed log of the observations.
Data reduction consisting of bias subtraction and flat-fielding was carried out in the usual way using the IRAF reduction package.111IRAF is distributed by the National Optical Astronomy Observatories, operated by the Association of Universities for Research in Astronomy, Inc., under cooperative agreement with the National Science Foundation. The images corresponding to the Abell 2151 field were calibrated using aperture magnitudes of bright galaxies taken from Takamiya, Kron & Kron (1995) since no standard stars were available for the photometric calibration (see Table 1). The differences between our calibrated magnitudes and those of TKK95 for galaxies in our central field (computed within an aperture of 17.5 arcsec radius) never exceeded 0.05 mag. Photometric zero points for the remaining fields were calculated by cross-correlating aperture magnitudes of common objects in the overlapping chips, for which we obtained a maximum dispersion of 0.18 mag at the faintest magnitudes. On the other hand, the background field was accurately calibrated since several standards from the Landolt 107 field (Landolt 1992) show up in the different frames. All the magnitudes were corrected for Galactic extinction using the Schlegel, Finkbeiner & Davis (1998) dust maps and the Cardelli, Clayton & Mathis (1989) extinction curve.
3 Data Analysis
3.1 Source extraction
Identification and extraction of sources was carried out using the automated code SExtractor (for specific details see Bertin & Arnouts 1996). Objects are identified as every detection having a certain minimum area and number counts above a limiting threshold taking the sky local background as a reference. These limiting sizes and fluxes were set to 36 pixels 222this corresponds to an apparent size of 2 arcsec, which is the maximum seeing disc size in our frames. and twice the standard deviation of the sky counts, respectively. More precisely, sources were extracted using a background-weighted method, so that in every case the threshold takes a local value. This avoids a lot of spurious detections in the surroundings of bright galaxy halos and saturated stars, where the local threshold is significantly increased. Careful visual inspection of the frames was carried out and all definitely spurious entries were removed from the catalogues, such as H ii regions of spiral galaxies, which fulfil all the above-stated requirements.
The separation between stars and galaxies was performed on the basis of the SExtractor stellarity index (S/G hereafter). The code assigns a numerical value between 0 and 1 to all detections according to the following criteria: star-like objects have values close to 1 while galaxy-like objects are closer to 0. This S/G classifier behaves correctly for bright objects but breaks down at the lower magnitude end (especially in bad seeing conditions), where a correct classification remains difficult.
In order to test the reliability of the index we simulated artificial isolated 333we stress this fact because the S/G classifier has more problems when classifying stars overlapping with other objects or lying in galactic halos. stars and recovered them using SExtractor and the same selection criteria as for the Hercules fields. The stars were generated with the artdata.mkobjects package in IRAF and then added into frames reproducing the same sky counts and S/N ratio as the scientific ones. The PSF profiles were assumed to be Gaussian 444we also tried with a more realistic Moffat function, but differences in limiting magnitude and S/G values were negligible. and FWHMs spanned the values of our seeing conditions. A total number of 750 stars were simulated in the magnitude range 17 23 for two different seeing conditions (1.2 and 2 arcsec FWHMs).

The classification of star-like objects is easily done for good seeing frames (S/G ), whilst the S/G values span a wider range in worse conditions (S/G for simulated point-like sources brighter than ). Photometry in all the cases was almost perfect, with differences between input and recovered magnitudes of less than 0.05 mag even for the faintest stars. As will be shown in Sect. 3.2.1, our limiting magnitude for cluster galaxies is 21. Thus, we cautiously set a value of S/G 0.85 for the star-like objects in all the frames, which corresponds to the S/G value of simulated stars one magnitude fainter than our limiting magnitude. All the detections having 0.8 S/G 0.85 were carefully inspected by means of IMEXAM, along with bright saturated stars that tend to have lower S/G values. Those detections with obvious stellar origin were removed from the catalogues. After this exercise we expect the lowest contamination by stars possible, although perfect cleaning is almost unachievable for the faintest magnitudes. There is a further concern about losing compact dwarf galaxies as so-called ultra compact dwarfs (UCDs; Drinkwater et al. 2000), which can assume a stellar appearance in ground-based images. However, these galaxies typically have intrinsic magnitudes much fainter () than our limiting magnitude and the dwarfs we are able to detect have low probability of being misclassified (see Sect. 3.2.1).
3.2 Photometry


3.2.1 Sample completeness
One of the key problems in the study of LFs is knowledge of detection limits and completeness of the data. In order to make this estimation we followed two different approaches.
First, for all our detected objects we computed the mean central surface brightness () measured in a circular aperture of area equal to the minimum detection area used in SExtractor. Figure 1 shows as a function of apparent magnitude for all the detected sources (stars and galaxies). Stars occupy the upper diagonal locus, with saturated objects defining the flat region of the distribution. Galaxies are located in the lower-most broader region of the plot.
The different locations of point-like and extended objects is evident at bright magnitudes (), while the effects of seeing make this distinction at fainter magnitudes difficult. We have computed the 2 isophotal detection limit used in SExtractor, which corresponds to mag arcsec-2 (horizontal dashed line in Fig. 1). Given the distribution of the objects in Fig. 1, appears to be the appropriate limiting magnitude of our sample, as we do not lose objects because of their low surface brightness.
Secondly, we simulated artificial galaxies and, as we did with stars, placed them in frames with conditions (seeing, S/N) identical to the scientific ones, in order to recover them with SExtractor. We generated galaxies with two different morphological types and different intrinsic half-light radii (one exponential profile with = 0.75, 1.5 and 3 kpc, and one Sérsic profile (Sérsic 1968) with n = 2 and = 0.5 kpc) in the magnitude range 17 23 (18.85 12.85) and with three different axial ratios (0.3, 0.6, and 0.9). A total number of 1500 galaxies were generated for each of the morphologies in order to get enough statistics. The choice of these models was motivated by the quantitative morphological studies of the populations that are supposed to dominate the faint-end of the LF in nearby clusters (dE and dSph mainly), which show that these galaxies lie in a well defined region on a vs. n plot. Figure 2 shows structural parameters of dE and dSph galaxies in the Virgo Cluster taken from Binggeli & Jerjen (1998) and Barazza, Binggeli & Jerjen (2003) (open circles and open triangles, respectively), while filled squares correspond to our artificial galaxies. Objects with larger effective radii are known to present fainter surface brightness, which renders their detection difficult. For this reason we modelled one object with n = 2 and slightly larger than those observed and another galaxy with n = 1 and = 3 kpc; the latter are typical parameters of the low surface brightness (LSB) galaxies studied by de Blok et al. (1995). Note (see Fig. 2) the apparent lack of this kind of galaxy in this Virgo sample. LSB galaxies are known to be the most unstable systems during cluster evolution, suffering from rapid encounters and strong tidal shocks (harassment, see Moore et al. 1999), therefore rare in relaxed clusters. However, as mentioned, the Hercules cluster is still in process of collapse and harassment might have produced little effect on such a kind of LSB. On the other hand Andreon & Cuillandre (2002) show that a large population of low surface brightness galaxies dominate the LF in Coma, representing the main contribution at faint magnitudes. As it is not obvious which kind of galaxy is the predominant one in the cluster environment, we cautiously set the limiting magnitude of the lowest surface brightness model as our sample limit.
The results of our simulations are summarized in Fig. 3, where we plot the fraction of recovered galaxies () vs. input apparent magnitude (as given by MAG_BEST) for each galaxy type (solid lines); shaded regions correspond to recovered magnitude differences, which are always below 0.3 mag. We find that the detection and estimate of magnitudes are less accurate for galaxies with larger effective radii than smaller ones. Within each of the morphological types, edge-on galaxies are more easily detected than face-on ones, but the differences are small enough that we could focus our analysis on averaged numbers. All these results were expected, for it is widely known that detection limits strongly depend on the interplay between magnitudes, effective radius and inclination. The recovered S/G parameters for the simulated sample were always smaller than 0.75. From Fig. 3 it is apparent that detection efficiencies strongly depend on the structural parameters of galaxies.
Our limiting magnitude, as derived from the relation, is 21 ( at A2151 distance). From the simulations, this value ensures that our sample is at least 80% complete, with the worst case that of LSB galaxies. In order to construct the LF of A2151, only objects brighter than this limiting magnitude were considered.
3.3 The control field
The most reliable method for computing deep LFs of cluster galaxies in our type of survey is by means of a statistical subtraction of background/foreground number counts from a control field, since the spectroscopic information is usually limited to the brightest galaxies. 555Redshift data in the Supercluster are only complete down to 15.1 mag, see Barmby & Huchra (1998). It should be noted that the selection of the control field is critical, for the final results derived from the LF strongly depend on this choice. The selected field must fulfil the requirement that the area is large enough so the cosmic variance and number count statistics, the main error sources in LF determination, are minimized. We imaged the SA107 (, ) flanking field for these purposes, where the presence of photometric standards provided us with high photometric precision for the background counts. In order to ensure reliable subtraction, the background field should contain a population of objects similar to that of the cluster. We checked this by constructing a plot like the one in Fig. 1, with the result that the population of objects in the background and in our cluster fields were similar. The number counts in this field are plotted in Fig. 4, together with other -band counts taken from different sources in the literature.666The data from the MGC of Liske et al. (2003) were transformed from the -band using their average = 0.94. The fair agreement between these counts, each taken with different instrumentation under distinct conditions, makes us confident that the resulting LF derived by subtracting our control field counts is significant, with the advantage of having been obtained under the same instrumental set-up as the cluster counts.

|
|
4 The Luminosity Function
The luminosity function of galaxies in A2151 was computed as the statistical difference between the counts in the cluster and control field samples. Once again we stress that final results obtained for the LF will strongly depend on the galaxy counts used for foreground/background decontamination. Thus, in order to minimize this influence, we used large bin widths (1 mag) compared to photometric uncertainties (see Sect. 2 and Sect. 3.2.1), and checked that galaxy counts in the SA107 field remained stable from chip to chip.

Following Huang et al. (1997), errors from both Poissonian and non-Poissonian fluctuations of counts have been taken into account. Inclusion of this cosmic variance points to the fact that background counts in the cluster line of sight are not exactly those in our control field. This error source affects both the cluster and control field samples (Andreon & Cuillandre 2002). Our final error bars include this latter term, along with both the contribution of photometric error of the zero point and the Poissonian uncertainties of both samples. For simplicity, all these sources were added in quadrature despite of their different nature.
After background galaxy counts subtraction, the data were fitted to a Schechter function (Schechter 1976):
| (1) |
Our fitting algorithm minimizes the by taking errors into account and assigns a statistical weight to each of the points (1/, where corresponds to its error term).
In Fig. 5 we plot our LF for the total area covered in this study down to 21 mag. We find that the Schechter function is a good representation of the LF in A2151 ( 0.69) with best-fit parameters , M and .
In order to make a better estimate of the faint-end slope of the LF, we fitted our data to an exponential function of the type where are magnitudes and is related to the parameter of the Schechter function by the following expression:
| (2) |
We derive a best-fit value of ( 0.54) in the magnitude range , which corresponds to and is thus consistent with the value derived from the Schechter function.
Lugger (1986) computes the -band LF of A2151 in a region 4.6 Mpc a side, but only down to , which is approximately five magnitudes brighter than our limit. She derived a value of , similar to ours despite of other big differences between both studies: photographic plates vs. CCD images, different surveyed areas and limiting magnitudes, different bands.
It is well known that the and M∗ parameters of the Schechter function show a high degree of correlation (Schechter 1976), so that their values and errors are coupled. In order to avoid this effect, we computed the dwarf to giant ratio (D/G) in A2151 from the LF itself. Dwarf galaxies were defined as those having magnitudes , while giants were those brighter than . The transformation to -band magnitudes was carried out using the average for galaxies in nearby clusters in the GOLDMine database (Gavazzi et al. 2003). We obtained a value of D/G = 5.13 0.82 over the whole surveyed area. Errors were computed using a Monte Carlo method, generating 100 LFs uniformly distributed within the 1 uncertainty region, and then computing the D/G for all of them. The final error was taken as the dispersion of this distribution.
In the following subsections we investigate the dependence of the LF on environment within the cluster.
4.1 Radial Analysis of the LF
The dependence of the LF on the cluster region has been studied by several authors, mainly for nearby clusters (but see Andreon 2001 and Pracy et al. 2004 for this kind of study at intermediate redshift clusters). The pioneering work of Lugger (1989) shows that the faint-end of the LF tends to be flatter in high-density regions than in low-density regions. More recently, various authors have claimed the faint-end slope is steeper as we move outwards within the cluster than in the inner regions (e.g. Sabatini et al. 2003 for Virgo, Beijersbergen et al. 2002 and Iglesias-Páramo et al. 2003 for Coma). Independent studies (Aguerri et al. 2004) have shown that the core of the Coma Cluster is indeed dwarf-depleted when compared with the outer regions, giving rise to the observed steepening.
We therefore wanted to explore this trend in A2151. For this purpose, we divided our area in four different annuli from inside the core radius, , to outside the virial radius, (0.24 Mpc and 1.5 Mpc respectively, see Girardi et al. 1998) and computed their LFs. As the X-ray emission from the cluster shows a very irregular and bumpy structure, the cluster centre was assumed coincident with the optical centre of mass (, ) derived by Tarenghi et al. (1980). A summary of the results is listed in Table 2, where it can be seen that there is a tendency of increasing faint-end slope as we move outwards in the cluster. However, the large uncertainties in the parameter do not allow us to claim this trend with significance. It is worth noticing that the parameter is highly unconstrained in both the innermost and outermost annuli, showing that these LFs are better described with an exponential function rather than with a Schechter one. Because of the limited statistics (small area covered), the number counts of background objects become almost equal to A2151 counts in the most external region, so that the LFs in the outermost annuli suffer from small number statistics, leading to large errors in slope determination. These cases are where non-parametrical estimation of the D/G ratio provides a more robust study of luminosity segregation.

We computed the radial dependence of the D/G ratio in these four annuli as in Section 4. The result is plotted in the upper panel of Fig. 6, where the aforementioned trend of increasing D/G ratio as we move outwards within the cluster is apparent. In order to determine the origin of this increase, we analysed the radial density profiles of the dwarf and giant populations within A2151. The lower panel of Fig. 6 shows that the variation is mainly due to a more rapid radial decrease in the giant population (dotted line + triangles), while dwarf galaxies (solid + diamonds) present a more extended distribution (flatter profile). It is also clear from Fig. 6 that in the core of A2151, dwarf galaxies follow the same behaviour as the giant population so that it appears not to be dwarf-depleted. Lugger (1989) studies the radial dependence of the LF in A2151 by computing it in different annuli out to 1.2 Mpc from the cluster centre. She finds that all LFs were consistent with that of the global cluster, so that no significant variation was evident. Her result is easily understood if we take into account that we are only able to establish a trend of increasing D/G despite of reaching much deeper magnitudes.


4.2 D/G ratio as a function of local galaxy density
Phillips et al. (1998) pointed out the existence of a relation between the population of dwarf galaxies in a cluster and the local density, analogous to the morphology–density relation established for bright galaxies by Dressler (1981). This relation implies that dwarf galaxies are more common in lower density environments, and is valid for both local and medium redshift galaxy clusters (Pracy et al. 2004).
We computed the D/G ratio as a function of the projected local density () for A2151 (see Fig. 7). The D/G were calculated by computing the number of dwarf galaxies within a circle of radius equal to the distance to the 10th nearest giant (bright) galaxy. Giant and dwarf galaxies were defined as in Section 4. The areas for the computation of were calculated numerically in order to take the gaps and overlapping regions in the mosaic into account. Field subtraction was performed using the counts in the SA107 background field.
It is to be noted from Fig. 7 that the projected local density in A2151 is not as large as in other nearby rich clusters such as Coma (Trujillo et al. 2002). However, our data cover a wide local density range, reaching the outermost regions of the cluster where densities are very low. Figure 7 also shows that the dwarf galaxy density relation is only marginal in A2151, with dwarf galaxies slightly more numerous at lower densities. This relation is as significant as that derived by Phillips et al. (1998), but not as clean as the one recently derived by Pracy et al. (2004) for A2218.
4.3 Subclustering
In Fig. 9 we show the X-ray map of the central part of A2151 as observed with ROSAT (grey-scale distribution), together with the luminosity-weighted galaxy density contours (figure taken from Huang & Sarazin 1996). This figure clearly shows that A2151 exhibits substantial subclustering with at least three distinct subclusters identified in the dynamical analysis of BDB. In our mapping, we cover two of them (A2151N and A2151C, see Fig. 9) while A2151E is out of our survey. However, as can be seen from the luminosity-weighted galaxy density contours, a fourth overdensity (namely A2151S) seems to exist in the southernmost region of the cluster, though it was not identified as a distinct entity by the KMM algorithm of BDB.
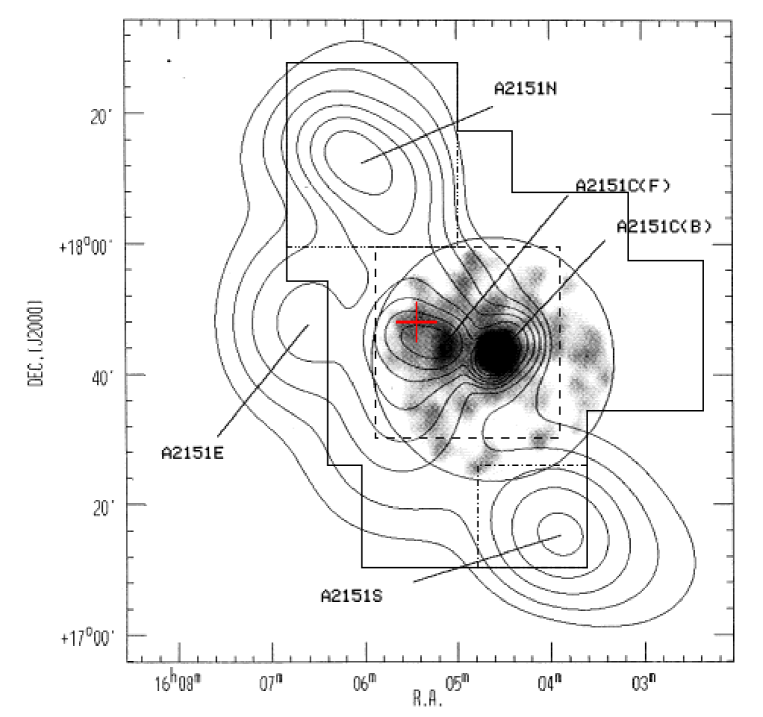

As we have shown that the radial LF steepens slightly in the outer regions, we computed the LFs of A2151N, A2151C and (partly) A2151S in the areas delimited by the small squares (dashed and dotted lines) in Fig. 9 in order to look for variations among the subclusters.
The results of such analysis are shown in Table 3 and in Figure 8. We find that there is a tendency towards increasing from the northern to the southern subcluster, although this difference is less significant than 2 (see Fig. 10). From this figure it is also evident that is highly unconstrained in A2151N and A2151S, which means that an exponential law provides a better description of their LFs. With respect to the central subcluster, its LF presents parameters similar to those of the global LF, revealing that A2151C might be its major contributor.
As for the radial LFs, we computed the D/G ratio in the three subclusters to confirm that A2151S shows the largest ratio of all of them (see Table 3). A more detailed inspection of its LF points out that the cause of this enhancement is an increase in the population of faint galaxies in the southernmost subcluster with respect to the others.
5 Discussion and conclusions
We studied the LF of galaxies in A2151 following four different approaches: the analysis of the global LF, its radial variation, and the dependence with subclustering and local density.
The global LF of galaxies in the cluster exhibits a non-flat faint-end slope (). This is not in line with recent results by Valotto et al. (2004), who claim that clusters with significant X-ray emission (that of A2151 or greater) present flat LFs () while steeper slopes are due to projection effects in non X-ray emitting clusters. In the literature there are few measurements of the LF of cluster galaxies in the -band. It is important to compare results from the same bandpass, because the parameters of the LF are known to change with wavelength (Beijersbergen et al. 2002). Considering clusters in the nearby Universe, Lobo et al. (1997) study the -band LF in the central part of Coma, and find a faint-end slope , significantly steeper than our value for A2151. However, this result has been challenged recently by other authors (Beijersbergen et al. 2002 ; Iglesias-Páramo et al. 2003; Mobasher et al. 2003). At intermediate redshift, Mercurio et al. (2003) analyse the LF of ABCG209 at and find , which is consistent with the value presented in this paper.777It should be noticed that at the rest-frame -band is redshifted almost to . In another recent paper, Pracy et al. (2004) compute the LF of the cluster A2218, finding a somewhat steeper slope of , still compatible with ours within the errors. Indeed, comparisons of LFs of clusters at different redshifts and distinct evolutionary states raise the problem of the possible evolution in time of galaxies in the cluster, but we simply intend to point out that the values presented in this paper are similar, within the errors, to those found for other clusters in different global conditions.
The radial LF of A2151 shows a trend of increasing faint-end slope as we move outwards in the cluster. Similar results were obtained in other clusters, where the slope increases even more significantly towards the outermost regions (Sabatini et al. 2003; Andreon 2001; Mercurio et al. 2003; Beijersbergen et al. 2002). This has usually been explained as dwarf galaxies being destroyed in the inner parts of the clusters, though it is important to notice that (or the D/G ratio) can vary due to changes both in the dwarf or/and giant population. We have therefore computed the number of dwarf and giant galaxies as a function of the projected radial distance to the centre of A2151. The dwarf galaxy population in A2151 has a more extended distribution than giant galaxies, resulting in an increase of the D/G ratio as we move outwards.
Alternatively, we investigated the relation between the D/G ratio and the projected local giant galaxy density. As expected, we found that A2151 has more dwarf galaxies in the lower density environments, but this relation is found to be only marginal.
The LFs of the three studied subclusters present dissimilar values of . Although this difference is only marginally significant (less than 2), there is a trend of the faint-end slope to increase from the northern to the southern subcluster, where faint galaxies are more abundant than in the other two subclusters.
We plan to extend this study in the future to the rest of the Hercules Supercluster, where the environment should clearly reveal its influence. The combination of this data with morphologies and velocities for cluster members will help us to shed light on the evolutionary status of galaxies within the Supercluster.
Acknowledgements.
This work has made use of the NASA/IPAC Extragalactic Database (NED) which is operated by the Jet Propulsion Laboratory, California Institute of Technology, under contract with the National Aeronautics and Space Administration. The INT is operated on the island of La Palma by the ING group, in the Spanish Observatorio del Roque de Los Muchachos of the Instituto de Astrofísica de Canarias. This work has made use of the ING data archive in Cambridge and of the ING service programme at ORM. This paper has been funded by the Spanish DGES, grant AYA2001-3939. RSJ acknowledges support from the Academia Canaria de Ciencias.References
- Aguerri, Balcells, & Peletier (2001) Aguerri, J. A. L., Balcells, M., & Peletier, R. F. 2001, A&A, 367, 428
- Aguerri, Iglesias-Paramo, Vilchez, & Muñoz-Tuñón (2004) Aguerri, J. A. L., Iglesias-Paramo, J., Vilchez, J. M., & Muñoz-Tuñón, C. 2004, AJ, 127, 1344
- Andreon & Cuillandre (2002) Andreon, S. & Cuillandre, J.-C. 2002, ApJ, 569, 144=
- Andreon (2001) Andreon, S. 2001, ApJ, 547, 623
- Arnouts et al. (1997) Arnouts, S., de Lapparent, V., Mathez, G., Mazure, A., Mellier, Y., Bertin, E., & Kruszewski, A. 1997, A&AS, 124, 163
- Barazza, Binggeli, & Jerjen (2003) Barazza, F. D., Binggeli, B., & Jerjen, H. 2003, A&A, 407, 121
- Barmby & Huchra (1998) Barmby, P. & Huchra, J. P. 1998, ApJ, 115, 6B
- Beijersbergen, Hoekstra, van Dokkum, & van der Hulst (2002) Beijersbergen, M., Hoekstra, H., van Dokkum, P. G., & van der Hulst, T. 2002, MNRAS, 329, 385
- Bekki, Couch, & Shioya (2001) Bekki, K., Couch, W. J., & Shioya, Y. 2001, PASJ, 53, 395
- Bekki, Couch, & Shioya (2002) Bekki, K., Couch, W. J., & Shioya, Y. 2002, ApJ, 577, 651
- Benson et al. (2003) Benson, A. J., Bower, R. G., Frenk, C. S. , Lacey, C. G., Baugh, C. M., & Cole, S. 2003, ApJ, 599, 38
- Bertin & Arnouts (1996) Bertin, E. & Arnouts, S. 1996, A&A, 117, 393
- Binggeli & Jerjen (1998) Binggeli, B. & Jerjen, H. 1998, A&A, 333, 17
- Binggeli, Sandage, & Tammann (1988) Binggeli, B., Sandage, A., & Tammann, G. A. 1988, ARA&A, 26, 509
- Bird, Davis, & Beers (1995) Bird, C. M., Davis, D. S., & Beers, T. C. 1995, AJ, 109, 920
- Cardelli, Clayton, & Mathis (1989) Cardelli, J. A., Clayton, G. C., & Mathis, J. S. 1989, ApJ, 345, 245
- Casertano et al. (1995) Casertano, S., Ratnatunga, K. U., Griffiths, R. E., Im, M., Neuschaefer, L. W., Ostrander, E. J., & Windhorst, R. A. 1995, ApJ, 453, 599
- Chincarini, Thompson, & Rood (1981) Chincarini, G., Thompson, L. A., & Rood, H. J. 1981, ApJ, 249, L47
- de Blok, van der Hulst, & Bothun (1995) de Blok, W. J. G., van der Hulst, J. M., & Bothun, G. D. 1995, MNRAS, 274, 235
- De Propris et al. (2003) De Propris, R., et al. 2003, MNRAS, 342, 725
- Dickey (1997) Dickey, J. M. 1997, AJ, 113, 1939
- Dressler (1980) Dressler, A. 1980, ApJ, 236, 351
- Drinkwater, Jones, Gregg, & Phillipps (2000) Drinkwater, M. J., Jones, J. B., Gregg, M. D., & Phillipps, S. 2000, Publications of the Astronomical Society of Australia, 17, 227
- Gardner, Sharples, Carrasco, & Frenk (1996) Gardner, J. P., Sharples, R. M., Carrasco, B. E., & Frenk, C. S. 1996, MNRAS, 282, L1
- Gavazzi et al. (2003) Gavazzi, G., Boselli, A., Donati, A., Franzetti, P., & Scodeggio, M. 2003, A&A, 400, 451
- Giovanelli & Haynes (1985) Giovanelli, R. & Haynes, M. P. 1985, ApJ, 292, 404
- Girardi et al. (1998) Girardi, M., Giuricin, G., Mardirossian, F., Mezzetti, M., & Boschin, W. 1998, ApJ, 505, 74
- Gunn & Gott (1972) Gunn, J. E. & Gott, J. R. I. 1972, ApJ, 176, 1
- Huang et al. (1997) Huang, J.-S., Cowie, L. L., Gardner, J. P., Hu, E. M., Songaila, A., & Wainscoat, R. J. 1997, ApJ, 476, 12
- Huang & Sarazin (1996) Huang, Z. & Sarazin, C. L. 1996, ApJ, 461, 622
- Iglesias-Páramo et al. (2003) Iglesias-Páramo, J., Boselli, A., Gavazzi, G., Cortese, L., & Vílchez, J. M. 2003, A&A, 397, 421
- Landolt (1992) Landolt, A. U. 1992, A.J., 104, 340
- Liske et al. (2003) Liske, J., Lemon, D. J., Driver, S. P., Cross, N. J. G., & Couch, W. J. 2003, MNRAS, 344, 307
- Lobo et al. (1997) Lobo, C., Biviano, A., Durret, F., Gerbal, D., Le Fevre, O., Mazure, A., & Slezak, E. 1997, A&A, 317, 385
- Lugger (1986) Lugger, P. M. 1986, ApJ, 303, 535
- Lugger (1989) Lugger, P. M. 1989, ApJ, 343, 572
- Magri et al. (1988) Magri, C., Haynes, M. P., Forman, W., Jones, C., & Giovanelli, R. 1988, ApJ, 333, 136
- Mercurio et al. (2003) Mercurio, A., Massarotti, M., Merluzzi, P., Girardi, M., La Barbera, F., & Busarello, G. 2003, A&A, 408, 57
- Mobasher et al. (2003) Mobasher, B., et al. 2003, ApJ, 587, 605
- Moore et al. (1996) Moore, B., Katz, N., Lake, G., Dressler, A., & Oemler, A. 1996, Nature, 379, 613
- Moore et al. (1999) Moore, B., Lake, G., Quinn, T., & Stadel, J. 1999, M.N.R.A.S., 304, 465
- Phillipps, Driver, Couch, & Smith (1998) Phillipps, S., Driver, S. P., Couch, W. J., & Smith, R. M. 1998, ApJ, 498, L119
- Pracy et al. (2004) Pracy, M. B., De Propris, R., Driver, S. P., Couch, W. J., & Nulsen, P. E. J. 2004, MNRAS, 352, 1135
- Quilis, Moore, & Bower (2000) Quilis, V., Moore, B., & Bower, R. 2000, Science, 288, 1617
- Sabatini et al. (2003) Sabatini, S., Davies, J., Scaramella, R., Smith, R., Baes, M., Linder, S. M., Roberts, S., & Testa, V. 2003, MNRAS, 341, 981
- Schechter (1976) Schechter, P. 1976, ApJ, 203, 297
- Schlegel, Finkbeiner, & Davis (1998) Schlegel, D. J., Finkbeiner, D. P., & Davis, M. 1998, ApJ, 500, 525
- Sersic (1968) Sérsic, J. L. 1968, Cordoba, Argentina: Observatorio Astronomico, 1968
- Takamiya, Kron, & Kron (1995) Takamiya, M., Kron, R. G., & Kron, G. E. 1995, AJ, 110, 1083
- Tarenghi, Chincarini, Rood, & Thompson (1980) Tarenghi, M., Chincarini, G., Rood, H. J., & Thompson, L. A. 1980, ApJ, 235, 724
- Toomre & Toomre (1972) Toomre, A. & Toomre, J. 1972, ApJ, 178, 623
- Trujillo et al. (2002) Trujillo, I., Aguerri, J. A. L., Gutiérrez, C. M., Caon, N., & Cepa, J. 2002, ApJ, 573, L9
- Tully, Somerville, Trentham, & Verheijen (2002) Tully, R. B., Somerville, R. S., Trentham, N., & Verheijen, M. A. W. 2002, ApJ, 569, 573
- Valotto, Muriel, Moore, & Lambas (2004) Valotto, C. A., Muriel, H., Moore, B., & Lambas, D. G. 2004, ApJ, 603, 67