High resolution radio observations of the colliding-wind binary WR 140
Abstract
Milli-arcsecond resolution Very Long Baseline Array (VLBA) observations of the archetype WR+O star colliding-wind binary (CWB) system WR 140 are presented for 23 epochs between orbital phases 0.74 and 0.97. At 8.4 GHz, the emission in the wind-collision region (WCR) is clearly resolved as a bow-shaped arc that rotates as the orbit progresses. We interpret this rotation as due to the O star moving from SE to approximately E of the WR star, which leads to solutions for the orbit inclination of , the longitude of the ascending node of , and an orbit semi-major axis of mas. The distance to WR 140 is determined to be kpc, which requires the O star to be a supergiant. The inclination implies the mass of the WR and O star to be M⊙ and M⊙ respectively. We determine a wind-momentum ratio of 0.22, with an expected half-opening angle for the WCR of , consistent with derived from the VLBA observations. Total flux measurements from Very Large Array (VLA) observations show the radio emission from WR 140 is very closely the same from one orbit to the next, pointing strongly toward emission, absorption and cooling mechanism(s) that are controlled largely by the orbital motion. The synchrotron spectra evolve dramatically through the orbital phases observed, exhibiting both optically thin and optically thick emission. We discuss a number of absorption and cooling mechanisms that may determine the evolution of the synchrotron spectrum with orbital phase.
Subject headings:
stars:binaries:general — stars:early-type — stars:individual(WR 140 (catalog )) —stars:Wolf-Rayet — radio continuum:stars — astrometry1. Introduction
Wolf-Rayet (WR) stars have dense stellar winds from which free-free continuum emission is observed from near-IR to radio wavelengths. A significant proportion ( a quarter) of these objects also exhibit non-thermal radio emission (Leitherer et al., 1995, 1997; Chapman et al., 1999; Dougherty & Williams, 2000; Cappa et al., 2004), which requires the presence of a population of relativistic electrons, in addition to a magnetic field. The acceleration of particles in these objects is generally attributed to first-order Fermi acceleration in shocks within the stellar winds, arising either from wind instabilities (Chen & White, 1994) or, in the case of binary systems, collisions of the stellar winds of the two stars (Eichler & Usov, 1993). The colliding-wind binary (CWB) model is strongly supported by high-resolution radio, optical and infrared imaging of the very wide WR+OB binaries WR 146 and WR 147, where the non-thermal emission is shown to arise between the WR and OB stars at the point of ram-pressure balance between the two stellar winds (Dougherty et al., 1996; Williams et al., 1997; Niemela et al., 1998; Dougherty et al., 2000).
The archetype of CWB systems is the 7.9-year period WR+O binary system WR 140 (HD 193793). This binary comprises a WC7 star and an O4-5 star in a highly elliptical orbit (), where the stellar separation varies between AU at periastron to AU at apastron. This highly eccentric orbit clearly modulates the dramatic variations in the emission from the system, observed from X-ray to radio wavelengths (see Williams et al., 1990). The X-ray luminosity rises steadily toward periastron passage, while spectra taken just after periastron clearly show extra absorption that is visible until about phase 0.1 (Pollock et al., 2004). The near-IR emission is characterized by a sudden peak in emission shortly after periastron, followed by a slower decline. This behavior is attributed to dust formation in the WCR at some point shortly after periastron, and its subsequent cooling (Williams, 2002).
Perhaps the most dramatic variations are observed at radio wavelengths (Fig. 1), where there is a slow rise from a low, apparently thermal state close to periastron of a few mJy, to a frequency-dependent peak in emission of several 10s of mJy between orbital phase () 0.65 to 0.85, before a precipitous decline before periastron (Williams et al., 1990; White & Becker, 1995). The radio variations have been widely attributed to an underlying synchrotron source viewed through the changing free-free opacity of the extended stellar wind envelopes of the binary system along the line-of-sight to the WCR as the orbit progresses (Williams et al., 1990; Eichler & Usov, 1993; White & Becker, 1995). However, none of the free-free opacity models explain the radio light curve in a satisfactory manner. Alternatively, the variations may be in part due to processes intrinsic to the WCR. Changes in the stellar separation () alter the intrinsic synchrotron luminosity of the WCR (), and the free-free absorption and synchrotron self-absorption within the WCR (Dougherty et al., 2003a). Furthermore, the impact of the Razin effect and Coulombic cooling increases as the separation decreases. These processes are dominant at lower frequencies. Inverse-Compton (IC) cooling of the shocked gas in the WCR due to the intense ultra-violet radiation from the stellar components is important at higher frequencies, and also varies strongly with separation.
We report on high resolution radio observations of WR 140 obtained with the VLBA that image the WCR at a linear resolution of a few AU, approximately the stellar separation at periastron. These observations are used to constrain the orbit of WR 140, allowing the first reliable derivation of the orbital inclination, the longitude of periastron, and a robust distance estimate. In addition to supporting radiometry from the VLA and MERLIN, the high resolution observations are essential to constrain models of the WCR in WR 140.
2. Observations

2.1. VLBA observations
A 23-epoch campaign of observations of WR 140 at both 8421 MHz (X band) and 1667 MHz (L band) was carried out using the VLBA (Napier, 1995). The campaign was started on 1999 January 04 near the peak of radio emission around orbital phase 0.75. Observations continued until 2000 November 18 () when the radio emission had declined to close to radio minimum (see Fig:1 and could no longer be detected by the VLBA.
Data were received in dual circular polarizations, and acquired from four contiguous 8-MHz bands using four-level (2 bit) sampling for each polarization, providing a 32 MHz total bandwidth. The observations were performed using phase referencing (see Beasley & Conway, 1995) where regular observations of a nearby extra-galactic background source were made to derive residual antenna-based instrumental and atmospheric phase errors, which were then interpolated to correct the antenna gains during observations of WR 140. This technique allows the detection of weak emission by enabling direct Fourier inversion of the visibility data for imaging of WR 140, along with precise astrometric referencing of the images. The phase calibrator was J2002+456, separated from WR 140 by . A switching cycle of 90 seconds on a calibrator and 120 seconds on the target source was used, giving hrs on-source time for WR 140 at each epoch at each frequency. The absolute flux scale of the observations was based on internal noise source calibration. The data were correlated with the VLBA correlator in Socorro, New Mexico, and data calibration and imaging was done using standard techniques in the NRAO aips software package.
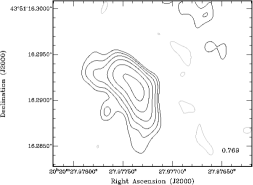
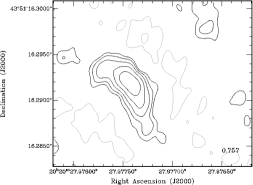
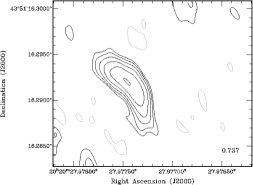
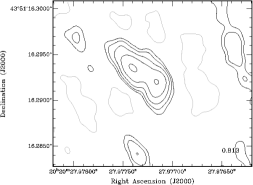
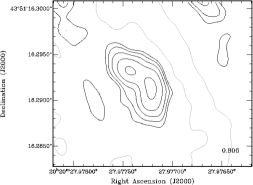
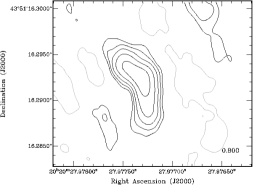
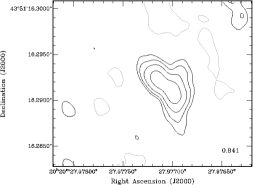
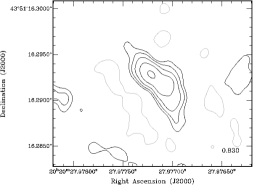
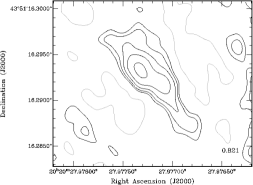
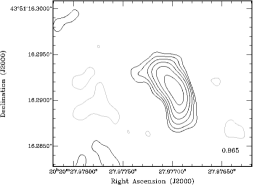
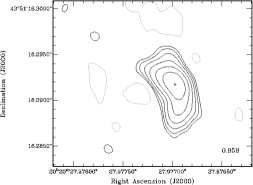
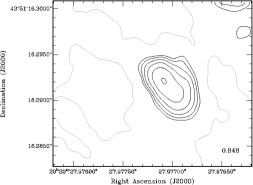
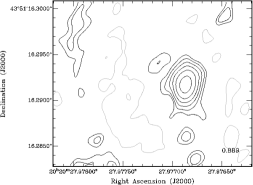
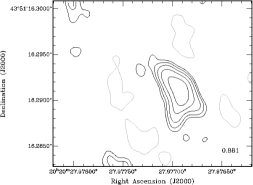
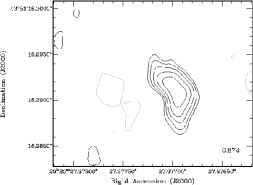
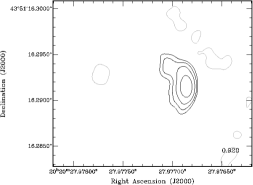
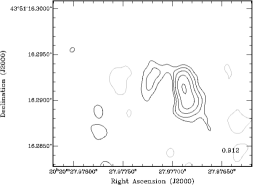
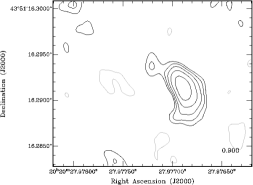
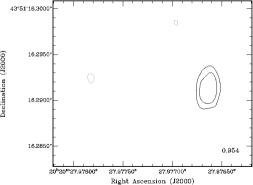
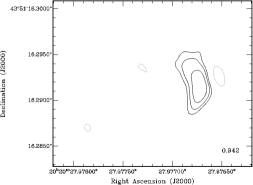
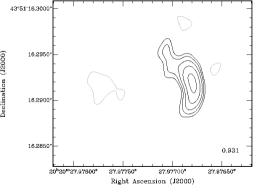
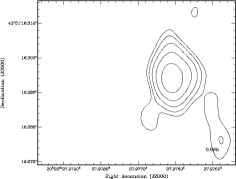
The resulting phase-referenced images at 8.4-GHz for each observation epochs are shown in Fig. 2, where the rms uncertainty of the image background is between 0.06 and 0.22 mJy beam-1. The nominal resolution (FWHM) of the synthesized beam is mas2, which at a distance of 1.85 kpc (see §3.2) gives a linear resolution of 3-4 AU, much smaller than the separation of the stellar components in WR 140 for the bulk of the orbit except close to periastron.
| Obs. Code | Obs. Date | PhaseaaBased on orbit period and epoch of periastron from Marchenko et al. (2003) | 8.4 GHz data | 1.7 GHz data | ||||||
|---|---|---|---|---|---|---|---|---|---|---|
| b,cb,cfootnotemark: | b,cb,cfootnotemark: | Flux ccDerived using aips routine jmfit | PAddPosition angle of the orientation of the emission arc - see §2.1 | ee is the observed opening angle of the WCR - see §3.2 | b,cb,cfootnotemark: | b,cb,cfootnotemark: | Flux ccDerived using aips routine jmfit | |||
| (ms) | (mas) | (mJy) | (∘) | (∘) | (ms) | (mas) | (mJy) | |||
| BB102A | 1999/01/04 | 0.737 | 0 | 0 | 10.5 | 73 | -0.889 | 4.45 | 12.4 | |
| BB102B | 1999/03/03 | 0.757 | -0.003 | 0.01 | 10.2 | 77 | -0.423 | -1.33 | 8.3 | |
| BB110A | 1999/04/08 | 0.769 | -0.045 | -0.34 | 10.3 | 70 | -0.428 | 0.86 | 14.0 | |
| BB109A | 1999/07/05 | 0.800 | -0.106 | 0.46 | 10.4 | 71 | -0.526 | 0.37 | 10.4 | |
| BB109B | 1999/07/23 | 0.806 | -0.126 | 0.19 | 8.3 | 63 | -0.394 | -0.56 | 14.6 | |
| BB109C | 1999/08/12 | 0.813 | -0.188 | 0.77 | 10.2 | 66 | -0.528 | 1.84 | 16.8 | |
| BB109D | 1999/09/06 | 0.821 | -0.184 | 1.44 | 11.0 | 85 | -0.601 | 2.70 | 18.0 | |
| BB109E | 1999/10/02 | 0.830 | -0.232 | 0.88 | 8.8 | 77 | -0.699 | 0.32 | 16.3 | |
| BB109F | 1999/11/01 | 0.841 | -0.400 | -0.26 | 8.2 | 73 | -0.773 | 0.23 | 9.5 | |
| BB117A | 1999/11/21 | 0.848 | -0.416 | -0.14 | 8.8 | 88 | - | - | ffUnable to adequately calibrate antenna phase - see §2.1 | |
| BB117B | 1999/12/22 | 0.858 | -0.464 | -0.30 | 10.5 | 68 | -1.215 | 4.75 | 16.5 | |
| BB117C | 2000/01/11 | 0.865 | -0.450 | -0.42 | 9.3 | 74 | -1.374 | 2.96 | 17.3 | |
| BB117D | 2000/02/05 | 0.874 | -0.469 | -0.73 | 8.1 | 70 | - | - | ffUnable to adequately calibrate antenna phase - see §2.1 | |
| BB117E | 2000/02/27 | 0.881 | -0.505 | -0.76 | 9.3 | 70 | - | - | ffUnable to adequately calibrate antenna phase - see §2.1 | |
| BB117F | 2000/03/19 | 0.889 | -0.581 | 0.02 | 7.4 | 90 | - | - | ffUnable to adequately calibrate antenna phase - see §2.1 | |
| BB124A | 2000/04/20 | 0.900 | -0.569 | -0.63 | 6.6 | 76 | - | - | ffUnable to adequately calibrate antenna phase - see §2.1 | |
| BB124B | 2000/05/26 | 0.912 | -0.591 | -1.01 | 5.9 | 81 | -1.038 | -0.86 | 8.7 | |
| BB124C | 2000/06/19 | 0.920 | -0.543 | 0.14 | 3.7 | 81 | -0.966 | 1.93 | 5.8 | |
| BB124D | 2000/07/21 | 0.931 | -0.629 | 0.15 | 3.9 | 79 | -1.012 | 2.96 | 7.2 | |
| BB125A | 2000/08/20 | 0.942 | -0.668 | 0.41 | 3.3 | 76 | -0.963 | 2.07 | 3.0 | |
| BB125B | 2000/09/25 | 0.954 | -0.804 | -0.56 | 1.9 | 83 | - | - | gg upper limit | |
| BB125C | 2000/10/22 | 0.963 | - | - | - | - | - | |||
| BB125D | 2000/11/18 | 0.973 | - | - | - | - | - | |||
The 8.4-GHz emission detected by the VLBA is clearly resolved. We identify this emission as arising from the WCR in WR 140 since this is the only emission in the system with sufficient brightness temperature ( K) to be detected by the VLBA. The stellar winds, with brightness of K are undetected. A bow-shaped ridge of emission is observed at most epochs, as anticipated for the WCR from model calculations (e.g. see Eichler & Usov, 1993; Canto et al., 1996; Dougherty et al., 2003a), with the bow shock wrapping around the star with the lower wind momentum - typically the O star. A bow-shaped WCR has been suggested from observations of other CWB systems (e.g. see Williams et al., 1997; Dougherty, 2002), but not as clearly as in the observations presented here.
Between orbit phase 0.74 and 0.95, the WCR exhibits proper motion that is largely from east to west, moving mas over the observing period, and also appears to rotate from “pointing” NW to W. These observations are key to unraveling the orbital motion of WR 140 which we discuss more fully in §3.1.
It appears the WCR has a similar extent (and flux) from phase 0.737 to 0.841, and then decreases in size, notably after phase 0.874, and again after phase 0.931. We have estimated the brightness temperature of the WCR through modelling of the visibilities at 8.4 GHz using the difmap analysis package at orbital phases 0.737, 0.858 and 0.931. At phase 0.737, the WCR extends out to mas from its centre and has a brightness temperature of K. This brightness temperature is essentially constant at phases 0.858 and 0.931, even though the WCR is considerably smaller by phase 0.931, only extending mas from the peak of emission.
Between phase 0.80 and 0.84, the arc of emission appears to develop two peaks along its ridge, which then fade away and the arc is reformed by phase 0.86. During these phases, it appears that the intensity from the stagnation point is reduced. The concurrent VLA observations (see §2.2) show a marked variation in flux at 1.5 GHz at this stage of the orbit. This emission is still brightening from around 18 mJy at phase 0.80 to a peak of 26 mJy at 0.83, before fading to 20 mJy by phase 0.85. This is followed by the suggestion of another slight brightening before the onset of the decline to minimum. There is little evidence of any similar brightening in the emission at the other observed frequencies.
| Obs. Date | PhaseaaBased on orbit period and epoch of periastron from Marchenko et al. (2003) | 1.5 GHz | 4.9 GHz | 8.4 GHz | 15 GHz | 22 GHz | Array |
|---|---|---|---|---|---|---|---|
| (mJy) | (mJy) | (mJy) | (mJy) | (mJy) | |||
| 1998/06/28 | 0.671 | bbOffset from = = | BnA | ||||
| 1999/05/19 | 0.783 | D | |||||
| 1999/06/13 | 0.792 | DnA | |||||
| 1999/07/06 | 0.800 | A | |||||
| 1999/07/13 | 0.802 | A | |||||
| 1999/07/31 | 0.809 | A | |||||
| 1999/10/03 | 0.831 | BnA | |||||
| 1999/10/21 | 0.837 | BnA | |||||
| 1999/11/06 | 0.842 | B | |||||
| 1999/11/21 | 0.848 | B | |||||
| 1999/12/04 | 0.852 | B | |||||
| 1999/12/27 | 0.860 | B | |||||
| 1999/12/29 | 0.861 | B | |||||
| 2000/01/14 | 0.866 | B | |||||
| 2000/02/23 | 0.880 | CnB | |||||
| 2000/03/29 | 0.892 | C | |||||
| 2000/04/14 | 0.898 | C | |||||
| 2000/05/11 | 0.907 | C | |||||
| 2000/06/21 | 0.921 | DnC | |||||
| 2000/07/17 | 0.930 | DnC | |||||
| 2000/09/27 | 0.955 | D | |||||
| 2000/10/15 | 0.961 | A | |||||
| 2000/11/21 | 0.974 | A |
A similar two-peaked structure was also apparent in MERLIN observations of WR 147, a very wide WR+OB CWB (Watson et al., 2002). It is difficult to attribute the reduced level of emission between the peaks seen in WR 147 to higher free-free extinction along that line-of-sight relative to the peaks because the line-of-sight extinction is very low in such a wide binary system. Alternatively, such a twin-peak structure may be the result of time-variable wind density resulting in changes in the post-shock density in the WCR. Certainly, between phase 0.80 and 0.84 the 15-GHz VLA observations of WR 140 (see Fig. 1) have large scatter that may be related to such structure changes. We draw attention to a similar structure seen in the synthetic 5 GHz image of WR 147 produced by Dougherty et al. (2003a, Figure 17). However, in this case, the structure is attributed to numerical instabilities in the hydrodynamics code used to generate the model (J. Pittard, priv. communication).
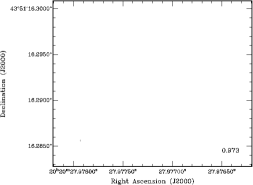
By phase 0.963, the WCR is no longer detected by the VLBA. This was expected from the radio light curve (see Fig. 1) since by this stage of the orbit, the radio emission at all frequencies has declined to less than a few mJy. Based on our experience from these observations, we expect to be able to detect the WCR again somewhere around phase 0.3-0.4 during the next orbit.
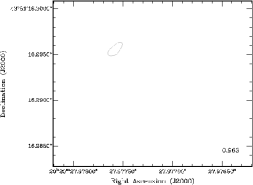
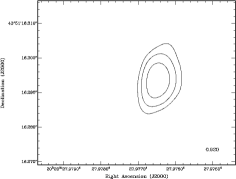
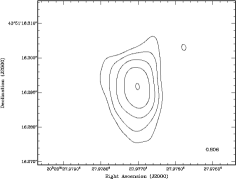
The WCR is also resolved in the 1.7-GHz observations (see Fig. 3). As at 8.4 GHz, proper motion of the source is suggested as the orbit progresses. However, the proper motion at 1.7 GHz does not appear as continuous as at 8.4 GHz. Our difficulties with the 1.7-GHz data can be attributed to rapidly varying differential ionospheric delay and phase offsets between the position of the phase-reference source and WR 140 during the observations. Throughout the observing campaign, solar activity was close to the maximum of its 11-year cycle, contributing to significant and rapid ionospheric variability.
A summary of the positions and fluxes of the VLBA data is given in Table 1. The fluxes and positions were derived at both 8.4 and 1.7 GHz using the aips routine jmfit. As a check, fluxes were also determined using tvstat, where values within % of those derived with jmfit were found. This difference is approximately the uncertainty that is to be expected in the absolute flux scale calibration. However, no flux uncertainty is quoted in Table 1 since the VLBA resolves out % of the emission from WR 140 (see Sec. 2.2). The uncertainty in the positions is most likely dominated by ionospheric delay and phase offset error, certainly at 1.7 GHz. Since delay and offset , they are also likely to dominate at 8.4 GHz over the Gaussian source fitting errors, which are a fraction of a milli-arcsecond in these images. For epochs where the WCR emission appears double-peaked, the mid-point of the two peaks is quoted. Also included in Table 1 are our estimates of the position angle of the axis of symmetry of the WCR, along with their uncertainty. We also include estimates of the opening angle of the WCR. Though not entirely robust, we believe each of these estimates are good to first order.
2.2. VLA observations
Multi-frequency VLA observations of WR 140 were made throughout the VLBA observations to provide continuum spectral information. Observations were made in standard continuum mode, using two 50-MHz channels centered on 1465 (20cm), 4885 (6cm), 8435 (3.6cm), 14965 (2cm), and 22485 MHz (1.3cm). Antenna phases were established via phase-referencing using J2007+404, and the absolute flux level from observation of the bright source 3C286. Data was calibrated and reduced in the standard manner using the aips package. Since WR 140 is unresolved in these observations, fluxes were determined using jmfit assuming a point source. The results of the VLA observations are given in Table 2 and displayed in Fig. 4. The quoted uncertainties are the background rms of the images. We note that the absolute flux scale has an uncertainty of %.


The VLBA fluxes at 8.4 GHz are closely 50% of the VLA 8.4-GHz fluxes. Assuming the thermal flux at 8.4 GHz is that at phase 0.974 (2.64 mJy), we estimate the VLBA is resolving out % of the synchrotron flux. This missing flux is most likely emission arising further from the shock apex than the emission detected by the VLBA. At 1.7 GHz, the VLBA fluxes have large scatter, most certainly due to calibration problems. As a result, the relationship to the VLA observations is unclear. It appears that 40-50% of the emission is undetected at phases around 0.8, though there could be evolution of this fraction with orbital phase. At phase 0.75 and near phase 0.95, there may be little or no flux resolved out, suggesting that at these phases the source may be smaller than between these phases.
In Fig. 5, the new data are directly compared with those measured by others from the orbit immediately prior to the one presented here. The new data shows less scatter than the earlier observations, which we attribute to improved system performance and better antenna phase calibration. It is clear from these figures that the radio emission from WR 140 very closely repeats from one orbit to the other. The radio light curves at each of the frequencies are very similar, with the peak and the decline to minimum also being very similar. There may be an offset between the 1.5 GHz data from phase 0.88 to 0.92. However, we caution against over interpreting this apparent difference. The scatter in the previous 1.5 GHz fluxes between orbital phase 0.75 and 0.82 leads us to think that the apparent offset may not be significant. The close similarity between the fluxes during successive orbits at all three frequencies leads us to conclude that whatever process(es) govern the nature of the radio emission from WR 140, they repeat from one orbit to another, suggesting that they are controlled primarily by orbital motion.
2.3. MERLIN observations
In conjunction with the VLBA observations, observations using the Multi-Element Radio-Linked Interferometer Network (MERLIN) in the UK were obtained in December 1999 and February 2000 at 1.66 GHz. The observations were approximately 10 hours duration, with a total bandwidth of 16 MHz in each of two polarizations. In addition, observations at 5 GHz on June 1992 and 1.67 GHz on August 1993 were extracted from the MERLIN archive. All of these observations were phase referenced using J2007+404, and reduced in the standard manner with the aips program. The absolute flux scale was determined through observations of 3C286 and bootstrapped to the bright point-sources OQ208 and 0552+298. WR 140 is not resolved in the MERLIN observations at either 1.6 or 5 GHz. The salient results of these observations are summarised in Table 3 where the quoted fluxes are determined assuming a point source, and taking the rms background level of the images to be the flux uncertainty. As in the VLA observations, the absolute flux scale has an uncertainty of %.
| Obs. Date | PhaseaaBased on orbit parameters from Marchenko et al. (2003) | 1.67 GHz | 5 GHz |
|---|---|---|---|
| (mJy) | (mJy) | ||
| 1992/06/28 | 0.906 | ||
| 1993/08/06 | 0.055 | ||
| 1999/12/29 | 0.861 | ||
| 2000/02/02 | 0.873 | ||
| 2000/02/05 | 0.874 |
Comparison of the MERLIN fluxes and the VLA observations show very similar flux levels, as expected for a source that is unresolved by both of these interferometer arrays. Since WR 140 is unresolved by MERLIN, we estimate the extent of the emission region is less than 13 mas at 5 GHz.
3. The orbit and distance of WR140

3.1. Orbital parameters of WR 140
Many of the orbital parameters in WR 140, in particular the orbital period (), epoch of periastron passage (), eccentricity () and the argument of periastron () are well-determined from radial velocity measurements (see Marchenko et al., 2003, and references therein). However, the orbital inclination (), semi-major axis () and the longitude of the ascending node () require that the system is resolved into a “visual” binary. Recently, the two stellar components in WR 140 have been resolved using the Infrared-Optical Telescope Array (IOTA) interferometer at a single epoch (Monnier et al., 2004). This single observation allows for the first time the determination of families of solutions for . However, until further IOTA observations are available, the VLBA observations of the WCR offer the only means to determine the orbit direction and inclination, and hence and .
Monnier et al. (2004) observed WR 140 on June 17, 2003 to have a separation of mas at a position angle of degrees east of north. Assuming days, , and (Marchenko et al., 2003), this observation at orbital phase 0.297 gives families of solutions for () as shown in Fig. 6 for . We examine the full range of possible inclination angles since the direction of relative orbital motion dictates whether is greater or smaller than .
Low orbit inclinations angles (or equivalently ) can be easily ruled out since radial velocity variations are observed and low inclinations would require the stellar components to have untenably large masses. Ultra-violet line observations with IUE, thought to have been obtained close to conjunction estimate (Setia Gunawan et al., 2001). The same analysis with orbital elements from Marchenko et al. (2003) give higher estimates of , with larger uncertainty (P.M. Williams, priv. communication). Marchenko et al. (2003) estimated from their optical line study, and similar work by Varricatt et al. (2004) using the He i emission line in the near-IR gives an estimate of . Unfortunately, these estimates are difficult to constrain well, and all have large uncertainty.
The VLBA observations of the WCR permit us to constrain acceptable solutions for . Under the assumption that the free-free opacity along the line-of-sight to the WCR is sufficiently low as to not impact the apparent distribution of emission from the WCR, we expect the arc of WCR emission to wrap around the star with the lower wind momentum (the O star) and “point” toward the WR star. In this case, the rotation of the orientation of the WCR as the orbit progresses implies that the O star moves from SE to close to due E of the WR star over the period of the VLBA observations. If it is assumed the axis of symmetry of the WCR emission is coincident with the projection on the plane of the sky of the line-of-centres of the two stars in the binary, then we can derive the orbital inclination from the change in the orientation of the WCR with orbital phase. Each () family provides a unique set of position angles for the projected line-of-centres as a function of orbital phase. Using a weighted minimum measure to fit the position angle of the line of symmetry of the WCR as a function of orbit phase for different sets of (), we find a best-fit solution of and (Fig. 7). These values lead to a value for the semi-major axis of mas, where the uncertainty is dominated by the uncertainty in the separation as observed by IOTA.

Using the semi-major amplitudes of the radial velocity curve, eccentricity and period from Marchenko et al. (2003), an orbit inclination of gives masses of M⊙ and M⊙ for the WC and O star respectively, within the anticipated mass ranges of a WC7 and an O4-5 star. We note that the uncertainty in the masses is dominated by that in the orbital inclination.
The derived orbit inclination is consistent with values previously suggested. However, this newly derived orbit presents a challenge to current models of dust formation. To date, most models of dust formation in WR 140 assume that the gas from which dust is formed in the WCR, is compressed within yr of periastron passage, when densities in the WCR are sufficiently high for dust formation to occur (Williams et al., 1990). The subsequent motion of the compressed gas is determined by the velocity of this material when it is compressed. Since the momentum of the WR star wind is higher than that of the O star, this material moves away from the WR star, along the WCR. With the orbit orientation derived here, the O star is NW of the WR star during periastron, and material compressed at periastron will therefore have a proper motion to the NW. However, this is not what is observed. High-resolution IR observations show that dust ejected during the 2001 periastron passage has proper motion from west to east, away from the WR star (Monnier et al., 2002). New dust models are now attempting to address this challenge .
If the WR star was to NW of the O star at periastron, as previously hypothesized from the dust proper motion, the WCR would then have to be wrapped around the WR star in the VLBA observations. This requires the unlikely scenario of the O-star wind momentum being greater than that of the WR star wind. We acknowledge that free-free opacity of the stellar winds can effect the observed shape of the WCR, but we anticipate the free-free opacity in WR 140 would only be sufficiently large to have a major impact on the apparent distribution of the 8.4-GHz emission close to periastron (see Dougherty et al., 2003a, Fig.11 for an example). However, until full hydrodynamical simulations of WR 140 are available, the full impact of free-free opacity on the appearance of the WCR remains unclear. High resolution near-IR observations at several bands should be able to distinguish the identity of the two stars since we anticipate the WR star is significantly brighter at longer IR wavelengths than the O star.
| Parameter | Primary | Secondary | System |
|---|---|---|---|
| Distance (kpc) | 1.85 | ||
| Mv | -6.4 | -5.6 | -6.8 |
| Spectral type | O4-5 I aaBased on Mv and the calibration of Vacca et al. (1996) | WC7 | |
| BC | -4.3 aaBased on Mv and the calibration of Vacca et al. (1996) | -3.4 bb1 errors measured in outlying image regions. | |
| Mbol | -10.7 | -9.0 | |
| log (Lbol/L⊙) | 6.18 ccCalculated assuming M (Allen, 1976) | 5.5 ccCalculated assuming M (Allen, 1976) | |
| Mass (M⊙) | |||
| v∞ (km s) | 3100 ddSetia Gunawan et al. (2001) | 2860 eeEenens & Williams (1994) | |
| ( yr-1 |
3.2. Distance of WR 140
Distance estimates of WR stars are typically based on absolute magnitude calibrations that often have large scatter (see van der Hucht, 2001). Having determined the orbital inclination and semi-major axis it is now possible to make an estimate of the distance to WR 140 independent of any stellar parameters. Marchenko et al. (2003) determined AU from radial velocity observations, which leads to AU for . We have derived the semi-major axis to be mas, and together these give a distance of kpc.
3.3. Basic system parameters of WR 140
This distance is somewhat larger than the usually quoted value of 1.3 kpc deduced by Williams et al. (1990) from the luminosity of the system. Since the primary O-star luminosity indicator is masked by the WC7 spectrum, Williams et al. (1990) assumed a main sequence O4-5 star with an absolute magnitude of and took that of the WC7 star to be . However, they remarked the distance estimate would increase if the O star was more luminous than main sequence. With the system at kpc, the absolute magnitudes of the O4-5 star and the WC7 star become and respectively. An absolute magnitude of for the WC7 star is bright compared to the mean values (between and ) deduced from previous estimates for WC7 stars (see van der Hucht, 2001, Table 27) but the dispersion is large (), and certainly the value presented here is not extreme. The brightness of the O4-5 star suggests that it is a supergiant (see Vacca et al., 1996, Table 7).
With the increase in distance, a reassessment of the mass-loss rates of the two stars is appropriate. To circumvent any uncertainties presented by clumping corrections that are required when using radio flux determinations of mass loss, we turn to X-ray observations in order to try and determine the mass-loss rate of the WR star. The X-ray luminosity in WR 140 is dominated by emission from the shocked WR wind material (Pittard & Stevens, 2002), where any clumps are assumed to have been destroyed by the shock. From Zhekov & Skinner (2000), the X-ray luminosity measured by ASCA gives a mass-loss rate for the WR star at 1.85 kpc of yr-1. This can be readily reconciled with the unclumped estimate of yr-1 from Williams et al. (1990) with a reasonable filling factor. Since mass-loss rates derived from thermal free-free emission , the unclumped value of Williams et al. (1990) for WR 140 at 1.85 kpc becomes yr-1. Comparison with the clumping-free, X-ray derived value implies a filling factor . For the O star, Repolust et al. (2004) suggests values of yr-1 for O4-5 supergiants.
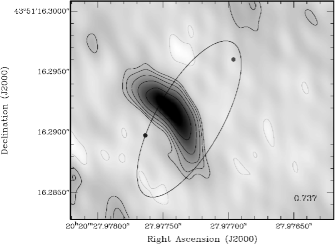
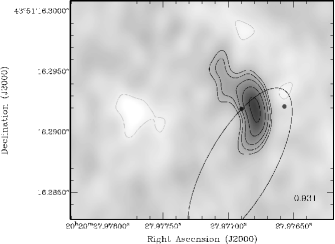
These mass-loss rates imply a wind momentum ratio , allowing us to position the stars relative to the WCR in the VLBA images (see Fig. 8). This wind-momentum ratio is considerably higher than the 0.035 deduced by Williams et al. (1990), assuming a main sequence O star, and a mass-loss rate for the WR star that was uncorrected for clumping. Following Eichler & Usov (1993), implies a half-opening angle for the WCR of . Using the VLBA images in Fig. 2 we can estimate the half-opening angle from
where is the angle between the line-of-sight and the line-of-centres between the two stars, and is the observed full opening angle of the WCR. Using the orbit derived in §3.1 to derive at the observed orbital phases (Fig. 9), and the values of given in Table 1 we find , consistent with the estimate derived from the wind-momentum ratio. Adding further support to this value, Varricatt et al. (2004) would derive a similar opening angle from interpretation of He I line observations using the orbital inclination derived here.

With the orbit size and wind-momentum ratio we can compare the observed size of the emission region with , the size of the emission region derived in the Eichler & Usov (1993) CWB model. For a stellar separation of 26.45 AU at phase 0.737, and , AU. The size of the emission region () and its projection on the sky () is simply related by , where is defined above. At phase 0.737, the size observed by the VLBA is 6 mas, which at 1.85 kpc corresponds to 11.1 AU. Since at this phase, AU, considerably smaller than expected. To attain the predicted size would require the observed size to be 10.5 mas. As discussed earlier, the VLBA does resolve out % of the flux from the WCR in WR 140, so the observed size is expected to be smaller than that predicted. However, the MERLIN observation imposes an upper limit of 13 mas, consistent with the predicted size.
4. Astrometry of the WCR


4.1. Positions and proper motion of the WCR
The use of phase-referencing permits accurate astrometry of the radio emission of WR 140. The VLBA positions for the WCR are given in Table 1. The offsets of the WCR in the 8.4 GHz observations from the position at the first observation epoch as a function of time are shown in Fig. 10. A largely westward proper motion in the WCR is evident in the 8.4-GHz data. A linear regression fit to the 8.4-GHz positions gives a proper motion of mas yr-1 and mas yr-1. In an attempt to assess if the ionosphere has any clear impact on the 8.4-GHz astrometry, observations between 1800 and 0600 MST (Socorro) are identified. The east-west positions derived from night observations appear to be eastward of the daytime positions. Similarly, the north-south positions measured during the night are typically northward of day time positions. We have no clear explanation for this apparent offset in day versus night observations. However, repeating the regression fits using only observations obtained during the night gives a proper motion mas yr-1 and mas yr-1. The east-west proper motion is closely the same as that derived from all data points, though the derived north-south motion is larger, albeit with a large uncertainty.
Hipparcos observed a proper motion in WR 140 of mas yr-1 and mas yr-1 between JD 2447870 and 2449046 (Perryman & ESA, 1997). This date range spans orbital phase 0.26 to 0.67. Using the proper motion deduced for the WCR together with the orbit defined here and , the deduced proper motions of the O and WR stars are and mas yr-1 and and mas yr-1 respectively. The deduced east-west motion of both the WR and O stars are consistent with the Hipparcos proper motion. However, it would appear the deduced north-south motion of the WR is closer than that of the O star to the Hipparcos observation. This is at odds with the expectation that the Hipparcos observations reflect the proper motion of the O star, since the O star is expected to be the dominant emitter at visible wavelengths (closely Johnson B and V) where the Hipparcos observations were made. However, given the large uncertainty in the Hipparcos north-south proper motion, arguably both deduced values are consistent with the Hipparcos observation within the measurement uncertainties.

4.2. Offset between 8.4 and 1.7-GHz emission?
In spite of the large scatter in the 1.7-GHz positions, the 1.7-GHz emission appears to be westward of that at 8.4 GHz. In Fig. 11 the 1.7 and 8.4-GHz proper motion in the east-west direction is shown. From the figure, the offset in right ascension at the two bands is readily apparent. We also note that the largest excursions of the 1.7-GHz positions occur during daytime observations, lending credibility to our suggestion that ionospheric effects dominate the uncertainty in the astrometry. Taking as derived from all the 8.4-GHz positions, an offset of mas is derived between the 1.7 and 8.4-GHz right ascension values. If we only use nighttime data at both bands along with , the position offset between the two bands is mas. We conclude that despite the poor astrometry at 1.7 GHz, a right ascension offset of 4–5 mas between the peak of the 1.7 and 8.4-GHz emission is observed.
5. The radio spectra of WR 140

The new VLA data at five frequencies allow us to observe the radio spectrum and its evolution better than previously possible, most particularly at the higher frequencies. The radio spectra at a number of orbital phases are shown in Fig. 12 and exhibit considerable evolution as the orbit progresses. At phase 0.67, the spectrum shows a turnover at 8.4 GHz from a positive spectral index111Flux , where is the spectral index at low frequencies to a negative index at higher frequencies. This is consistent with the data shown in Fig. 1, where a turnover between 15 and 5 GHz is apparent around phase 0.65. Prior to this phase, the turnover frequency is above 15 GHz. As the orbital phase progresses after phase 0.67, the turnover frequency moves to lower frequency, eventually to below 1.5 GHz by phase 0.83, when the spectrum has a negative spectral index across the observed frequencies. The flux decreases at all frequencies beyond this phase and the negative index remains until phase 0.907, where the low frequency spectrum evolves rapidly. By phase 0.930, the spectrum is flat, and by 0.955 the turnover is greater than 22 GHz, and the spectrum exhibits a positive index.
At phase 0.974, the spectrum is a power-law with a best-fit spectral index of , a value characteristic of the stellar winds in WR+OB binary systems (Williams, 1996). Comparison with the observations from the previous orbit show that the radio flux at 5 GHz is at its minimum value at this phase. The brightness temperature at this phase is less than K (undetected by the VLBA), implying thermal emission and we will assume the emission at this phase represents the thermal emission from the stellar winds alone. Certainly, the fluxes at phase 0.974 are consistent with the thermal emission expected from the stellar winds of a WR+O binary with T K, mass-loss rates and terminal velocities as given in Table 4, with a filling factor , similar to that derived earlier. Assuming the thermal emission from WR 140 is essentially constant throughout the orbit, the synchrotron spectra at each observed phase can be determined by simply subtracting the thermal flux at phase 0.974 from the total flux. No 15-GHz observation was made at phase 0.974 so a value of 3.8 mJy is used, derived from the data of White & Becker (1995) and consistent with the phase 0.974 spectrum shown in Fig. 12. The resulting synchrotron spectra are shown in Fig. 13.

The synchrotron spectra between phases 0.67 and 0.92 is optically thin at several frequencies, with a spectral index that appears to be closely constant with , very similar to that expected for first-order Fermi acceleration of electrons in strong, non-relativistic shocks (e.g. see Drury, 1983; Jones & Ellison, 1991, and references therein). The turnover frequency between the optically thin and thick parts of the spectra appears to be related to orbital phase. Between phase 0.67 and 0.85 the turnover is between 1.5 and 22 GHz, moving to lower frequencies as the orbit progresses. Prior to 0.64, the turnover frequency is greater than 15 GHz (see Fig. 1) and after phase 0.85 it is less than 1.4 GHz. After phase 0.91, the spectra start to flatten as the luminosity decreases. By phase 0.96 the turnover frequency is at 8.4 GHz.
The optically thick part of the synchrotron spectrum has been widely attributed to free-free absorption in the stellar winds along the line-of-sight to the WCR. Williams et al. (1990) found that if the stellar wind envelope is assumed to be radially symmetric, the free-free opacity to the apex of the WCR (i.e. near the stagnation point of the two colliding winds) only exhibits large values and variations close to periastron, when lines-of-sight to the apex of the WCR have to traverse the inner regions of the WR star wind. Their modelling of two-frequency data led them to suggest a more complex geometry with the O-star envelope providing a lower density region extending away from the WR star, very similar to the now generally accepted geometry for the stellar wind envelopes in CWBs (c.f. Eichler & Usov, 1993; Dougherty et al., 2003a). White & Becker (1995) proposed an ad-hoc model to explain the radio peak near phase 0.7 using free-free opacity variations alone, where the WR wind is equatorially enhanced and masks the O-star and the WCR for the bulk of the orbit. In this model, the rise to the radio peak at phase 0.7 indicates lower free-free opacity as the O-star passes through the disk toward the observer.
Unfortunately, these models are too simple to explain the radio observations of WR 140, as readily acknowledged by their authors. The VLBA observations show the WCR as a distributed emission region and the lines-of-sight to the WCR traverse different regions of the stellar winds of the two stars. As a result, the emerging emission will be a combination of both optically thick and thin emission, since even though lines-of-sight to the apex may be optically thick, a substantial amount of emission arises from optically thin lines-of-sight to the downstream flow. Using the newly derived orbit and assuming a half-opening angle for the WCR of , we now know the lines-of-sight to the WCR traverse the O-star wind between orbit phases 0.24 and 0.99 (Fig. 9) during which the most dramatic changes in the radio emission are observed. Clearly, if stellar wind free-free opacity is important it is the O-star wind opacity that is of most concern, not that of the WR star.
Another shortcoming of previous models is the assumption the synchrotron emission is optically thin at all observing frequencies, and at all orbital phases. Though the high frequency data presented here suggests an optically thin component at some orbital phases and frequencies, it is necessary to account for the optically thick component of the spectra observed during the bulk of the orbit. This may, at least in part, to be due to mechanisms intrinsic to the WCR. Certainly the models of both Williams et al. (1990) and White & Becker (1995) suggest a synchrotron source that is varying dramatically throughout the orbit, variations that are modulated by the orbital motion.
Before exploring the potential impact of a few mechanisms, it is worthwhile estimating the equipartition magnetic field () at the apex of the WCR. The synchrotron luminosity () at phase 0.85 based on the spectrum in Fig. 13 is erg s-1, and for a source size () of 7 mas at 1.85 kpc, mG at the apex of the WCR. Since (Pacholczyk, 1970), our estimate is a lower limit since the luminosity is a lower limit (the luminosity will increase when observations at frequencies greater than 22 GHz are incorporated). By phase 0.93, the source size (3 mas) and luminosity ( erg s-1) give mG. Encouragingly, both these estimates are the same order of magnitude as those determined by Dougherty et al. (2003b). It is interesting to note that these magnetic field values are closely proportional to , as expected in a dipole field.
Inverse Compton (IC) cooling has been suggested as important in WR 140, with the close proximity of the O star to the WCR (Dougherty et al., 2003a). The IC cooling time at the apex of the WCR is given by
where is the distance from the O star to the WCR, the bolometric luminosity of the O star, and is the magnetic field. Using the parameters in Table 4, at phase 0.85 the IC cooling time is hours at 22 GHz. This is short compared to the adiabatic cooling time of hours. Even at apastron, IC cooling dominates ( hours) over adiabatic cooling ( hours). Since IC cooling compared to adiabatic cooling (), at some point in the downstream flow adiabatic cooling will dominate. Synchrotron cooling is not important in WR 140, with timescales of days. The signature of IC cooling is a spectrum that is reduced at all frequencies, but most severely at high frequencies, and is not characterised by a high-frequency knee . This process may be the underlying cause of the reduction in the luminosity as the orbit of WR 140 progresses beyond 0.82, given its domination over the other cooling mechanisms.
The presence of thermal ions in the post-shock flow can result in a departure of the refractive index of the plasma from unity, giving rise to the Razin effect (see e.g. Hornby & Williams, 1966, and references therein). The frequency at which such a departure from unity is significant is given by , where and are the number density of electrons and the magnetic field strength respectively. At phase 0.85 and for , the distance from the WR star to the WCR is 14.5 AU. A mass-loss rate of yr-1 implies a post-shock density in the WCR of cm-3. Taking to be mG, GHz, within our observing range.
For a field of 50 mG, a source of radius 3 mas and a flux of 15 mJy at 22 GHz in the optically thin part of the spectrum, synchrotron self-absorption will produce a turnover () near 0.3 GHz, outside the range of our observations. Since , which is very weakly dependent on the magnetic field, the source would have to be smaller for self-absorption to cause a turnover within the observed frequency range.
In highly eccentric systems such as WR 140, the relative importance of the various emission, absorption and plasma processes changes with stellar separation through variations in electron and ion density (), magnetic field strength (), and radiation field density (). Given these dependences, the asymmetry of the radio emission in WR 140 about periastron/apastron remains a puzzle - clearly it cannot be explained by any one of these processes alone. The evolution of the spectrum is most likely a result of the combined effects and relative changes in these mechanisms as the orbit progresses. The full impact of these effects on the observed emission from WR 140 awaits more sophisticated models than used in previous work.
New radiative transfer models, based on a fully consistent hydrodynamic treatment of the WCR, have started to explore the impact of a number of processes on the radio emission from CWBs, including free-free opacity in the stellar winds, synchrotron self-absorption, Coulombic cooling through interactions with post-shock ions, plasma effects such as the Razin effect, and Inverse Compton cooling by the intense ultra-violet radiation field of the nearby massive stars. These models have been very successful in explaining the radio emission from very wide CWBs such as WR 147 (Dougherty et al., 2003a), and are now maturing to the point where they will provide more insight to the mechanisms acting in systems like WR 140 . The observations presented here represent the key constraints for these new models.
References
- Allen (1976) Allen, C. W. 1976, Astrophysical Quantities (Astrophysical Quantities, London: Athlone (3rd edition), 1976)
- Beasley & Conway (1995) Beasley, A. J. & Conway, J. E. 1995, in ASP Conf. Ser. 82: Very Long Baseline Interferometry and the VLBA, 328–343
- Canto et al. (1996) Canto, J., Raga, A. C., & Wilkin, F. P. 1996, ApJ, 469, 729
- Cappa et al. (2004) Cappa, C., Goss, W. M., & van der Hucht, K. A. 2004, AJ, 127, 2885
- Chapman et al. (1999) Chapman, J. M., Leitherer, C., Koribalski, B. ., Bouter, R., & Storey, M. 1999, ApJ, 518, 890
- Chen & White (1994) Chen, W. & White, R. L. 1994, Ap&SS, 221, 259
- Dougherty (2002) Dougherty, S. M. 2002, in ASP Conf. Ser. 260: Interacting Winds from Massive Stars, 287–296
- Dougherty et al. (2003a) Dougherty, S. M., Pittard, J. M., Kasian, L., Coker, R. F., Williams, P. M., & Lloyd, H. M. 2003a, A&A, 409, 217
- Dougherty et al. (2003b) Dougherty, S. M., Pittard, J. M., Coker, R., Williams, P. M., Kasian, L., & Lloyd, H. M. 2003b, in Revista Mexicana de Astronomia y Astrofisica Conference Series, 56–58
- Dougherty & Williams (2000) Dougherty, S. M. & Williams, P. M. 2000, MNRAS, 319, 1005
- Dougherty et al. (2000) Dougherty, S. M., Williams, P. M., & Pollacco, D. L. 2000, MNRAS, 316, 143
- Dougherty et al. (1996) Dougherty, S. M., Williams, P. M., van der Hucht, K. A., Bode, M. F., & Davis, R. J. 1996, MNRAS, 280, 963
- Drury (1983) Drury, L. O. 1983, Reports of Progress in Physics, 46, 973
- Eenens & Williams (1994) Eenens, P. R. J. & Williams, P. M. 1994, MNRAS, 269, 1082
- Eichler & Usov (1993) Eichler, D. & Usov, V. 1993, ApJ, 402, 271
- Hornby & Williams (1966) Hornby, J. M. & Williams, P. F. S. 1966, MNRAS, 131, 237
- Jones & Ellison (1991) Jones, F. C. & Ellison, D. C. 1991, Space Science Reviews, 58, 259
- Leitherer et al. (1995) Leitherer, C., Chapman, J. M., & Koribalski, B. 1995, ApJ, 450, 289
- Leitherer et al. (1997) —. 1997, ApJ, 481, 898
- Marchenko et al. (2003) Marchenko, S. V., Moffat, A. F. J., Ballereau, D., Chauville, J., Zorec, J., Hill, G. M., Annuk, K., Corral, L. J., Demers, H., Eenens, P. R. J., Panov, K. P., Seggewiss, W., Thomson, J. R., & Villar-Sbaffi, A. 2003, ApJ, 596, 1295
- Monnier et al. (2004) Monnier, J. D., Traub, W. A., Schloerb, F. P., Millan-Gabet, R., Berger, J.-P., Pedretti, E., Carleton, N. P., Kraus, S., Lacasse, M. G., Brewer, M., Ragland, S., Ahearn, A., Coldwell, C., Haguenauer, P., Kern, P., Labeye, P., Lagny, L., Malbet, F., Malin, D., Maymounkov, P., Morel, S., Papaliolios, C., Perraut, K., Pearlman, M., Porro, I. L., Schanen, I., Souccar, K., Torres, G., & Wallace, G. 2004, ApJ, 602, L57
- Monnier et al. (2002) Monnier, J. D., Tuthill, P. G., & Danchi, W. C. 2002, ApJ, 567, L137
- Napier (1995) Napier, P. J. 1995, in ASP Conf. Ser. 82: Very Long Baseline Interferometry and the VLBA, 59–72
- Niemela et al. (1998) Niemela, V. S., Shara, M. M., Wallace, D. J., Zurek, D. R., & Moffat, A. F. J. 1998, AJ, 115, 2047
- Pacholczyk (1970) Pacholczyk, A. G. 1970, Radio astrophysics. Nonthermal processes in galactic and extragalactic sources (Series of Books in Astronomy and Astrophysics, San Francisco: Freeman, 1970)
- Perryman & ESA (1997) Perryman, M. A. C. & ESA. 1997, The HIPPARCOS and TYCHO catalogues. Astrometric and photometric star catalogues derived from the ESA HIPPARCOS Space Astrometry Mission (The Hipparcos and Tycho catalogues. Astrometric and photometric star catalogues derived from the ESA Hipparcos Space Astrometry Mission, Publisher: Noordwijk, Netherlands: ESA Publications Division, 1997, Series: ESA SP Series vol no: 1200, ISBN: 9290923997 (set))
- Pittard & Stevens (2002) Pittard, J. M. & Stevens, I. R. 2002, A&A, 388, L20
- Pollock et al. (2004) Pollock, A. M. T., Corcoran, M. F., Stevens, I. S., & Williams, P. M. 2005, ApJ, submitted
- Repolust et al. (2004) Repolust, T., Puls, J., & Herrero, A. 2004, A&A, 415, 349
- Setia Gunawan et al. (2001) Setia Gunawan, D. Y. A., van der Hucht, K. A., Williams, P. M., Henrichs, H. F., Kaper, L., Stickland, D. J., & Wamsteker, W. 2001, A&A, 376, 460
- Vacca et al. (1996) Vacca, W. D., Garmany, C. D., & Shull, J. M. 1996, ApJ, 460, 914
- van der Hucht (2001) van der Hucht, K. A. 2001, VizieR Online Data Catalog, 3215, 0
- Varricatt et al. (2004) Varricatt, W. P., Williams, P. M., & Ashok, N. M. 2004, MNRAS, 351, 1307
- Watson et al. (2002) Watson, S. K., Davis, R. J., Williams, P. M., & Bode, M. F. 2002, MNRAS, 334, 631
- White & Becker (1995) White, R. L. & Becker, R. H. 1995, ApJ, 451, 352
- Williams (1996) Williams, P. M. 1996, in ASP Conf. Ser. 93: Radio Emission from the Stars and the Sun, 15–22
- Williams (2002) Williams, P. M. 2002, in ASP Conf. Ser. 260: Interacting Winds from Massive Stars, 311–318
- Williams et al. (1997) Williams, P. M., Dougherty, S. M., Davis, R. J., van der Hucht, K. A., Bode, M. F., & Setia Gunawan, D. Y. A. 1997, MNRAS, 289, 10
- Williams et al. (1990) Williams, P. M., van der Hucht, K. A., Pollock, A. M. T., Florkowski, D. R., van der Woerd, H., & Wamsteker, W. M. 1990, MNRAS, 243, 662
- Williams et al. (1994) Williams, P. M., van der Hucht, K. A., & Spoelstra, T. A. T. 1994, A&A, 291, 805
- Zhekov & Skinner (2000) Zhekov, S. A. & Skinner, S. L. 2000, ApJ, 538, 808