Surface abundances of light elements for a large sample of early B-type stars - IV. The magnesium abundance in 52 stars - a test of metallicity
Abstract
From high-resolution spectra a non-LTE analysis of the Mg ii 4481.2 Å feature is implemented for 52 early and medium local B stars on the main sequence (MS). The influence of the neighbouring line Al iii 4479.9 Å is considered. The magnesium abundance is determined; it is found that on average. It is shown that uncertainties in the microturbulent parameter are the main source of errors in . When using 36 stars with the most reliable values derived from O ii and N ii lines, we obtain the mean abundance . The latter value is precisely confirmed for several hot B stars from an analysis of the Mg ii 7877 Å weak line. The derived abundance is in excellent agreement with the solar magnesium abundance , as well as with the proto-Sun abundance . Thus, it is confirmed that the Sun and the B-type MS stars in our neighbourhood have the same metallicity.
keywords:
stars: atmospheres – stars: early-type – stars: magnesium abundance.1 INTRODUCTION
In the 1990s a number of works were published, in which the carbon, nitrogen and oxygen abundances were derived for local early B-type stars on the main sequence (MS) (Kilian 1992; Gies & Lambert 1992; Cunha & Lambert 1994; Daflon et al. 1999). It was shown that these B stars were deficient in C, N and O typically by 0.2–0.4 dex with respect to the published abundances for the Sun.
One might ask whether this deficiency reflects a real difference in the metal abundances between the B-type MS stars and the Sun. (It should be remembered that it is accepted in astrophysics to denote by metals all chemical elements heavier than hydrogen and helium). If so, then, following Nissen (1993), it should be recognized that the metallicity of the B stars is lower by about a factor of two than the metallicity of the Sun, i.e., the metal mean mass fraction must be Z = 0.01 for them instead of the usually accepted solar value Z = 0.02. An assumption arose that the Sun formed out of material enriched by metals (see, e.g., Daflon et al. 1999). Moreover, a hypothesis appeared that other F–G main sequence stars with planet systems are also more metal rich than similar stars without planets (Gonzalez 1997, 2003).
There was a different viewpoint, namely that the initial C, N and O abundances in the Sun and in the nearby B stars were really the same, but the observed deficiency in the B stars results from either the effect of gravitational-radiative separation of elements in the stellar atmosphere or systematic errors in the abundance analysis of the B stars.
A partial solution of the problem came unexpectedly from the recent C, N and O abundance determinations for the Sun on the basis of a three-dimensional time-dependent hydrodynamical model solar atmosphere (Allende Prieto et al. 2001, 2002; Asplund 2002; Asplund et al. 2004). It was shown that in this more realistic 3D case the solar C, N and O abundances decrease markedly as compared with the standard 1D case (see, e.g., Holweger 2001). So, the discrepancy between the B stars and the Sun decreases, too.
Carbon, nitrogen and oxygen participate in the H-burning CNO-cycle that is a main source of energy of B-type MS stars. Their abundances in stellar interiors change significantly during the MS phase. There are empirical data on mixing between the interiors and surface layers of early B stars (see, e.g., Lyubimkov 1996, 1998; Maeder & Meynet 2000). Mixing will reduce the surface C abundance and increase the surface N abundance as material from layers exposed to the N-cycle is brought to the surface. Mixing to deeper depths will bring products of the ON-cycles to the surface resulting in a reduction of the surface O abundance and further increase of the N abundance.
In fact, our analysis of the helium abundance in early B stars led to the conclusion that the observed He enrichment during the MS phase can be explained by rotation with velocities km s-1 (Lyubimkov et al. 2004). When adopting, for instance, km s-1, one may find from Heger & Langer’s (2000) computations that for a 15 Mo star the surface C, N and O abundances change by -1.2, +0.9 and -0.4 dex, respectively. Therefore, use of C, N and O as indicators of metallicity of early B stars is not strictly correct.
In the case of cool stars, iron is usually used as an indicator of metallicity. On the one hand, this element does not participate in thermonuclear reactions during early evolutionary phases, and, therefore, its abundance corresponds to the initial metallicity of a star. On the other hand, it gives a lot of spectral lines, which allow its abundance to be derived with high accuracy. The metallicity [] is determined then as the difference between the Fe abundances of the star and the Sun, i.e.
| (1) |
where the abundance corresponds to the standard logarithmic scale with the hydrogen abundance . Unfortunately, in spectra of early B stars the iron lines are weak.
One of the strongest lines in spectra of early and medium B stars is the Mg ii 4481.2 Å line. Magnesium is quite suitable as an indicator of metallicity, because it does not change its abundance during the MS evolutionary phase. Even its participation in the MgAl-cycle leads to a negligible decrease of the abundance, by about 0.02–0.03 dex (Daflon et al. 2003). Moreover, for magnesium, unlike C, N and O, the precise solar abundance is known. In fact, according to Holweger (2001), its abundance derived from photospheric lines is . This spectroscopic value is very close to the meteoritic abundance . Averaging these two abundances, Lodders (2003) recommends the value as the solar magnesium abundance (’meteoritic’ refers to the CI-type chondrites). We shall use the latter value. The metallicity of stars will be determined from formula
| (2) |
It should be noted that Lodders presents also the proto-Sun magnesium abundance . This value differs slightly from the above-mentioned photospheric value because heavy-element fractionation in the Sun has altered original abundances.
At present we continue our study of large sample of early and medium B stars. Our general goal was to provide new comprehensive observations of the stars and to determine and analyse the abundances of CNO-cycle elements, namely helium, carbon, nitrogen and oxygen. A series of papers is being published. First, we obtained high-resolution spectra of more than 100 stars at two observatories, namely the McDonald Observatory of the University of Texas and the Crimean Astrophysical Observatory (Ukraine); equivalent widths of 2 hydrogen lines and 11 helium lines were measured (Lyubimkov et al. 2000, hereinafter Paper I). Second, we determined a number of fundamental parameters of the stars including the effective temperature , surface gravity , interstellar extinction , distance , mass , radius , luminosity , age , and relative age , where is the MS lifetime (Lyubimkov et al. 2002, Paper II). Third, from non-LTE analysis of He i lines we derived the helium abundance , microturbulent parameter and projected rotational velocity sin (Lyubimkov et al. 2004, Paper III). Presently, we are analysing C ii, N ii and O ii lines; in particular, the microturbulent parameter is determined from these lines, too.
We present in this paper a new determination of the Mg abundances in B stars that is based on our spectra and our atmospheric parameters. We use the Mg ii 4481.2 Å line and for a sample of hot stars a weaker Mg ii line at 7877 Å.
2 SELECTION OF STARS
2.1 Influence of the Al III 4479.9 Å line
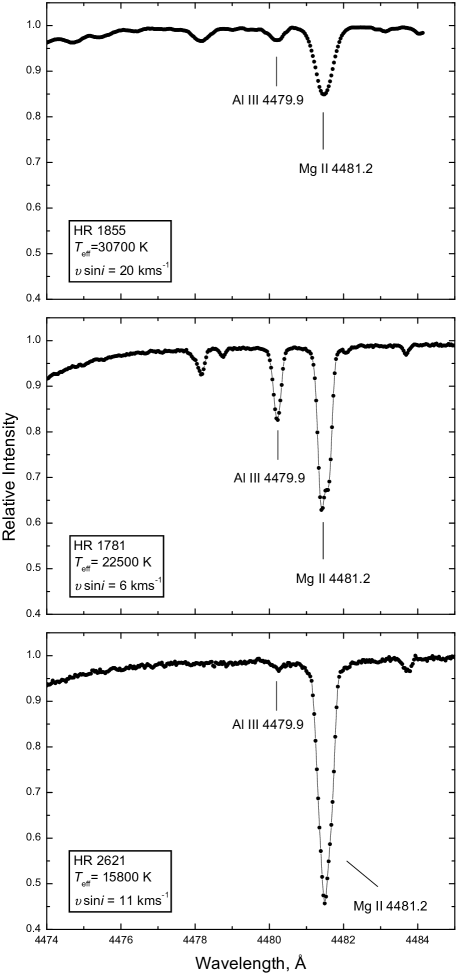
An analysis of the Mg ii 4481.2 Å line can be complicated by presence of the neighbouring Al iii 4479.9 Å line. If a star has a rather high rotational velocity sin , the two lines form a common blend. In such cases the computation of synthetic spectra is necessary. The Al iii 4479.9 Å line intensity depends strongly on . In Fig.1 we show as examples the observed spectra in the Mg ii 4481.2 Å vicinity for three B stars with the different effective temperatures and low rotational velocities sin (i.e. with sharp spectral lines). One sees that the Al iii 4479.9 Å line is relatively strong at = 22500 K, but weak both at the high temperature, = 30700 K, and at the low one, = 15800 K.
In order to study the dependence on in more detail, we measured the equivalent width of this line for 28 B stars from our list, which have the little rotational velocities (5 km s-1 sin 33 km s-1) and the effective temperatures 15800 K. In Fig.2a we present the value as a function of . To guide the eye, we approximated the relation by the fourth-order polynomial (solid curve in Fig.2a). One sees that there is a maximum of the values in the range between 21000 and 24000 K.

In Fig.2b we show the dependence on for the ratio of equivalent widths of the Al iii 4479.9 Å and Mg ii 4481.2 Å lines. One sees that in the range from 19000 to 27000 K this ratio is equal to about 20–30 per cent; so, if the lines form a common blend, a contribution of the Al line must be taken into account. We believe that the influence of the Al line can be ignored only for B stars with temperatures 17000 K.
Two stars, namely HR 1923 and HR 2633, are ’outliers’ in Fig.2a (they are marked in Fig.2a). We may not explain this discrepancy by errors in the (Al iii 4479.9) measurements, because the profiles of the Al line for these stars are sharp and symmetric and, therefore, measured with confidence. The explanation cannot be connected with errors in too, because they are small, and K respectively. The star HR 2633 is the only B giant in Fig.2, it has = 3.38, whereas for all other stars 3.8, i.e., they are dwarfs. If the Al iii 4479.9 Å line is stronger for B giants than for B dwarfs with the same temperatures , then the elevated (Al iii 4479.9) value for HR 2633 becomes understandable. As far as HR 1933 is concerned, it is possible that this star has a somewhat lowered Al abundance. It is interesting that in Fig.2b, unlike Fig.2a, neither of these stars is an ‘outlier’.
2.2 Selection of stars
Although the empirical relations in Fig.2 would in principle allow one to correct for the Al iii contribution to the Al iii - Mg ii blend in the spectrum of a rapidly-rotating star, we chose in the interest of controlling the uncertainties affecting the the Mg abundance to restrict the selection of stars to those where the Al iii and Mg ii lines are clearly resolved.
In Paper III, we determined accurate rotational velocities sin for 100 normal B stars. It was shown that the sin values of the stars span the range from 5 to 280 km s-1. In order to separate clearly the Mg ii and Al iii lines in question, we should exclude the stars with high sin . We see from our spectra that for the stars with sin 100 km s-1 the Mg ii line is substantially blended by the Al iii line, especially in the above-mentioned range between 19000 and 27000 K. So, we reject stars with such large sin . Eventually, we singled out the stars with sin 54 km s-1 when 17000 K; one relatively cool star ( = 16600 K) with sin = 70 km s-1 was added. It is important to note that in spectra of all these stars the Al iii 4479.9 Å line is distinctly separated from the Mg ii 4481.2 Å line, so equivalent widths of the latter are measured with confidence.
A list of selected 52 stars is presented in Table 1. We give here for each star its HR number, as well as the effective temperature and surface gravity from Paper II. Next the microturbulent parameter is given, which was inferred by us for the most of the stars from N ii and O ii lines. However, for 16 cool stars these lines are too weak and, therefore, unfit for the determination by the standard method, when an agreement in abundances derived from relatively strong and weak lines should take place. We present for these stars the values obtained in Paper III from He i lines (marked by asterisks in Table 1). The projected rotational velocities sin from Paper III are given next in Table 1. We remark below on the equivalent widths (4481) and magnesium abundances presented in two last columns.
| HR | sin | (4481) | ||||
|---|---|---|---|---|---|---|
| K | km s-1 | km s-1 | mÅ | |||
| 38 | 18400 | 3.82 | 2.7 | 11 | 194 | 7.51 |
| 561 | 13400 | 3.75 | 0.0∗ | 24 | 307 | 8.06 |
| 1072 | 22300 | 3.81 | 6.5 | 39 | 184 | 7.57 |
| 1363 | 13700 | 3.67 | 1.8∗ | 36 | 304 | 7.99 |
| 1595 | 22500 | 4.17 | 1.0 | 6 | 157 | 7.69 |
| 1617 | 18300 | 3.96 | 0.5∗ | 46 | 233 | 8.02 |
| 1640 | 19400 | 4.11 | 0.0 | 54 | 201 | 7.82 |
| 1731 | 17900 | 3.98 | 2.2 | 41 | 214 | 7.67 |
| 1753 | 15500 | 4.10 | 0.0∗ | 27 | 274 | 7.97 |
| 1756 | 27900 | 4.22 | 5.1 | 33 | 135 | 7.67 |
| 1781 | 22500 | 4.08 | 1.5 | 5 | 150 | 7.60 |
| 1783 | 22300 | 4.00 | 1.4 | 14 | 152 | 7.64 |
| 1810 | 20000 | 4.01 | 0.0 | 24 | 191 | 7.83 |
| 1820 | 18600 | 4.08 | 1.0 | 14 | 205 | 7.77 |
| 1840 | 21300 | 4.26 | 1.2 | 11 | 171 | 7.67 |
| 1848 | 18900 | 4.23 | 0.0 | 25 | 196 | 7.70 |
| 1855 | 30700 | 4.42 | 5.0 | 20 | 93 | 7.41 |
| 1861 | 25300 | 4.11 | 1.7 | 10 | 128 | 7.58 |
| 1886 | 23300 | 4.11 | 1.5 | 13 | 134 | 7.49 |
| 1887 | 27500 | 4.13 | 4.8 | 30 | 130 | 7.64 |
| 1923 | 20900 | 3.84 | 1.2 | 17 | 146 | 7.44 |
| 1950 | 23100 | 4.13 | 1.8 | 34 | 147 | 7.60 |
| 2058 | 21000 | 4.20 | 1.0 | 21 | 179 | 7.75 |
| 2205 | 18800 | 3.74 | 2.0 | 9 | 184 | 7.54 |
| 2222 | 25200 | 4.22 | 0.0 | 17 | 116 | 7.51 |
| 2494 | 17500 | 4.09 | 1.6∗ | 34 | 175 | 7.32 |
| 2517 | 16600 | 3.31 | 9.5 | 70 | 304 | 7.43 |
| 2618 | 22900 | 3.39 | 12.0 | 47 | 227 | 7.68 |
| 2621 | 15800 | 4.11 | 0.0∗ | 11 | 258 | 7.89 |
| 2633 | 18000 | 3.38 | 7.0 | 18 | 229 | 7.37 |
| 2688 | 19200 | 3.86 | 0.8 | 17 | 139 | 7.24 |
| 2739 | 29900 | 4.10 | 10.0 | 47 | 118 | 7.48 |
| 2756 | 16200 | 3.96 | 0.0∗ | 26 | 248 | 7.92 |
| 2824 | 19400 | 3.89 | 1.2 | 42 | 188 | 7.70 |
| 2928 | 22800 | 3.90 | 4.4 | 26 | 136 | 7.31 |
| 3023 | 21200 | 4.02 | 1.3 | 42 | 175 | 7.73 |
| 6588 | 17000 | 3.77 | 1.3∗ | 45 | 205 | 7.62 |
| 6787 | 20000 | 3.54 | 4.2 | 44 | 174 | 7.39 |
| 6941 | 17700 | 3.82 | 2.0∗ | 18 | 208 | 7.64 |
| 6946 | 19100 | 3.76 | 0.6 | 45 | 206 | 7.90 |
| 7426 | 16100 | 3.62 | 0.0∗ | 29 | 230 | 7.89 |
| 7862 | 17100 | 4.00 | 2.0∗ | 34 | 223 | 7.66 |
| 7929 | 16700 | 3.64 | 1.0∗ | 4 | 227 | 7.88 |
| 7996 | 15600 | 3.65 | 0.1∗ | 35 | 251 | 8.01 |
| 8385 | 15000 | 3.50 | 1.2∗ | 19 | 238 | 7.80 |
| 8403 | 14100 | 3.70 | 0.0∗ | 17 | 282 | 8.03 |
| 8439 | 17400 | 3.31 | 5.1 | 19 | 255 | 7.62 |
| 8549 | 19700 | 3.95 | 2.6 | 8 | 165 | 7.40 |
| 8554 | 14000 | 4.03 | 0.0∗ | 18 | 300 | 7.96 |
| 8768 | 17500 | 3.81 | 0.0 | 8 | 200 | 7.70 |
| 8797 | 27200 | 3.98 | 10.7 | 47 | 161 | 7.65 |
| 9005 | 21900 | 4.03 | 2.9 | 15 | 177 | 7.68 |
∗ is derived from He i lines
It should be noted that the distances of programme stars, according to Paper II, are less than 800 pc, so the stars are really in the solar neighbourhood.
3 OBSERVATIONAL MATERIAL AND EQUIVALENT WIDTHS
High-resolution spectra of programme stars have been acquired in 1996–1998 at two observatories: the McDonald Observatory (McDO) of the University of Texas and the Crimean Astrophysical Observatory (CrAO). At the McDO the 2.7 m telescope and coudé echelle spectrometer (Tull et al. 1995) was used. A resolving power was = 60000 and the typical signal-to-noise ratio was between 100 and 300. At the CrAO we observed on the 2.6 m telescope with coudé spectrograph. In this case we had = 30000 and a signal-to-noise ratio between 50 and 200. A more detailed description of the observations and reductions of spectra can be found in Paper I.
The equivalent width of the Mg ii 4481.2 Å line was measured by direct integration. The measurements were effected independently by two of us (TMR and partially by DBP). A comparison of these two sets of measurements showed good agreement and an absence of a systematic difference. The averaged values were adopted. It should be noted that a similar approach has been used by us in Paper I in measurements of hydrogen and helium lines. The values of the Mg ii 4481.2 Å line are given in Table 1. According to our estimates, the error in the W determination is per cent on average.
In our list there are 12 common stars, which have been observed both at the McDO and at the CrAO. A comparison of the values for two observatories showed good agreement: the mean difference is per cent and the maximum discrepancy is per cent. Note that the very good agreement (a scatter within per cent) has been obtained as well in Paper I for He i lines.

It would be interesting to compare our values for the Mg ii 4481.2 Å line with other published data. Such a comparison with measurements of Kilian & Nissen (1989) for 10 common stars is shown in Fig.3. One sees that for all the stars excepting one a difference in lies within per cent. The only exception is the hot B star HR 2739, for which our equivalent width is greater by 15 per cent than Kilian & Nissen’s value. It should be noted in this connection that use of Kilian & Nissen’s equivalent width for this star, according to our calculations, leads to the magnesium abundance , whereas our value gives that is substantially closer to the solar abundance (Lodders 2003). On the whole, Fig.3 confirms the stated accuracy of our values.
4 NON-LTE COMPUTATIONS OF THE Mg II 4481 LINE
More than 30 years ago Mihalas (1972) first showed that a non-LTE approach is necessary in the Mg ii 4481.2 Å line analysis for early B stars and especially O stars. According to his calculations, the non-LTE equivalent widths of the line are greater than the LTE ones, and the discrepancy increases with increasing . Our computations confirm this conclusion; moreover, the increment seems to be greater for B giants than for B dwarfs. In particular, when = 3.5, a value corresponding approximately to giants, the difference in between the non-LTE and LTE cases is about 5–6 per cent at = 20000–25000 K, i.e. comparable with errors in the measured W values, whereas it exceeds 50 per cent at = 30000 K. Since our sample includes both dwarfs and giants, we apply the non-LTE approach to all stars.
The Mg ii 4481.2 Å line was treated in our computations as a triplet, and for its three components the same oscillator strengths were adopted as in Daflon et al.’s (2003) work. In the non-LTE calculations of the line we used the codes detail (Giddings 1981; Butler 1994) and surface (Butler 1984). The former code determines the atomic level populations by jointly solving the radiative transfer and statistical equilibrium equations. The latter one computes the emergent flux and, therefore, the line profile.
We employed Przybilla et al.’s (2001) magnesium model atom. It includes all Mg i atomic levels with principal quantum numbers n 9, all Mg ii levels with n 10 and the Mg iii ground state. This model atom is likely the most complete one for magnesium today. The computations were implemented on the basis of the LTE model atmospheres calculated in Paper III with the code atlas9 of Kurucz (1993).
In order to analyse the effect of the microturbulent parameter on the Mg ii 4481.2 Å line equivalent width, we made trial calculations of the line for some model atmospheres from Kurucz’s (1993) grid. We confirmed that the line strengthens and its sensivity to increases as the effective temperature decreases from 30000 to 14000 K. Therefore, the effect of errors in on the Mg abundance determination is largest for coolest B stars from our list.
5 THE MAGNESIUM ABUNDANCES
5.1 Errors in the derived abundances
The derived magnesium abundances are presented in Table 1. When averaging these values for all 52 stars, we obtained the mean abundance . The difference with the solar value of 7.55 is 0.12 dex, i.e., substantially less than the uncertainty in the mean value.
We estimated typical errors in the abundances, which originate from uncertainties in the equivalent width , effective temperature , surface gravity , and microturbulent velocity . As mentioned above, the typical uncertainty in is per cent. Contributions of three other parameters can depend on , so we divided the stars into four groups as follows: 15000 K, between 15000 and 19000 K, between 19000 and 24000 K, 24000 K. In each group the mean errors in and are evaluated from the individual errors (see Paper II). As far as uncertainties in are concerned, we adopted the values km s-1 and km s-1 for stars with 5 km s-1 and 10 km s-1, respectively.
We found by this method that the full typical error in is about 0.14 dex for stars with between 19000 and 30000 K, about 0.20 dex for stars with between 15000 and 19000 K and can attain 0.30 dex for coolest programme stars with around 14000 K. It is important to note that the uncertainty in the microturbulent parameter gives the dominant contribution to the full error, namely from 40 to 65 per cent when decreases from 30000 to 19000 K and 70–80 per cent for cooler stars. The latter conclusion will play an important role in further discussion.
5.2 Comparison with , , and

We show in Fig.4 the derived Mg abundances as a function of the effective temperature and surface gravity . In Fig.5 the Mg abundances are displayed as a function of the microturbulent parameter and projected rotational velocity sin . Filled circles correspond to 36 stars with the values derived from N ii and O ii lines; open circles correspond to 16 stars, where we had to adopt the values determined from He i lines (see above). Dashed lines correspond to the solar abundance (Lodders 2003).

A few points are of special interest in Fig.4 and 5, namely:
-
1.
filled circles group well around the solar Mg abundance;
-
2.
open circles tend to show elevated values;
-
3.
open circles are collected in the region of lowest (Fig.4a);
-
4.
open circles correspond to the values close to zero (Fig.5a).
One may see from Fig.4a that for 11 of 16 open circles the stellar Mg abundance exceeds the solar one by greater than 0.30 dex, i.e., greater than the largest error found for the coolest programme stars (see above). These 11 stars have effective temperatures 17000 K excepting one star and the microturbulent velocities 0 2 km s-1 derived from He i lines.
We can not explain the Mg overabundance for 11 stars by uncertainties in the measurements. In fact, it is necessary to lower by 15–20 per cent to eliminate the overabundance, whereas the typical error in is 5 per cent. We considered a systematic overestimation of due to blending of the Mg ii 4481.2 Å line by some other lines. According to the VALD-2 database (Kupka et al. 1999), there is only one potential line, Fe ii 4480.7 Å, in the vicinity of Mg ii 4481.2 Å. This very weak line, as is the Al iii 4479.9 Å line, is clearly separated from Mg ii 4481.2 Å on our spectra of cool B stars with low sin .
As mentioned above, the coolest programme B stars are the most sensitive to uncertainties in ; moreover, errors in give for them a dominating contribution, up to 80 per cent, to the errors in . So, errors in are very likely to be a main cause of the Mg overabundance for such stars.
We present in Table 2 the thermal velocity of the He, N, O and Mg atoms for three temperatures T of interest. One sees that the values for the He atoms are by about a factor of two higher than for the N and O atoms. Even at = 15000 K, for helium is rather high, 8 km s-1. Therefore, when the microturbulent parameter is small but not zero, a broadening and strengthening of He i lines by microturbulence, unlike N ii and O ii lines, is small compared with the effects the thermal broadening. So, such a small is derived from He i lines with appreciable uncertainty. One may suppose that the values 0 km s-1 adopted for coolest stars are underestimated. Our analysis showed that it is enough to increase for such stars from 0 to 3 or 4 km s-1 in order to arrive at agreement in with other stars.
| , K | He | N | O | Mg |
|---|---|---|---|---|
| 15000 | 7.8 | 4.2 | 3.9 | 3.2 |
| 22000 | 9.6 | 5.1 | 4.8 | 3.9 |
| 30000 | 11.2 | 6.0 | 5.6 | 4.6 |
Thus, we arrive at the conclusion that the abundances represented in Fig.4 and 5 by open circles are less reliable, because they are likely based on the underestimated values. When excluding these abundances, we found the mean magnesium abundance for the 36 remaining stars. This value differs from the solar abundance only by 0.04 dex. It should be noted that it is also very close to the proto-Sun Mg abundance (Lodders 2003).
5.3 Abundances from the Mg II 7877 Å line for hot B stars
As mentioned above, uncertainties in the microturbulent parameter are the main sources of errors in the Mg abundances. On our spectra, there is a detectable Mg ii line at 7877.05 Å, which is rather weak in spectra of hot B stars and, therefore, insensitive to . This line is used by us as a check on the determination from the 4481 Å line.
Computations of the 7877 Å line with the same codes detail and surface showed that for B stars with the effective temperatures between 25000 and 30000 K its equivalent widths vary between 15 and 30 mÅ and, in fact, are almost independent of . At lower , the 7877 Å line is stronger and sensitive to the adopted . We selected from Table 1 five stars with 25000 K, namely HR 1756, 1855, 1861, 2739, and 8797, for which we could measure the line from the McDO spectra. The measurements were complicated by blending due to telluric H2O lines. To correct for the latter we used the spectrum of the hot B star HR 7446 with rapid rotation ( = 26800 K, sin = 270 km s-1, see Paper III). Weak lines, like 7877 Å, are not seen in its spectrum because of the rotation, so the telluric spectrum can be clearly observed. When comparing this spectrum with individual spectra of 5 stars, we allowed for the differences in airmasses. Dividing out the telluric lines in the vicinity of the 7877 Å line, we obtained its profile and measured the equivalent width .
The observed values for 5 stars range from 21 to 29 mÅ. The corresponding Mg abundances are very close to the values derived from the 4481 Å line. The mean Mg abundance from 7877 Å for these stars is , i.e., it coincides exactly with the above-mentioned mean abundance found from the 4481 Å line for the 36 stars with most reliable . Note that the mean Mg abundance from 4481 Å for the same 5 stars is . Therefore, very good agreement is found between the Mg abundances determined from the Mg ii lines at 7877 Å and 4481 Å. Thus, we confirmed the reliability of our results derived from the Mg ii 4481 Å line.
In our further discussion, the value is adopted as the final mean magnesium abundance in B stars. Therefore, according to formula (2), the mean index of metallicity is [] = . Thus, the mean metallicity of the B-type MS stars in the solar neighborhood is very close or equal to the metallicity of the Sun.
5.4 Distribution of the stars on
The derived magnesium abundances range from 7.24 to 8.06 in the case of all 52 stars and from 7.24 to 7.90 in the case of the 36 stars with the most reliable microturbulent parameters . What are causes of the spread in the Mg abundances? Is it possible to explain the spread only by errors in the values, or are there some real star-to-star variations?

In order to answer these questions, we plotted distributions of the abundances separately for the 52 stars (Fig.6a) and the 36 stars (Fig.6b). The pronounced feature in both histograms is the sharp maximum at and 7.64, respectively. It is interesting to note that the maximum position is very close to the proto-Sun magnesium abundance (Lodders 2003).
The histogram in Fig.6a shows one more feature: a second and weak maximum between and 8.06. This maximum is due completely to the relatively cool B stars with small derived from He i lines. These stars create a substantial asymmetry in the distribution; this fact can be considered as one more confirmation that the corresponding abundances were overestimated.
The second maximum is absent in Fig.6b, where the stars with less reliable Vt are excluded. In Fig.6b 27 of 36 stars have effective temperatures 19000 K; so, the typical error in for them is 0.14 dex (see above). For the remaining 9 stars with 16600 K 19000 K the typical error is 0.20 dex. Adopting for each star the error in accordance with its , we found that for 34 of 36 stars a scatter of around the maximum of the distribution (i.e. ) is less than 2 . Only two stars, HR 2688 and 2928, have a Mg underabundance that corresponds to 2.9 and 2.4 . One may conclude that the scatter in Fig.6b is well accounted for by the errors in . Nevertheless, some asymmetry of the star’s distribution in Fig.6b (the left wing is more extended than the right one) may indicate the existence of local B stars with a small Mg deficiency.
6 DISCUSSION
Daflon and her colleagues have analysed the Mg ii 4481 Å line in several samples of B stars with their ultimate goal being to determine the Galactic abundance gradient of Mg from about 5 kpc to 13 kpc. Our and their analysis techniques have much in common including the use of high-resolution high S/N spectra, use of the codes DETAIL and SURFACE, the same Mg model atom, and the same oscillator strengths for the components of the 4481 line. Our methods for determining the atmospheric parameters and the adopted values for those parameters differ. A comparison of Mg abundances and a discussion of the reasons for their slight difference is given in this section.
Daflon et al. (2003) determined Mg abundances for 23 stars from six OB associations within 1 kpc of the Sun: Galactocentric distances ranged from 6.9 kpc to 8.2 kpc on the assumption that the Sun is at 7.9 kpc. The mean Mg abundance for 20 stars from the five associations with Galactocentric distances of 7.6 kpc to 8.2 kpc is 7.370.14 or 0.22 dex less than our final mean abundance.
In other papers, Daflon and colleagues (Daflon, Cunha, & Butler 2004a,b) obtain Mg abundances for stars inside and outside the solar circle. Daflon & Cunha (2004) collate the abundances (and those of other elements) to determine and discuss the Galactic abundance gradients. Linear fits to the Mg abundances from 5 kpc to 13 kpc imply a solar abundance of around 7.4, i.e., a subsolar abundance but with a scatter from association to association that brushes the solar abundance.
Systematic differences exist between our atmospheric parameters and those used by Daflon and colleagues. There are clear differences in and . Our ’s are about 1500–1700 K cooler than Daflon’s. What differences in the magnesium abundances can arise because of differences in the scales? We considered as an example the star HR 1861 with parameters = 25300 K and = 4.11 (Table 1) and increased its value by 1700 K. As mentioned in Paper II, an overestimation of effective temperatures leads automatically to an overestimation of . (Note that traces of such overestimation are likely seen in the values of Daflon et al. (2003); unrealistically large are found for some stars: = 4.38–4.57 whereas on the ZAMS 4.25). In other words, if we raise , we should raise simultaneously . Using the - diagram for HR 1861, we found that must be increased by 0.17 dex. A redetermination of with the revised model atmosphere ( = 27000 K, = 4.28) showed that the magnesium abundance increases by 0.12 dex. (Note that the computed equivalent width of the line decreases with increasing , but increases with increasing , so a partial compensation takes place). We arrive at a conclusion that the difference in the scales results in a higher Mg abundance for Daflon et al.’s scale, but their published abundances are lower than ours. So, the difference with Daflon et al.’s scale cannot account for the difference in magnesium abundance between us.
As mentioned above, uncertainties in the microturbulent parameter give the dominating contribution to errors in . There is a significant discrepancy in the values between us and Daflon et al. Just this discrepancy can be the main cause of systematic differences in .
The microturbulent parameter was derived by us for 100 B stars from He i lines in Paper III. The number of stars studied was large, so we had an opportunity to divide the stars into three groups according to their masses M. It was shown that in the group of relatively low-massive stars (4.1 6.9) the values are mostly within the 0–5 km s-1 range. The same result is obtained for stars of intermediate masses (7.0 11.2) with the relative ages 0.8; however, for evolved giants with 0.80 1.02 there is a large scatter in up to = 11 km s-1. For the most massive stars of the sample (12.4 18.8) a strong correlation between and was found; for unevolved stars of the group ( 0.24) the velocities vary from 4 to 7 km s-1.
Very similar results were found by us recently from N ii and O ii lines. Since Daflon and colleagues derived from O ii lines, we consider at first our data inferred only from these lines. In particular, when considering all stars of the first group and the stars of the second group with 0.7, O ii lines give between 0 and 5 km s-1 and a mean value = 2.5 km s-1; note that these stars have effective temperatures 25500 K and surface gravities 3.9. For the unevolved stars of the third group ( 27000 K and 4.0) we found from O ii lines, as from He i lines, substantially greater values, 5.8 km s-1 on average. In accordance with this finding, we selected from the lists of Daflon et al. (2003, 2004a,b) two groups of stars, namely the stars with 25500 K and the stars with 27000 K; in both cases 4.0. The corresponding mean values are compared with our data in Table 3.
| Source | 25500 K | 27000 K |
|---|---|---|
| Daflon et al. (2003) | 7.0 (4) | 8.4 (10) |
| Daflon et al. (2004a,b) | 4.4 (7) | 6.5 (11) |
| our data | 2.5 (21) | 5.8 (3) |
One may see from Table 3 that there is a significant difference in for both groups between our and Daflon et al.’s (2003) results, while the difference with Daflon et al. (2004a,b) is markedly smaller. It is necessary to remember that we have used the values averaged on O ii and N ii lines, so our real mean values are somewhat smaller than in Table 3.
It is important to note once again that we determined independently from lines of three chemical elements, namely He i, N ii and O ii. Moreover, the Vt determination from N ii and O ii lines was implemented by the standard method, but that from He i lines was effected by a quite different method (Paper III). Nevertheless, all three sets of are in rather good agreement. In particular, for the B stars with 25500 K we found that (i) individual values range, as a rule, between 0 and 5 km s-1; (ii) mean values are 1.0, 0.5 and 2.5 km s-1 for He i, N ii and O ii, respectively. (Note that we have not found reasons to prefer (N ii) over (O ii), so we used an averaged value (N ii,O ii)). Thus, our results from He i, N ii and O ii lines confirm that our lower scale is preferable to the higher scale of Daflon et al. (2003, 2004a,b). It is important to remember as well that our mean Mg abundance 7.59 obtained with the (N ii,O ii) values from the Mg ii 4481 Å line is precisely confirmed from an analysis of the weak Mg ii 7877 Å line that is insensitive to .
We implemented trial determinations of with various for some stars from first and second groups. The changes in depend substantially on the effective temperature ; nevertheless, the final conclusion is clear: the differences in the values explain completely the above-mentioned discrepancies between our and Daflon et al.’s (2003) mean magnesium abundance.
It is interesting to note that, according to Daflon (2004), the lower values can be a result of the cooler effective temperatures . The difference between our and Daflon et al.’s scales cannot be sufficient to cause a marked change in thermal velocities and, hence, a change in . We believe that the difference in discussed above may be connected with a rough correlation between the observed equivalent widths and excitation potentials : lines with higher tend to show lower on average. These lines are more sensitive to than weaker lines, so their calculated values change more significantly when increases. In this case one should increase to eliminate a discrepancy in the derived abundances between relatively weak and strong lines.
7 CONCLUSIONS
For more than ten years the C, N, and O abundances have been considered as indicators of the metallicity of early B stars in reference to the Sun. However, it is gradually becoming clear that this choice is not the best one. On the one hand, there are empirical data that mixing exists in the early B-type MS stars between their interiors and surface layers, so the observed abundances of the CNO-cycle elements may be affected by evolutionary alterations. On the other hand, the solar C, N and O abundances were continuously revised and tended to decrease during this period. Unfortunately, it was impossible in these cases to use the accurate meteoritic abundances, because C, N and O are incompletely condensed in meteorites, so their meteoritic abundances are significantly lower than the solar ones.
Magnesium, unlike C, N and O, does not have such demerits. First, this chemical element should not alter markedly its abundance in B stars during the MS phase. Second, its solar abundance is known now very precisely from spectroscopic and meteoritic data. Displaying the rather strong Mg ii 4481.2 Å line in spectra of early and medium B stars, this element is appropriate as a reliable indicator of their metallicity.
Using the high-resolution spectra of 52 B stars we effected a non-LTE analysis of the Mg ii 4481.2 Å line and determined the magnesium abundance. We studied the role of the neighbouring Al iii 4479.9 Å line and selected stars with rather low rotational velocities sin and, therefore, with the Mg ii 4481.2 Å line well resolved from the Al iii 4479.9 Å line. We found for 52 stars the mean abundance . The effect of uncertainties in the microturbulent parameter on is important, especially for coolest programme stars. For 16 such stars the values were derived from He i lines, but not from N ii and O ii lines as for other stars. Being close to zero these (He i) values are less accurate than the (N ii,O ii) values. When excluding these 16 stars, we obtained the mean abundance for the remaining 36 stars. This abundance is precisely confirmed from an analysis of the weak Mg ii 7877 Å line for several hot B stars. This is our recommended Mg abundance for the B-type MS stars in the solar neighbourhood (with 800 pc). Comparing the latter value with the solar magnesium abundance , one may conclude that the metallicity of the stars is very close to the solar one. Our mean Mg abundance in B stars, as well as the position of the maximum in Fig.6, , is also very close to the proto-Sun magnesium abundance . We discussed the preceding determinations of the Mg abundance in B stars by Daflon et al. (2003). Their values are somewhat lower than ours. We showed that this difference in is explained by differences in .
Thus, our results show that the Sun is not measurably enriched in metals as compared with the neighbouring young stars.
8 ACKNOWLEDGEMENTS
Two of us, LSL and SIR, are grateful to the staff of the Astronomy Department and McDonald Observatory of the University of Texas for hospitality during the visit in spring 2004. DLL acknowledges the support of the Robert A. Welch Foundation of Houston, Texas.
References
- [1] Asplund M., 2002, in Charbonnel C., Schaerer D. and Meynet G., eds, CNO in the Universe, ASP Conf. Ser., 304, 275
- [2] Asplund M., Grevesse N., Sauval A.J., Allende Prieto C., Kiselman D., 2004, A&A, 417, 751
- [3] Allende Prieto C., Lambert D.L., Asplund M., 2001, ApJ, 556, L63
- [4] Allende Prieto C., Lambert D.L., Asplund M., 2002, ApJ, 573, L137
- [5] Butler K., 1984, PhD thesis, Univ. London
- [6] Butler K., 1994, http://ccp7.dur.ac.uk./Docs/detail.ps
- [7] Cunha K., Lambert D.L., 1994, ApJ, 426, 170
- [8] Daflon S., 2004, private communication
- [9] Daflon, S., Cunha, K. 2004, ApJ, in press (astro-ph/0409804)
- [10] Daflon S., Cunha K., Becker S., 1999, ApJ, 522, 950
- [11] Daflon S., Cunha K., Butler K., 2004a, ApJ, 604, 362
- [12] Daflon S., Cunha K., Butler K., 2004b, ApJ, 606, 514
- [13] Daflon S., Cunha K., Smith V.V., Butler K., 2003, A&A, 399, 525
- [14] Giddings J.R., 1981, PhD thesis, Univ. London
- [15] Gies D.R., Lambert D.L., Astrophys. J. 1992. V.387. P.673
- [16] Gonzalez G., 1997, MNRAS, 285, 403
- [17] Gonzalez G., 2003, Rev. Mod. Phys., 75, 101
- [18] Heger A., Langer N., 2000, ApJ, 544, 1016
- [19] Holweger H., 2001, in Wimmer-Schweingruber R.F. ed, Solar and Galactic Composition, American Institute of Physics Conf. Proc., 598, 23
- [20] Kilian J., 1992, A&A, 262, 171
- [21] Kilian J., Nissen P.E., 1989, A&AS, 80, 255
- [22] Kupka F., Piskunov N.E., Ryabchikova T.A., Stempels H.C., Weiss W.W., 1999, A&AS, 138, 119
- [23] Kurucz R., 1993, ATLAS9 Stellar Atmosphere Programs and 2 km s-1Grid, CD-ROM No.13, Cambridge, Mass., Smithsonian Astrophys. Obs.
- [24] Lodders K., 2003, ApJ, 591, 1220
- [25] Lyubimkov L.S., 1996, Ap&SS, 243, 329
- [26] Lyubimkov L.S., 1998, AZh, 75, 61 (also Astron. Rep., 42, 52)
- [27] Lyubimkov L.S., Lambert D.L., Rachkovskaya T.M., Rostopchin S.I., Tarasov A.E., Poklad D.B. Larionov V.M., Larionova L.V., 2000, MNRAS, 316, 19 (Paper I)
- [28] Lyubimkov L.S., Rachkovskaya T.M., Rostopchin S.I., Lambert D.L., 2002, MNRAS, 333, 9 (Paper II)
- [29] Lyubimkov L.S., Rostopchin S.I., Lambert D.L., 2004, MNRAS, 351, 745 (Paper III)
- [30] Maeder A., Meynet G., 2000, Ann. Rev. Astron. Astrophys., 38, 143
- [31] Mihalas D., 1972, ApJ, 177, 115
- [32] Napiwotzki R., Schönberner D., Wenske V., 1993, A&A, 268, 653
- [33] Nissen P.E., 1993, in Weiss W.W., Baglin A., eds, Inside the stars, ASP Conf. Ser., 40, 108
- [34] Przybilla N., Butler K., Becker S.R., Kudritzki R.P., 2001, A&A, 369, 1009
- [35] Tull R. G., MacQueen P. J., Sneden S., Lambert D. L., 1995, PASP, 107, 251