Satellite Infall and the Growth of Bulges of Spiral Galaxies
Abstract
For bulges of spiral galaxies, the concentration, or Sersic index, increases with bulge luminosity and bulge-to-disk ratio (Andredakis, Peletier, & Balcells, 1995). Does this trend trace the growth of bulges via satellite accretion? And, is satellite infall consistent with this trend? Aguerri, Balcells, & Peletier (2001) (ABP01, hereandafter) investigated this question with N-body simulations of the accretion of dense, spheroidal satellites. Here, we expand on that work by running N-body simulations of the accretion of satellites that have realistic densities. Satellites are modeled as disk-bulge structures with their own dark-matter halo. A realistic density scaling with the primary galaxy is ensured by using the Tully-Fisher relation. Our merger models show that most satellites disrupt before reaching the center. However, a bulge-disk decomposition of the surface density profile after the accretion shows an increase of both the and the Sersic index of the bulge. The increase in the mass and concentration of the inner Sersic component is due to inward piling up of disk material due to transient bars during the satellite orbital decay. This research is described in Eliche-Moral et al. (2005).
Proceeding of the Joint European and National Astronomical Meeting, ”The Many Scales in the Universe”, held in Granada, Spain, September 13-17, 2004.
Instituto de Astrofísica de Canarias, C/ Vía Láctea, E-38200 La Laguna, Tenerife, Spain. Contact: mcem@iac.es, balcells@iac.es, jalfonso@iac.es, cglez@iac.es
1 N-body models
Both the primary and satellite galaxies comprise an exponential disk,
a King-model bulge and a dark halo built as an Evans model.
N-body realizations are built following Kuijken & Dubinski (1995).
The satellite luminous mass scales with the mass of the initial bulge
as 1:2, 1:3 and 1:6. Relative sizes, or densities, are determined by
applying the Tully-Fisher to the primary and secondary. We experimented
with exponents of 3, 3.5 and 4.0, although the exponent did
not affect the main results. In total, we had 10 experiments.
Orbital parameters for the merger experiments, satellite mass ratios and
half-mass radii are given in Table 2.
Models were run using a TREECODE from Hernquist & Katz (1989), using 185,000 particles in each experiment. Masses, radii and number of particles are given in Table 1. In order to get structural parametes of the remnants, we performed Sérsic+exponential fits to the face-on azymutally-averaged radial surface brightness profiles using a code described in Graham (2001). The Sérsic law was used for fitting the bulge (Sérsic, 1968; Graham, 2001; Möllenhoff & Heidt, 2001; MacArthur, Courteau, & Holtzman, 2002):
| (1) |
where is the half-light radius, is the surface brightness at and is the Sérsic index. The factor is a function of the concentration parameter . An approximation that gives good results in the range 10 is bn=1.9992-0.3271 (see Capaccioli, 1987; Graham, 2001). Disk contribution can be fitted with the exponential law:
| (2) |
where is the disk scale length and is its central surface
brightness.
The final face-on, azymutally-averaged radial surface density profiles of the luminous matter for all the models are shown in Figures 1b-k. Figures 1a is the surface density profile of the luminous matter for the primary galaxy. Dotted and dashed lines are the simultaneous two component fits perfomed to the total luminous surface density (exponential plus Sérsic-law). Residuals in magnitudes of the fits appear down its corresponding surface brightness profile in Figure 1. As can be seen, they are less than 0.15 mags in all the cases, a quite reasonable result compared to typical observational errors. Final fitted parameters and bulge-to-disk mass ratios derived from the fits are tabulated in Table 3.
| Primary Galaxy | Satellites | Primary Galaxy Characteristics | |||||||||||||
| NP | Disk1 | Bulge1 | Halo1 | Disk2 | Bulge2 | Halo2 | |||||||||
| (1) | (2) | (3) | (4) | (5) | (6) | (7) | (8) | (9) | (10) | (11) | (12) | (13) | |||
| 185K | 40K | 10K | 90K | 10K | 5K | 30K | 0.42 | 0.82 | 5.20 | 0.195 | 1.0 | 0.1 | |||
Column description: (1) Total particle No. (2) No. of primary disk particles. (3) No. of primary bulge particles. (4) No. of primary halo particles. (5) No. of satellite disk particles. (6) No. of satellite bulge particles. (7) No. of satellite halo particles. (8) Primary bulge mass. (9) Primary disk mass. (10) Primary halo mass. (11) Primary bulge half-mass radius. (12) Disk truncation radius. (13) Disk scale height.
| Model | Code | |||||||
|---|---|---|---|---|---|---|---|---|
| (1) | (2) | (3) | (4) | (5) | (6) | (7) | (8) | (9) |
| (1) | M2TF4D | 1/2 | 0.16 | 4.0 | 0.4 | -0.00142 | 0.24873 | 30 |
| (2) | M2TF35D | 1/2 | 0.16 | 3.5 | 0.46 | -0.00142 | 0.24873 | 30 |
| (3) | M2TF3D | 1/2 | 0.16 | 3.0 | 0.54 | -0.00142 | 0.24873 | 30 |
| (4) | M3TF4D | 1/3 | 0.11 | 4.0 | 0.33 | -0.00131 | 0.24331 | 30 |
| (5) | M3TF35D | 1/3 | 0.11 | 3.5 | 0.39 | -0.00131 | 0.24331 | 30 |
| (6) | M3TF3D | 1/3 | 0.11 | 3.0 | 0.48 | -0.00131 | 0.24331 | 30 |
| (7) | M6D | 1/6 | 0.05 | 3.5 | 0.28 | -0.00029 | 0.23664 | 30 |
| (8) | M2R | 1/2 | 0.16 | 3.5 | 0.46 | -0.00142 | 0.24873 | 150 |
| (9) | M3R | 1/3 | 0.11 | 3.5 | 0.39 | -0.00131 | 0.24331 | 150 |
| (10) | M6R | 1/6 | 0.05 | 3.5 | 0.28 | -0.00029 | 0.23664 | 150 |
Column description: (1) Model number. (2) Model code. (3) Initial mass ratio between luminous satellite material and primary bulge material. (4) Initial mass ratio between satellite and primary galaxy. (5) Tully-Fisher index for scaling. (6) Initial half-mass radius ratio between satellite and bulge. (7) and (8) Radial and tangential velocity components of the relative orbit. (9) Initial angle between the orbital momentum and the primary disk spin. The other three angles involved in the orbits are fixed: =0∘, =25∘, and =90∘.

| Disk | Bulge | ||||||||||
|---|---|---|---|---|---|---|---|---|---|---|---|
| Model | Code | (mag) | |||||||||
| (1) | (2) | (3) | (4) | (5) | (6) | (7) | (8) | (9) | |||
| Initial | … | 0.037 | -0.870.01 | 1.050.02 | 0.010.04 | 0.1990.02 | 0.920.21 | 0.50 | |||
| (1) | M2TF3D | 0.053 | -0.990.05 | 1.190.03 | 0.140.02 | 0.1870.03 | 1.800.16 | 0.83 | |||
| (2) | M2TF35D | 0.035 | -0.950.02 | 1.130.02 | 0.230.06 | 0.1690.01 | 2.010.23 | 0.89 | |||
| (3) | M2TF4D | 0.039 | -0.990.02 | 1.160.05 | 0.180.01 | 0.1790.03 | 2.090.15 | 0.94 | |||
| (4) | M3TF3D | 0.047 | -0.920.03 | 1.110.04 | 0.130.02 | 0.1850.03 | 1.320.09 | 0.66 | |||
| (5) | M3TF35D | 0.035 | -0.970.01 | 1.150.06 | 0.210.03 | 0.1720.02 | 1.690.11 | 0.80 | |||
| (6) | M3TF4D | 0.048 | -0.980.02 | 1.170.05 | 0.110.01 | 0.1930.05 | 1.450.11 | 0.75 | |||
| (7) | M6D | 0.089 | -0.880.07 | 1.060.03 | 0.140.02 | 0.1810.04 | 1.180.13 | 0.63 | |||
| (8) | M2R | 0.066 | -0.800.04 | 0.970.02 | 0.130.04 | 0.1840.03 | 1.630.17 | 0.72 | |||
| (9) | M3R | 0.062 | -0.850.04 | 1.030.06 | 0.230.05 | 0.1620.04 | 2.040.13 | 0.78 | |||
| (10) | M6R | 0.040 | -0.900.01 | 1.090.07 | 0.220.02 | 0.1630.04 | 1.580.12 | 0.68 | |||
Column description: (1) Model number. (2) Model code. (3) of the fit. (4) Disk central intensity. (5) Disk scale length. (6) Bulge effective surface density. (7) Bulge effective radius. (8) Bulge profile Sérsic index. (9) Bulge-to-disk mass ratio derived from the Sérsic+exponential fit.
2 Growth of bulges
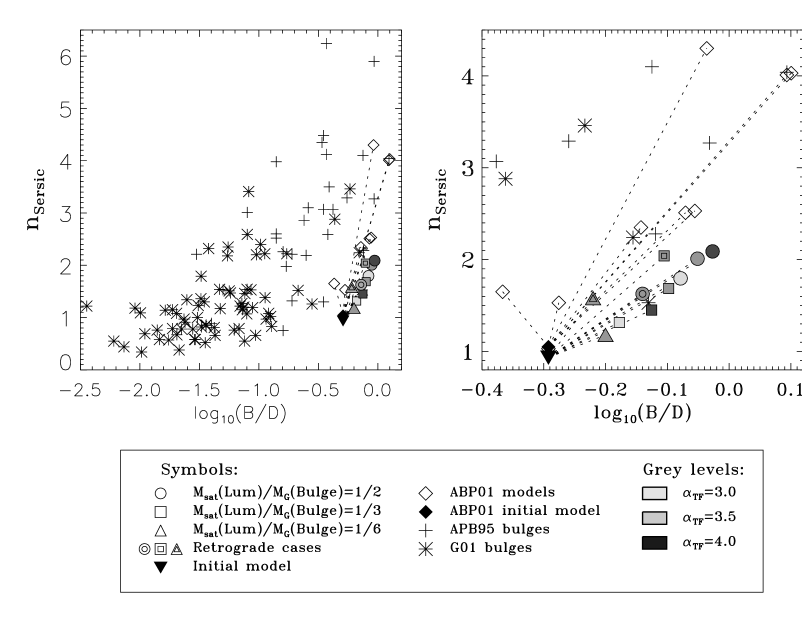
Figure 2 show growth vectors in the plane vs. log (), where the ratios are derived from the
Sérsic+exponential fits. Plotting points indicate the characteristics
of our run models, according to the legend in the Figure. Real bulges from the
samples of de Jong (1996b) (re-analysed by G01) and APB95 are drawn too,
together with the growth vectors of ABP01 high-density models (diamond points)
for comparison. Growth vectors in the plane vs. show a similar
dependence to the one found by ABP01: evolves quickly from an initial
exponential bulge 1 to earlier types bulges in all the cases, reaching =2.1,
and proportionally to the satellite mass.
Then, not only high-density, but also low-density satellite accretion onto
disk-bulge-halo galaxies causes the bulge surface brightness profile to
evolve toward higher- Sersic profiles, following similar increasing trends
and values for the Sersic index with ratios just as in the
observations. The low-density experiments fill the region in the plane
vs. that ABP01 high-density experiments left empty.
3 Why does increase
The evolution of the bulge profiles in the high-density experiments
of ABP01 was driven by the puffing up of the bulge material and the
deposition of the satellite’s high density cusp in the remnant center.
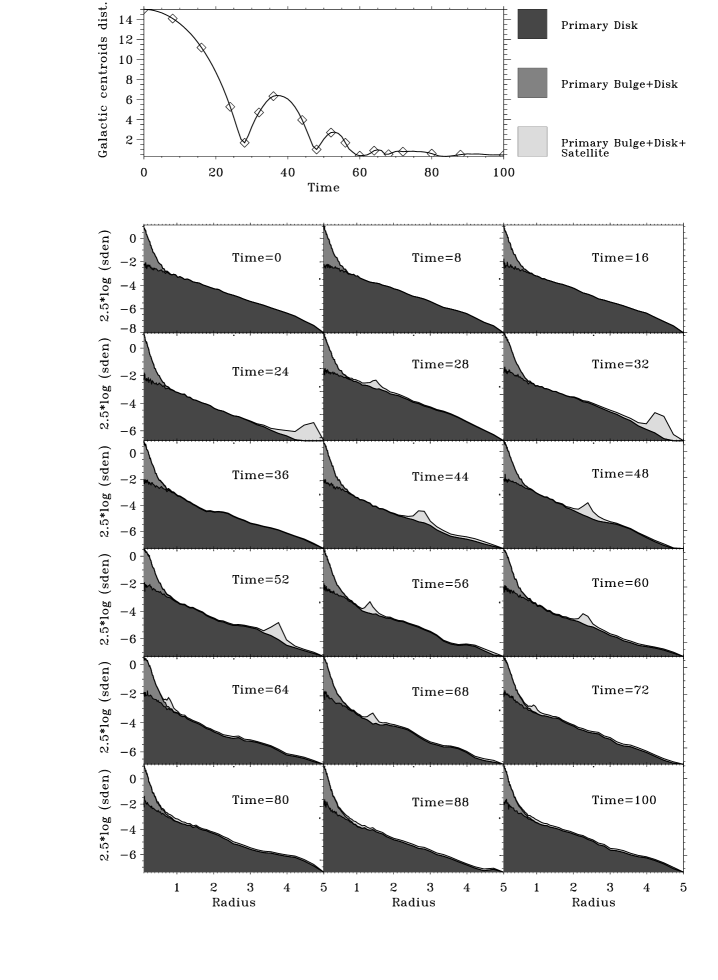
The dynamical mechanism for the increase of in low-density models is
different. In Figure 3 we show the time evolution of the primary
disk and bulge particles
to the surface brightness profile of the merger in model M3TF3D.
The contribution of the satellite
particles is plotted too. The satellite disrupts completely before reaching
the galactic center, in such a way that this deposition over the remaining
disk and the injection of disk material to the center are the responsible
of the steepening of the profile.
Figure 4 shows the radii enclosing a given percentage of
the mass for the particles initially belonging to the primary bulge for all
the models. Our bulges basically expand their outer layers, while the 90%
of their masses remains undisturbed. Then, bulge material
puffing up can not be the responsible of the increasing of in our
low-density satellite accretions, contrary to what happened in ABP01’s
high-density experiments.
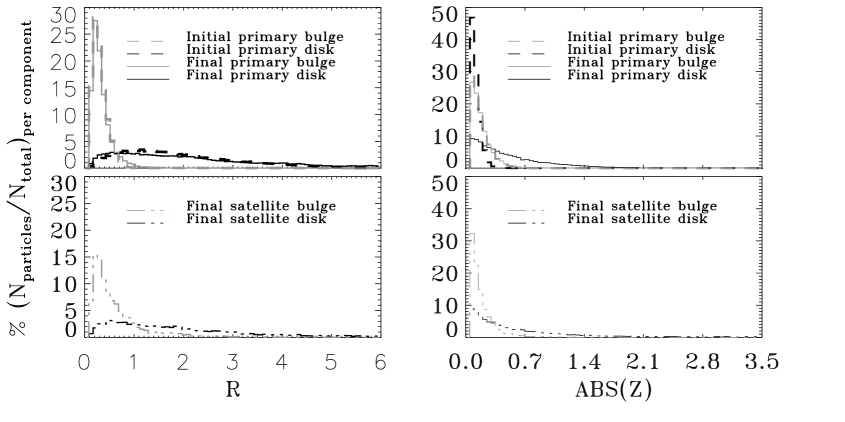
The distribution of material of each component in the final remnant of model M2TF4D is shown as a function of radius and height respect to the galactic plane in Figure 5. In the left panels, we have plotted the percentage respect to the total number of particles which initially belonged to each component at each galactic radius, . Right panels represent the same as a function of the absolute value of the -component. We have separated primary distributions (upper panels) from satellite contributions (lower panels) for clarity. Dashed lines indicate how the initial bulge and disk material were distributed, while solid lines correspond to the final acquired distribution by each of them in the upper panels. Dashed-dotted lines in the lower ones show final contributions of the satellite’s bulge and disk material. Bulge and disk particles are differenciated by the grey scale (light and dark grey respectively) in both satellite and primary galaxy distributions. Looking at the upper panels, it is obvious that the distribution of particles associated to the primary bulge experiments little changes radially and vertically. Primary disk matter experiments an inward flow, as it can be noticed from Fig. 3. Their outer layers generate tails and expand due to tidal forces in the direct orbits, and are inhibited in the retrograde cases (Mihos & Hernquist, 1996). Satellite disk material rebuilds an exponential disk, following similar trends along the same range of R and than the primary disk material. However, satellite’s bulge particles are confined to the remnant’s inner region and to small values of ; i.e., satellite bulge material contributes to the thin disk. This effect is due to the fact that dynamical friction circularizes the orbit of the satellite prior to disruption: stars at the core of the satellite are more resilient to disruption and therefore end up on more circular orbits than those stripped earlier during the satellite decay process. As in Abadi et al. (2003a, b) simulations, most stars in the satellite are dispersed into a torus-like structure, whose radius is that at which final disruption takes place. This redistribution of material produces a population mixture which could be the responsible of the similar colors observed between bulges and disks (Peletier & Balcells, 1996).

4 Scaling relations of disks and bulges
de Jong (1996a) and Courteau, de Jong, & Broeils (1996) observed that the
ratio between the bulge effective radius and the disk scale
length is independent of Hubble type, and claimed that the spiral Hubble
sequence is ”scale-free”. Balcells, Graham, & Peletier (2004b) (BGP04, hereandafter) confirm the
independence of most disk-bulge structural parameters with Hubble type, but
found that such photometric parameters of bulges and disks strongly correlate
with bulge luminosity and with Sersic index . They conclude that galaxies
themselves are not scale-free, the luminosity of the bulge being the critical
scale.
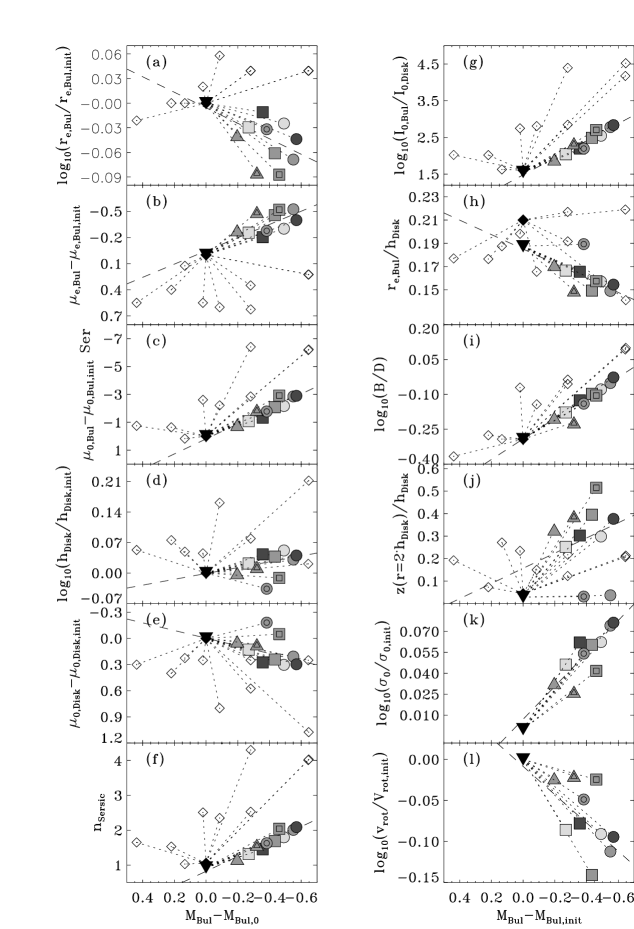
In Figure 6, the dependences of the bulge and disk
photometric parameters on the mass of the final bulge are shown, this last
parameter obtained from the simultaneous Sérsic-exponential fits performed
to the surface density profiles of the remnants. Supposing that the
mass-to-light ratio is constant and very similar for real bulges
(Portinari, Somer-Larsen, & Tantalo, 2004), we have defined the bulge magnitude as
, because the bulge total mass can be directly
related to its luminosity through the constant . We have plotted ratios
between the parameters of the final merger remnants and the corresponding to
the initial galaxy vs. the increment in the bulge magnitude
(i.e., final minus initial magnitude). Legend for symbols is the
same as in Figure 2. Notice that the strong proportional
relations between photometric parameters and the bulge magnitude in our
low-density models are weaker in the ABP01’s dense models (represented by
empty diamonds in the Figure); trends as those exhibited by ,
, log (), log () and
log () (see panels (c), (f), (g), (i) and (k) in the Figure)
correspond to correlation coefficients greater than 0.96 when a lineal fit
is performed (you can
see these values in Col. 6 from Table 4).
This means that low-density satellite accretion
processes do not alter galaxies randomly: they give place to remnants whose
properties are scaled between them, depending on the mass ratios and the
orbit of the encounter. In adddition, all the remnants have brighter bulges
than initially.
BGP04 gave mathematical expressions for the stronger relations, as follows:
| (3) |
where represents a given photometric parameter (as ,
, , , …), or the ratio between two of them;
is the K-band bulge magnitude; and () and
() are the slope and zero-point obtained from the orthogonal
regression to the log()- relation. We have performed linear
fits to the relations shown at Figure 6, representing
results by the dashed line in each case. Therefore, if real bulges grow
through satellite accretions, our slopes should be similar to those found by
BGP04, because our models are scalable and hence they can be displaced in
the plane log()-. The constants needed for
transforming from masses to luminosities and from a unit system to another
do not affect the slopes in the
relations, as they end as part of the additive term of the linear fit.
In Table 4, the slopes for all the strong
correlations observed by BGP04 are compared to those obtained in our
low-density models. It is encouraging that low-density models reproduce the
observed tendencies in disk parameters, central velocity dispersions and
ratios. The correlations which we fail to reproduce with our experiments
are those involving the bulge effective radius (see in panel
(a) and in panel (h) in the Figure).
becomes smaller
with the accretion, while observed higher luminosity bulges have larger
effective radii
(Hubble, 1926; Binggeli, Sandage, & Tarenghi, 1984; Möllenhoff & Heidt, 2001, among others).
This is due to the fact
that the primary bulge material remains unaltered, while the bulge region
receives a large inward piling up of disk particles that rises the central
galactic brightness, making the effective radius decrease.
On the other hand, the slope for the bulge central brightness
is very different from the observed value also, despite its sign
is positive in both cases (see Table 4). Moreover, we find a
correlation between the bulge effective brightness and LK,bulge, while
BGP04 do not detect a clear tendency in their sample of intermediate- to
early-type spirals. Of course, these discrepancies remain important
limitations of the current accretion models. Probably, these problems are
associated to the fact that models without
star formation and gas hydrodynamics implemented give an incomplete vision
of the physical processes involved in the galactic accretions. These
processes are known to affect central structure of real galaxies
significantly (Mihos & Hernquist, 1996). Hence, all the relations
found for the bulge
parameters and ratios related to them must be distrusted.
On the other hand,
correlations involving large-scale parameters of the galaxy are well
reproduced, probably because they are less affected by star formation.
| Observational | Modelled | |||||||||||
| Photometric parameter | Obs. Slope | Photometric parameter | Model Slope | |||||||||
| (1) | (2) | (3) | (4) | (5) | (6) | (7) | ||||||
| log () | -0.164 | 0.028 | -0. | 79 | log () | 0.09 | 0.04 | 0. | 41 | 0. | 004 | |
| no correlation | … | 0.76 | 0.19 | 0. | 67 | 0. | 068 | |||||
| 0.92 | 0.16 | 0. | 63 | 5.4 | 0.6 | 0. | 98 | 0. | 713 | |||
| log () | -0.112 | 0.016 | -0. | 64 | log () | -0.07 | 0.04 | -0. | 73 | 0. | 003 | |
| -0.30 | 0.06 | -0. | 63 | -0.44 | 0.22 | -0. | 80 | 0. | 094 | |||
| log () | not significative | … | log () | -2.33 | 0.17 | -0. | 99 | 0. | 054 | |||
| log () | no correlation | … | log () | 0.062 | 0.008 | 0. | 87 | 0. | 000 | |||
| log () | -0.30 | 0.04 | -0. | 80 | log () | -0.442 | 0.018 | -0. | 99 | 0. | 001 | |
| not significative | … | -2.13 | 0.23 | -0. | 99 | 0. | 107 | |||||
| … | … | … | -0.34 | 0.09 | -0. | 82 | 0. | 157 | ||||
| log () | -0.13 | 0.02 | -0. | 81 | log () | -0.118 | 0.019 | -0. | 96 | 0. | 001 | |
| … | … | … | log () | 0.17 | 0.07 | 0. | 67 | 0. | 009 | |||
Column description: Columns (1)-(3), fitted slopes of the
correlations between photometric
parameters and the K-band bulge magnitude, from the observational sample
of intermediate- to early-type spirals by BGP04. Columns (4)-(7),
fitted slopes for the equivalent correlations obtained from our models, using
the corresponding structural parameters.
Columns: (1) Observational photometric parameter.
(2) Observational fitted slopes of parameter in Col. 1 vs. from BGP04.
(3) Observational correlation coefficient for the fit.
(4) Structural parameters from our low-density models.
(5) Fitted slopes of parameters in Col. 4 vs. .
(6) Correlation coefficient for the fit.
(7) of the fit.
5 Summary
The study of the effects of satellite infall onto galaxies needs to
consider the dynamical transformations of the primary galaxy during the
accretion (e. g. , triggering of spiral and bar distortions, redistribution
of disk material), in addition to the deposition of accreted mass.
Low-density satellites that disrupt during their decay cause systematic
structural transformations in the primary galaxy. It evolves towards higher
, higher , higher , higher and lower
, all following trends similar to observations. A complete
matching to present day galaxies may require the contribution of
dissipative gas and star formation processes.
The infall of small, collapsed baryonic clumps is an inherent ingredient
of galaxy
formation models based on CDM (White & Rees, 1978).
The models presented
here might indicate that such infall drives pre-existing disks to a
secular evolution toward higher and , through the inflow of primary
disk material to the center via transitory bars,
the deposition of
satellite material rebuilding the exponential disk and the re-distribution
of material vertically by heating. Secular evolution is currenly
being discussed as the outcome of bar instabilities in the disk due
to gas cooling (Kormendy & Kennicutt, 2004). The present models could indicate
that secular evolution can be due to satellite accretion as well.
The latter might have been important at earlier galaxy ages.
References
- Abadi et al. (2003a) Abadi, M.G., Navarro, J.F., Steinmetz, M., & Eke, V.R. 2003, ApJ, 591, 499A
- Abadi et al. (2003b) Abadi, M.G., Navarro, J.F., Steinmetz, M., & Eke, V.R. 2003, ApJ, 597, 21A
- Aguerri, Balcells, & Peletier (2001) Aguerri, J.A.L., Balcells, M., & Peletier, R.F. 2001, A&A, 367, 428 (ABP01)
- Andredakis, Peletier, & Balcells (1995) Andredakis, Y. C., Peletier, R. F., & Balcells, M. 1995, MNRAS, 275, 874
- Balcells, Graham, & Peletier (2004a) Balcells, M., Graham, A.W., & Peletier, R.F. 2004, ApJ submitted, arXiv:astro-ph/0404379
- Balcells, Graham, & Peletier (2004b) Balcells, M., Graham, A.W., & Peletier, R.F. 2004, ApJ submitted, arXiv:astro-ph/0404381 (BGP04)
- Binggeli, Sandage, & Tarenghi (1984) Binggeli, B., Sandage, A., & Tarenghi, M. 1984, AJ, 89, 64
- Capaccioli (1987) Capaccioli, M., in IAU. Symp. 127, structure and Dynamics of Elliptical Galaxies, ed. P.T. de Zeeuw (Dortrecht: Reidel), 47
- Courteau, de Jong, & Broeils (1996) Courteau, S., de Jong., R. S., & Broeils, A. H. 1996, ApJ, 457, L73
- de Jong (1996a) de Jong, R. S. 1996, A&AS, 118, 557 (a)
- de Jong (1996b) de Jong, R. S. 1996, A&A, 313, 45 (b)
- Eliche-Moral et al. (2005) Eliche-Moral, M.C., Balcells, M., Aguerri, J.A.L., & González-García, A.C. 2005, in preparation
- Graham (2001) Graham, A.W. 2001, AJ, 121, 820 (G01)
- Hernquist & Katz (1989) Hernquist, L., & Katz, N. 1989, ApJS, 70, 419
- Hubble (1926) Hubble, E.P. 1926, ApJ, 64, 321
- Kormendy & Kennicutt (2004) Kormendy, J., & Kennicutt, R. C. Jr. 2004, ARA&A, 42, 603K
- Kuijken & Dubinski (1995) Kuijken, K., & Dubinski, J., 1995, MNRAS, 277, 1341
- MacArthur, Courteau, & Holtzman (2002) MacArthur, L.A., Courteau,S., & Holtzman, J.A. 2002, ApJ, 582, 689
- Mihos & Hernquist (1996) Mihos, J.C., & Hernquist, L. 1996, ApJ, 464, 641
- Möllenhoff & Heidt (2001) Möllenhoff, C., & Heidt, J. 2001, A&A, 368, 16
- Peletier & Balcells (1996) Peletier, R.F., & Balcells, M. 1996, AJ, 11, 2238
- Portinari, Somer-Larsen, & Tantalo (2004) Portinari, L., Somer-Larsen, J., & Tantalo, R. 2004, MNRAS, 347, 691
- Sérsic (1968) Sérsic, J.L. 1968, Atlas de galaxias australes, Observatorio Astronómico, Córdoba
- White & Rees (1978) White, S.D.M., & Rees, M.J. 1978, MNRAS, 183, 341W