A Multi-Wavelength Study of the Western Lobe of W50 Powered by the Galactic Microquasar SS 433
Abstract
W50 remains the only supernova remnant (SNR) confirmed to harbor a microquasar: the powerful enigmatic source SS 433. Our past study of this fascinating SNR revealed two X-ray lobes distorting the radio shell as well as non-thermal X-rays at the site of interaction between the SS 433 eastern jet and the eastern lobe of W50. In this paper we present the results of a 75 ksec ACIS-I observation of the peak of W50-west targeted to 1) determine the nature of the X-ray emission and 2) correlate the X-ray emission with that in the radio and infrared domains. We have confirmed that at the site of interaction between the western jet of SS 433 and dense interstellar gas the X-ray emission is non-thermal in nature. The helical pattern observed in radio is also seen with . No correlation was found between the infrared and X-ray emission.
keywords:
binaries: close , ISM: individual (W50) , X-rays: stars , stars: individual (SS 433) , radiation mechanisms: non-thermal , supernova remnants, , ,
1 Introduction
SS 433 is a peculiar binary system, consisting of a black hole (as proposed by Lopez et al., 2005) and a massive companion. This system is accreting at a super-Eddington rate, and is expelling two-sided relativistic jets at a velocity of 0.26c. These jets precess in a cone of half-opening angle of 20∘ (Margon, 1984).
SS 433 is near the center of W50, a large 21∘ nebula stretched in the east-west direction, and catalogued as an SNR (Green, 2005).The SS 433/W50 system is the only Galactic object known of its kind, giving rise to a unique laboratory to study the association between SNRs and black holes as well as the interaction between relativistic jets and the surrounding medium.
This system has been studied extensively in radio continuum and HI (Dubner et al., 1998), millimetre wavelengths (Durouchoux et al., 2000), and in X-rays with and (Safi-Harb & Ögelman, 1997, and references therein) and with RXTE (Safi-Harb & Kotani, 2002, Safi-Harb & Petre, 1999). From this multi-wavelength study, it was concluded that the morphology and energetics of W50 are consistent with the picture of the jets interacting with an inhomogeneous medium and likely hitting a denser cloud in the west.
The observation presented here provides the highest resolution X-ray image obtained to date of the bright region of the western lobe of W50. This region was chosen because it coincides with IR emission and can probe the jet-cloud interaction site. We performed a spatially resolved spectroscopy of this region to primarily determine the nature of the emission and correlate the X-ray emission with radio and IR observations. The paper is organized as follows. In §2, we summarize the observation imaging and spectral results and compare them to the and data. In §3, we study the X-ray emission in correlation with the infrared and radio emission, and finally present our conclusions in §4.
2 Chandra Data Reduction and Analysis
The western lobe of W50 was observed with the ACIS-I chips on board on 2003 August 21 at a CCD temperature of -120∘C. The charge transfer inefficiency was corrected using the APPLY_CTI tool on the level 1 raw data. A new level 2 file was then obtained using the standard CIAO 3.0 routines. The final exposure time was 71 ksec.
2.1 Imaging
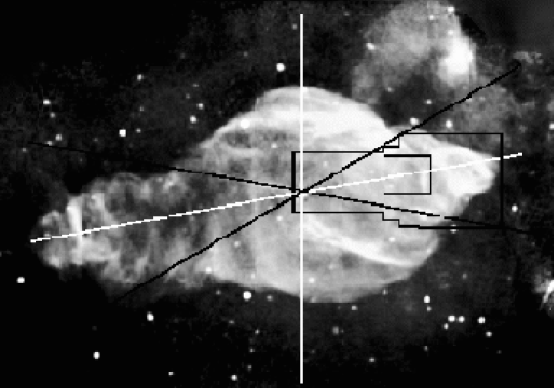
To illustrate the W50 region covered by , we show in Fig. 1 the the radio image of W50 (grey scale), and the regions covered by observations in infrared (large box) and X-ray (small box). The projection on the sky of the precession cone axes of the SS 433 jets is also overlayed. The radio image shows that the eastern wing of W50 exhibits a corkscrew pattern, which mimics the precession of the arcseconds-scale jets from SS 433 (Dubner et al., 1998, Hjellming & Johnston, 1981). Interestingly, there is a hint of a corkscrew pattern visible in the Chandra image (Fig. 2 and 3), supporting the conclusion that the SS 433 subarcsecond-scale relativistic jets are affecting the large scale radio and X-ray emission from W50.
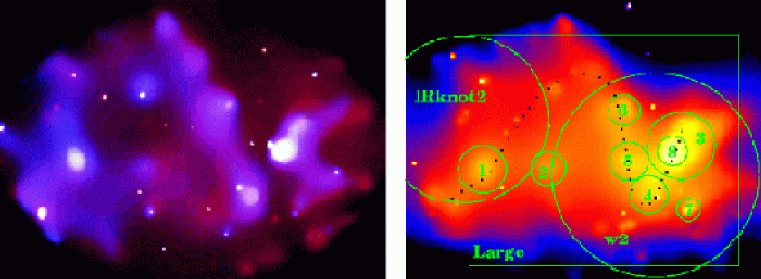
In Fig. 2, we show the energy image in which red corresponds to the soft energy band (0.3-2.4 keV) and blue corresponds to the hard energy band (2.4-10 keV). In Fig. 3, we show the intensity image in the 0.3-10 keV energy range. We resolve many point sources in the field (a list of which will be provided elsewhere) and note the knotty structure of the nebula. The X-ray emission peaks at (J2000) = 19h 09m 42s.86, (J2000) = 05∘ 03′ 38′′.8.
.
2.2 Spectroscopy
To perform spatially resolved spectroscopy of the remnant, we excluded the point sources in the field, and extracted spectra from the diffuse emission for 11 regions shown in Fig. 3. The w2 and IRknot2 regions correspond to the X-ray w2 region presented in Safi-Harb & Ögelman (1997) and the infrared knot2 region presented by Band (1987), respectively. These regions will be the focus of this paper and are selected in order to compare the results with those found in X-rays with and and in infrared with ISOCAM.
The proximity of the western lobe to the Galactic plane complicates the spectral analysis because of contamination by the Galactic ridge. To minimize this contamination, we extracted several background regions from source-free regions around the diffuse emission from W50 and from the same ACIS chip. We subsequently determined the spectral parameters using the resulting average background. Spectra were extracted in the 0.5-10.0 keV range. The background subtracted count rate for the w2 and IRknot2 regions are counts s-1 and counts s-1 respectively.
To determine whether the emission is thermal or not, we fitted the spectra with thermal bremsstrahlung and power-law models (following Safi-Harb & Ögelman, 1997). The bremsstrahlung model is characterized by the shock temperature, , and the power-law model is characterized by the photon index, .
Both models give adequate fits in each region. However, we find that the power-law models give slightly lower reduced values, and that the temperatures derived from the thermal bremsstrahlung models are high (unrealistically high for even the youngest SNRs). This, together with the absence of line emission in the spectra, leads us to favor the non-thermal interpretation for the X-ray emission. Table 1 summarizes the results for the w2 region in comparison to the and results. A distance of 3 kpc (scaled by ) is used in the luminosity calculations (as in Dubner et al., 1998), and the errors are at the 90% confidence level.
The spectroscopic results of the other regions are beyond the scope of this paper and will be presented elsewhere; we note here that the spectrum softens with increasing distance from SS 433 except for regions 3, 6 and 8. This is consistent with the energy-color image shown in Fig 2.
| Data Set/ | Reduced | |||
|---|---|---|---|---|
| Model | ( cm-2) | or (keV) | ( erg/s) | (DOF) |
| Chandra | ||||
| PL……….. | 5.45 | 1.21 (137) | ||
| BREMS… | 4.56 | 1.21 (137) | ||
| ROSAT/ASCA | ||||
| PL……….. | 5.45 | 1.41 (95) | ||
| BREMS… | 4.23 | 1.28 (95) |
We subsequently use the power-law fits to derive the synchrotron emission parameters. Assuming equipartition between particles and fields and integrating from radio to X-ray frequencies, the equipartition magnetic field (), the magnetic energy density (), the total synchrotron electron energy () and the lifetime of the electrons () can be determined. For the w2 region, we derive G, erg cm-3, ergs, and years. The range of values corresponds to a=1-100 (the ratio of baryon energy to electron energy). The derived values of the synchrotron parameters as well as (Table 1) agree with those found using and for the w2 region, within error. However, the spectra appear harder with the observation.
3 Correlation With Radio & Infrared
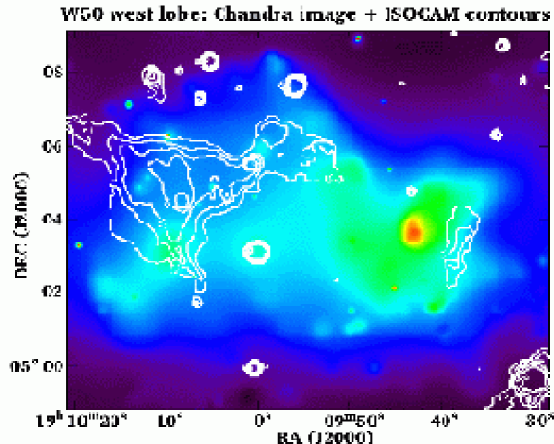
To probe the interaction between the western jet of SS 433 and the ambient medium, we study the X-ray emission in correlation with radio continuum and HI data obtained with the NRAO111The NRAO is a facility of the NSF operated under a cooperative agreement by Associated Universities Inc. VLA and Green-Bank radio telescope and infrared data obtained with ISOCAM. Fig. 1 shows the radio, infrared, and X-ray regions and Fig. 4 shows the X-ray emission with the infrared contours.
The average value of found on the basis of the HI observations is cm-2. This is slightly lower than the average found using the data, which is to be expected.
The energetics in the western lobe found with the X-ray data can then be compared to that found in Dubner et al. (1998). We found the total synchrotron electron energy in X-rays to be ergs, which is in good agreement with the energy found from radio observations.
As seen in Fig. 4, there is no correlation between the infrared emission and the peak of X-ray emission. This, along with the high value of (NH21022 cm-2) derived for the IRknot2 region, suggests that the infrared emission is not associated with the western lobe of W50. The derived value of keV is higher than the expected temperatures for SNRs, indicating that the X-ray emission in IRknot2 is non-thermal.
4 Conclusions
We favor a non-thermal interpretation for the emission of the western lobe of W50. The derived values of , equipartition magnetic field, synchrotron electron energies and lifetimes agree with those derived previously with and ASCA.
The infrared emission is not correlated with the peak of X-ray emission. This, in addition to the high value of derived for this region, suggests that the infrared emission is not originating from W50, and could be associated with a star forming region (work in progress).
The corkscrew pattern seen in both the radio and X-ray images provides strong support to the hypothesis that the relativistic jets from SS 433 are causing the morphology of the W50 nebula.
5 Acknowledgments
S. Safi-Harb acknowledges support by an NSERC UFA Fellowship and an NSERC Discovery Grant (Canada). Y. Fuchs is supported by a CNES (France) fellowship. G. Dubner is a Member of the Carrera del Investigador Científico, CONICET (Argentina).
This research made use of NASA’s Astrophysics Data System. We thank the two anonymous referees for their useful comments.
References
- Band (1987) Band, D. IRAS observations of SS 433 and W50. PASP, 99, 1269-1276, 1987.
- Dubner et al. (1998) Dubner, G., Holdaway, M., Goss, M., et al. A high-resolution radio study of the W50-SS 433 system and the surrounding medium. AJ, 116, 1842-1855, 1998.
- Durouchoux et al. (2000) Durouchoux, P., Sood, R., Oka, T., et al. Jet interaction of SS 433 with the ambient medium. AdSpR, 25, 703-708, 2000.
- Green (2005) Green, D.A. 2005, Bulletin of the Astronomical Society of India, 32, in press (Astro-ph/0411083).
- Hjellming & Johnston (1981) Hjellming, R., Johnston, K. An analysis of the proper motions of SS 433 radio jets. ApJ, 246, L141-L145, 1981.
- Lopez et al. (2005) Lopez, L., Marshall, H., Canizares, C., et al. Determining the nature of the SS 433 binary from an X-ray spectrum during eclipse. These proceedings.
- Margon (1984) Margon, B. Observations of SS 433. ARAA, 22, 507-536, 1984.
- Safi-Harb & Ögelman (1997) Safi-Harb, S., & Ögelman, H. and observations of W50 associated with the peculiar source SS 433. ApJ, 483, 868-881, 1997.
- Safi-Harb & Petre (1999) Safi-Harb, S., & Petre, R. Rossi X-ray Timing Explorer observations of the eastern lobe of W50 Associated with SS 433. ApJ, 512, 784-792, 1999.
- Safi-Harb & Kotani (2002) Safi-Harb, S., & Kotani, T. SS 433: Radio/X-ray anti-correlation and fast-time variability. Astro-ph/0210396, 2002.