2 Astrophysikalisches Institut und Universitäts- Sternwarte, Schillergächen 2-3, 07745 Jena
11email: bonnie@astro.uni-jena.de
Giant Planet Formation
We present a model for the equilibrium of solid planetary cores embedded in a gaseous nebula. From this model we are able to extract an idealized roadmap of all hydrostatic states of the isothermal protoplanets. The complete classification of the isothermal protoplanetary equilibria should improve the understanding of the general problem of giant planet formation, within the framework of the nucleated instability hypothesis. We approximate the protoplanet as a spherically symmetric, isothermal, self-gravitating classical ideal gas envelope in equilibrium, around a rigid body of given mass and density, with the gaseous envelope required to fill the Hill-sphere. Starting only with a core of given mass and an envelope gas density at the core surface, the equilibria are calculated without prescribing the total protoplanetary mass or nebula density. In this way, a variety of hydrostatic core-envelope equilibria has been obtained. Two types of envelope equilibria can be distinguished: uniform equilibrium, were the density of the envelope gas drops approximately an order of magnitude as the radial distance increases to the outer boundary, and compact equilibrium, having a small but very dense gas layer wrapped around the core and very low, exponentially decreasing gas density further out. The effect of the envelope mass on the planetary gravitational potential further discriminates the models into the self-gravitating and the non-self gravitating ones. The static critical core masses of the protoplanets for the typical orbits of 1, 5.2, and 30 AU, around a parent star of 1 solar mass () are found to be 0.1524, 0.0948, and 0.0335 Earth masses (), respectively, for standard nebula conditions (Kusaka et al. kusaka (1970)). These values are much lower than currently admitted ones primarily because our model is isothermal and the envelope is in thermal equilibrium with the nebula. Our solutions show a wide range of possible envelopes. For a given core, multiple solutions (at least two) are found to fit into the same nebula. Some of those solutions posses equal envelope mass. This variety is a consequence of the envelope’s self-gravity. We extend the concept of the static critical core mass to the local and global critical core mass. Above the global critical mass, only compact solutions exist. We conclude that the ’global static critical core mass’ marks the meeting point of all four qualitatively different envelope regions.
Key Words.:
planetary systems: formation, protoplanetary disk; Planets and satellites: general; Solar system: general1 Introduction
With the discovery of the extra-solar gas giants, the general
problem of planet formation has considerably grown in complexity
over the last decade. However, a global theoretical overview of
the properties of the giant planets, irrespective of the parent
protoplanetary disc or the total mass of the giant
planet, is still missing.
In the nucleated instability hypothesis, envelopes of giant planets are thought to be formed as a consequence of
accretion of solid bodies forming their cores. To determine the envelope mass corresponding to a given core, static
protoplanetary models have been constructed (e.g. Perri & Cameron perri (1974), Mizuno mizuno (1980), Stevenson
stevenson (1982)).
If the envelope is modelled including detailed energy transfer
and if the outer part of the envelope is radiative, and for
standard assumptions about nebula conditions, it has been found
that there is an upper limit for the masses of static envelopes
and therefore for the total mass of a proto giant planet. This
upper limit in core mass - the critical mass - was found to be
insensitive to nebula conditions, but to depend weakly on dust
opacities (Mizuno mizuno (1980)) and on the rate at which the
core (solid body) is accreted (Stevenson stevenson (1982)).
Even the largest static critical masses are typically more than
a factor of ten smaller than Jupiter’s mass (Mizuno
mizuno (1980), Stevenson stevenson (1982), Wuchterl
1991b , Ikoma et al. ikoma (2001)). The nondependence of
the critical mass on nebula conditions disappears when the
outermost parts of the protoplanetary envelopes become
convective, which happens for nebula properties which are well
within of proposed solar nebula conditions (Wuchterl
wuc93 (1993)). Envelope masses of such protoplanets range between 6 and
48 Earth masses () but hydrostatic models alone
are unable to reproduce a Jupiter-mass protoplanet. Therefore
dynamical and/or quasi-hydrostatical effects should
play an important role in the formation of gas giants.
There is a number of incompletely studied processes (e.g. the
formation, evolution, and stability of the protoplanetary disks,
the dust growth, the planetesimal formation, etc. ) that are
relevant for the general problem of planet formation. Their
complexity makes a piecewise approach necessary in studies of
planet formation. An alternative approach is to study the
final outcome, i.e. the possible and probable end-states of the
process. In that context, we present an idealized road-map of
all hydrostatic states, in order to provide insight when
analyzing the complex behavior of hydrodynamic and
quasi-hydrostatic models with detailed microphysics. In
addition, this work aims to clarify the concept of the critical
core mass necessary to permanently attract gas of the
protoplanetary nebula to a terrestrial-planet-like heavy
element core.
2 Model
2.1 Motivation
Within nucleated instability theory, the formation of giant
planets includes many possible scenarios for protoplanetary cores
and their respective envelopes. These range from small planetoids
embedded in dilute protoplanetary nebulae to
present-day-Jovian-like cores of several squeezed
by some Mbars of metallic H2-He mixtures (Guillot
guillot (1999)). To date, many investigations have been made into
the evolution of protoplanets, both hydrostatically (e.g.
Bodenheimer et al. bodenheimer (2000), Ikoma ikoma (2001), see
Wuchterl et al. ppiv (2000) for review) and hydrodynamically (e.g.
Wuchterl 1991a , 1991b , wuc93 (1993)). In these
studies, ’the evolution’ of particular planets is followed,
but not much is known about the evolution of all possible
protoplanets. Therefore, it is somewhat difficult to bring
the detailed solutions of previous investigations within a global perspective.
We follow the thermodynamical approach that was used by Stahl et
al. (stahl (1995)) to investigate the coreless equilibria of
constant-mass isothermal gas spheres, and the nature of the Jeans
instability. We also expand on the work of Sasaki sasaki (1989),
who studied isothermal protoplanets in the minimum mass solar
nebula (MMSN). In our model the total mass of the protoplanet and
the density of nebula cloud in which the protoplanet is embedded
are not prescribed. In leaving these as output variables, and
starting only with the (heavy-element) core mass and the density
of the envelope gas at the core’s surface, we aim for a
complete classification of all hydrostatic equilibria. This
classification should contribute to clarifying whether multiple
planetary equilibria exist for given nebula conditions and how
protoplanetary models relate to gas giants, both inside and
outside of the solar system.
2.2 Model Assumptions
We approximate the protoplanet as a spherically symmetric, isothermal, self-gravitating classical ideal gas envelope in equilibrium around a core of given mass. This gaseous envelope is that required to fill the gravitational sphere of influence, approximated by the Hill-sphere:
| (1) |
where is the orbital distance from a parent star. With mean molecular weight of , protoplanetary envelopes, as well as the nebula, are roughly approximated by a hydrogen-helium mixture. The protoplanet’s heavy-element-core is represented by a rigid sphere of uniform density of .
The nebula temperature profile is taken according to Kusaka et al. (kusaka (1970)), and Hayashi et al. (hayashi (1985)), cf. Table 2. The nebula density structure is not a priori determined, but, for critical core mass determination, nebula densities agree with those from Kusaka et al. (kusaka (1970)) for and 30 AU, and from Hayashi (hayashi (1985)) for AU, cf. Table 2. It has been shown that the critical core mass values have only a weak dependence on the nebula density (cf. Sect. 3.9), therefore the choice of the nebula density is not critical.
2.3 Model Equations
The envelope is set in isothermal hydrostatic equilibrium, with
spherical symmetry, and as such is described by:
| (2) |
the equation of hydrostatic equilibrium:
| (3) |
and the equation of state for an ideal gas:
| (4) |
is defined as the total mass (core plus envelope) contained within the radius :
| (5) |
where is the radial distance measured from the core center and is the envelope gas density at radial distance .
2.4 Boundary Conditions
The total mass of the protoplanet is defined as:
| (6) |
with
| (7) |
The inner and outer radial boundaries are:
| (8) |
An additional boundary condition at the core surface is:
| (9) |
This model, together with the specified assumptions and boundary conditions, is sufficient to completely determine a single model-protoplanet. The total mass and nebula density at (gas density at protoplanet’s outer boundary) are results of the calculation.
|
-
†
SI units used unless otherwise specified
2.5 Solution Procedure
The total protoplanetary mass is obtained by integrating outward from to , starting with and iterating
.
Integration is performed from the core surface to the Hill radius,
using the Maple 6 software (e.g. Garvan garvan (2001)), with the
Fehlberg fourth-fifth order Runge-Kutta method.
3 Results
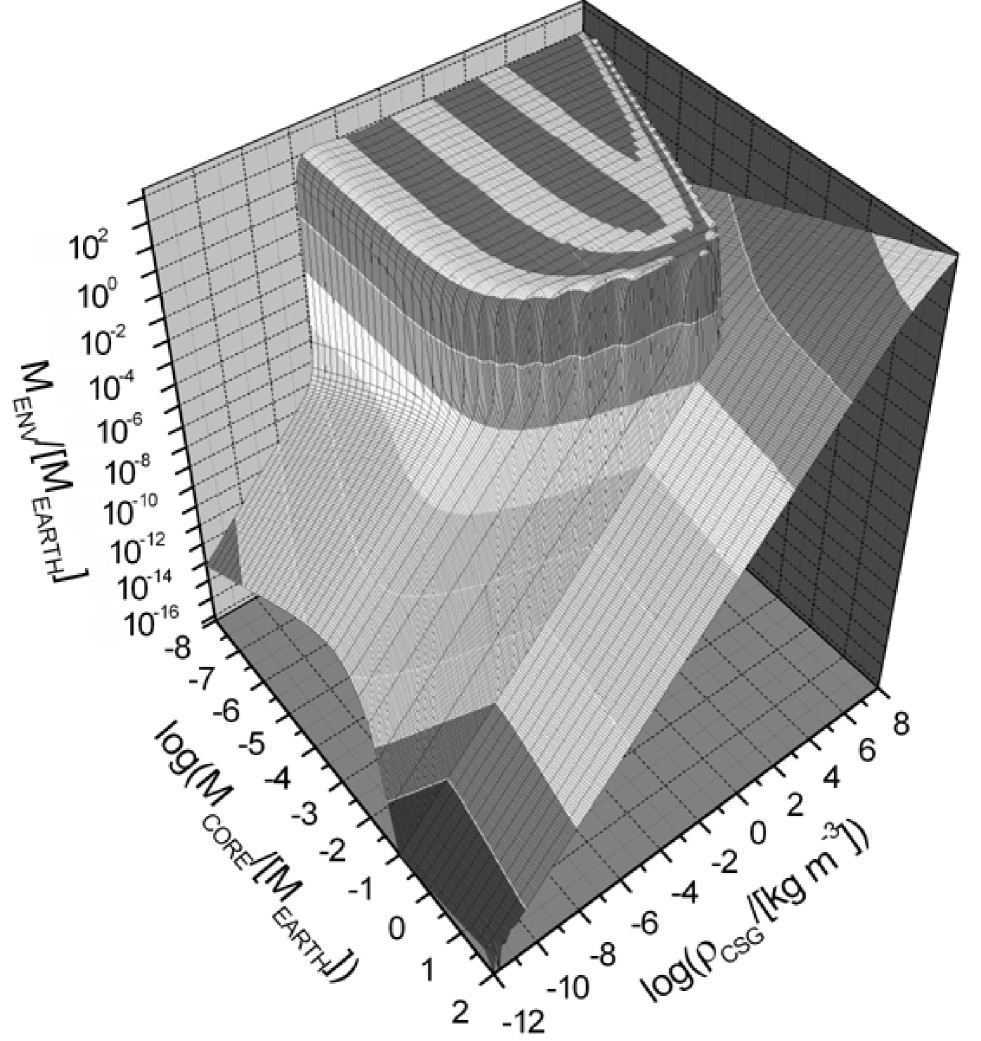
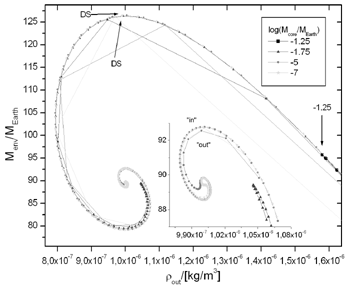
3.1 Solution Manifold
In order to cover as many hydrostatic solutions as possible, the system of equations (2), (3), and (4) is solved for a wide range of parameters and . The set of all solutions for this range constitutes the solution manifold. Figure 1 shows the solution manifold for a protoplanet whose orbital distance corresponds to the position of proto-Jupiter according to the Kyoto-model of solar system formation (Hayashi et al. hayashi (1985)). The manifolds with orbital parameters (, ) of proto-Neptune and proto-Earth have similar morphologies. It should be reiterated that the solution set contains all qualitatively different protoplanetary models at a particular orbital distance; not just for a particular nebula, but for any nebula, from a dense gravitationally-just-stable cloud to a near-vacuum space.
|
-
The critical core mass increases for smaller orbital distances because of (in order of importance): the higher gas temperature (cf. Sect. 3.8.1 and 3.10), the smaller Hill sphere (cf. Sect.3.8.2), and the higher densities of the reference nebulae (taken from the minimum mass solar nebula models of Kusaka (kusaka (1970)) and Hayashi (hayashi (1985))).
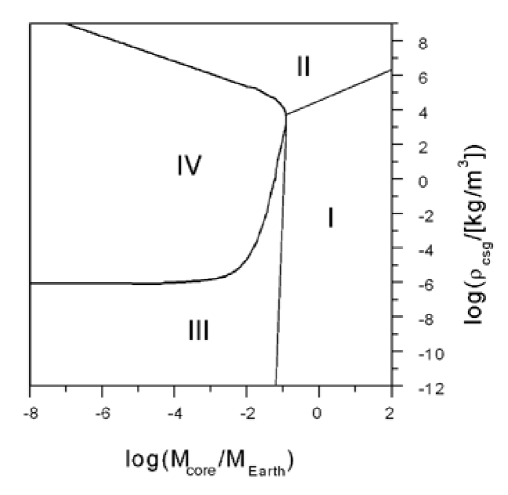
3.2 Manifold Regions
Several distinct regions exist in the parameter space of the
solution manifold (Fig. 2), and they can be
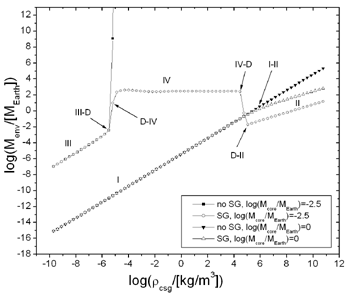
examined from two complementary perspectives. One way is to use
the gas density at the core surface, , as an
independent variable (e.g. Fig. 3), and the other
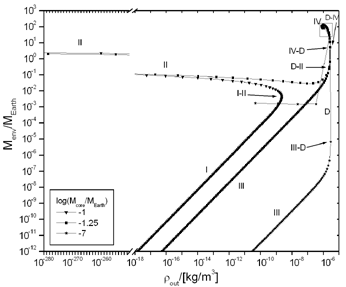
is to use the nebula gas density, (e.g.
Fig. 4). While is more
physically intuitive, maps out region IV of
Fig. 2 more clearly, and is more efficient in
terms of representing the entire manifold.
Figure 2 divides the solution manifold into
four distinct regions, depending on whether the solution is
compact or uniform and self-gravitating or not.
Figures 3 and 4 point to
the existence of the four possible regimes for a planet;
-
1.
‘mature telluric planet’ (region I): envelope mass is a linear function of , and
-
2.
‘mature giant planet’ (region II): envelope mass weakly drops with ().
is weaker than for the ‘nebula’ regime. ‘Nebula’ densities () are so low that they may well be considered a vacuum. -
3.
‘nebula’(region III): envelope mass is a linear function of and
-
4.
‘protoplanet’ (region IV): envelope mass is a non-trivial function of or
3.3 Self-Gravity Effect
The key effect, which is responsible for the manifold morphology
as observed in Fig. 1, can be described as
self-gravity of the protoplanet’s envelope. Keeping in mind the
hydrostatics of the model, and the fact that the surrounding
nebula is not prescribed, one can see that self-gravity
reduces the envelope mass for a given core surface pressure, i.e.
the envelope mass would be larger if there were no
self-gravitating
effect (Fig. 3).
The envelope’s radial gas density profile is shaped through the interplay of inward gravitational force and outward gas pressure. If the envelope mass is small compared to the core mass, the gravitational force can be approximated as arising from the core’s gravitational potential only. Once the envelope mass is comparable to (or greater than) the core mass, they both contribute to the gravitational potential, making its gradient steeper and, in effect, reducing the envelope mass. As a consequence, the self-gravitating envelope connects to a nebula different from the one which is in balance with the envelope in the absence of the self-gravitating effect. Further discussion of the role of self-gravity can be found in Sect. 3.5.
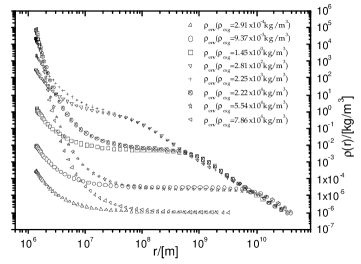
3.4 Two types of envelope equilibria
The solution manifold (Fig. 2) contains two basic types of envelope equilibria (Fig. 6):
-
1.
uniform, or quasi-homogenous envelope: the density of the envelope gas drops weakly with increasing radial distance, keeping the mass distribution more or less uniform throughout the envelope;
-
2.
condensed, or quasi-compact envelope: typically small, but very dense gas layer is wrapped around the core, at larger radii the gas density is very low;
This is reminiscent of a similar equilibrium, found by Stahl et
al. (stahl (1995)), for constant mass coreless ’Van
der Waals’ gas spheres.
If an envelope’s mass is much smaller than the core mass, the
radial profile of the gas density is simply an exponential
function, well approximated by :
| (10) |
If , then Eq. (10) reduces to the barometric formula.

3.5 Differences: Isothermal Coreless Gas Spheres vs. Isothermal Protoplanets
The curl in Figs. 4 and 5 is reminiscent of a similar feature found for the isothermal coreless ideal-gas spheres (e.g. Schwarzschild, schwarzschild (1957), Sect. ) represented in the U-V plane. It follows from the definition of U and V that:
| (11) |
| (12) |
and from the fact that the mean density of the total object for our model is always the same, as implicitly defined through Eq. (1).
Unlike a singular isothermal sphere with an infinite pressure at
the center, our protoplanetary model has a solid core of uniform
(and finite) density at its center. This will result in the
departure from the potential of the coreless isothermal sphere:
instead of having a structure, the
envelope
gas close to the core surface will obey the form of the barometric law (c.f. Eq. (10)).
If the mean envelope density at lower stratifications is
comparable to the core density, an ‘effective’ core will shorten
the characteristic length-scale of the potential, making the
exponential profile of the barometric-law-like profile even
steeper. For the appropriate effective core, the outer
stratifications will exactly match the outer stratifications of
the solution which has the gas density at the core surface much
smaller than the core density (cf. Fig. 14). These
profiles will connect to the same nebula density, but will have a
slightly different envelope mass, because of the difference in the
profile of the inner stratification. Therefore, the curl of
Fig. 5 will have two branches: ‘in’
(the solution with a
non-self-gravitating inner stratification) and ‘out’ (the solution with an effective core).
The smaller the core mass, the sooner will the profile connect to
the ‘’ structure; i.e. the smaller the difference in the
envelope mass between the pairs of solutions, the closer the ‘in’
and ‘out’ branches in Fig. 5 will be.
The fall-off of the gas density with increasing radius in the
self-gravitating part of the envelope can be approximated by
(cf. Fig. 6,
self-gravitating profile), as expected in the theory of stellar
structure for a self-gravitating isothermal sphere of ideal gas
(e.g. Shu shu (1992), Sect. ). Small deviations from
are due to the finite amount of mass needed for the envelope to
become self-gravitating, which produces a slight imbalance between
the self-gravity and the amount of
mass . No similar effect is observed for coreless, isothermal gas spheres (cf. Stahl et al, stahl (1995)).
Depending on the fraction of the self-gravitating part of the envelope and of the core mass, this wavelike
deviation can extend to the outer boundary, or can be attenuated deep within the envelope.
3.6 Estimating the Applicability of the Ideal Gas
We made two major assumptions while constructing our model - that the gas is ideal, and that the heat is instantaneously radiated away, i.e. the gas is isothermal. In Sect. 3.7 we examine the isothermal assumption, and we deal with the ideal gas in this section.
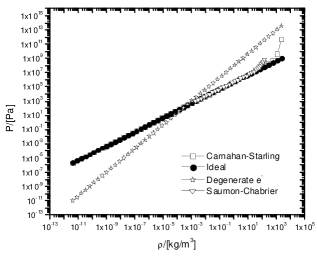
In order to keep the protoplanet in an equilibrium with the surrounding nebula, we have set the envelope gas temperature equal to the nebula temperature for the appropriate orbital distance. Therefore, we compare different equations of state at the envelope temperature. In addition to an ideal gas, we take the Saumon-Chabrier-van Horn (SCvH (1995)) EOS, the Carnahan-Starling (carnahan-starling (1969)) EOS, as well as a completely degenerate electron gas.
Figure 7 shows that for the gas densities up to about kg m-3, ideal gas, Saumon-Chabrier-van Horn, and Carnahan-Starling EOS agree to better than one percent. For higher densities the Saumon-Chabrier EOS shows additional non-ideal effects, while the Carnahan-Starling EOS exhibits a similar behavior for densities larger than kg m-3. We can also see that the electron degeneracy does not contribute to the pressure at least till the point where the Saumon-Chabrier EOS departs from ideal-gas behavior.
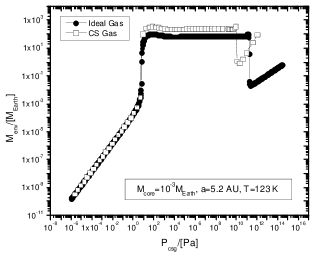
However, in general we see that the ideal gas is an excellent approximation for our model for the better part of the envelope gas density range. Certainly, there are also models where densities are high enough for significant non-ideal effects, but typically for the protoplanets in our model those high density envelope regions are restricted to areas close to the core, while the rest of the envelope will be well approximated by an ideal gas. We can see in Fig. 8 that if we use e.g. the Carnahan-Starling EOS, the numerical details will be changed, but the qualitative picture will remain the same. This is also true for the Saumon-Chabrier EOS, which is work in preparation by C. Broe.g. The ideal isothermal gas will not be a good approximation for the compact envelopes which are typically associated with giant planets in the late stages of their evolution. Using our model, we can show that a protoplanet will have a compact envelope under certain conditions. What we cannot do with this model is obtain a quantitatively correct picture of such a compact envelope.
Additionally, Fig. 14 shows why the choice of EOS is not critical for the qualitative picture: Although the non-ideal effects might change the density stratifications of the compact inner parts, each solution which is not self-gravitating in its inner (barometric-law like) part, will have a counterpart solution with an effective core. Properties of the effective core will be dictated by the EOS, but its effect on the scale-height will remain the same.
3.7 Estimating the Applicability of the Isothermal Assumption
In the previous section we showed that an ideal gas is a good approximation for most of the parameter range we use. The validity of the isothermal assumption is examined below.
By analogy with the pressure scale-height, a temperature scale-height of a radiative stratification can be defined as:
| (13) |
where
| (14) |
for an ideal gas and hydrostatic equilibrium, and
| (15) |
where is the radiation constant, is the gas opacity
taken to be , is the speed of light,
and is the core luminosity due to the planetesimal accretion
rate of .
The temperature scale-height corresponds to the length-scale of a radiative giant-protoplanet over which the
envelope temperature drops by a factor of 1/e. The specific temperature scale-height
evaluates the ratio of the thermal length-scale to the radial extent of the entire protoplanetary envelope, at a
position . Evaluated at , is the global estimate of the thermal
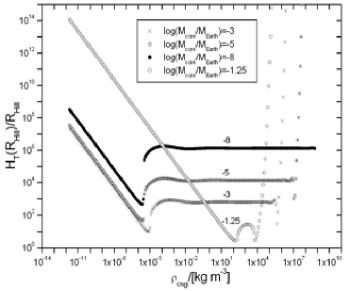
scale-height of the protoplanet. Figure 9 shows that the isothermal assumption is valid for large
portions of the manifold regions III and IV (cf. Fig. 2), where
has values much larger than unity. These envelopes have a specific thermal scale-height above unity for at least
the outer 90% of the envelope. Therefore, even though the small innermost envelope region is probably
non-isothermal, the protoplanet should be well represented by the isothermal gas.
Close to the giant-protoplanet’s critical core mass (e.g.
in Fig. 4),
is expected to be of order unity and the
isothermal assumption breaks down. Compact solutions (regions I
and II from Fig. 2, and high solutions in Fig. 9) have very large
, indicating that nearly-vacuum space around
the compact envelope is nearly isothermal. Detachment from a
protoplanetary nebula could represent either hydrodynamically
active protoplanets, or the collapsed gas giants with cleared
protoplanetary nebula (i.e. mature giant planets). In both cases
objects are expected to be deep in the non-isothermal regime. The
radial profiles of the compact objects will change if a detailed
energy transport is included, but they will nevertheless remain
compact. A comparison of Jupiter’s radius with that of our model
planet (of equivalent mass and of 5000 K, estimated
to be representative of Jupiter’s average temperature from Guillot
guillot (1999)) shows that, with m,
our model falls short by
less than 10% of reproducing the radius of the real gas giant.
In the context of Jupiter’s potentially rapid formation (order of
years), it could be argued that the core accretion
rate should be even higher. However, is
proportional to the inverse of , and even if
it is set to , the validity of the
isothermal assumption is still appropriate for the regions III and
IV of Fig. 2. Indeed, such high core accretion
rates are applicable for cores comparable to (i.e.
cores at late stages of a giant protoplanet’s evolution), and are
surely an overestimation for the younger cores (e.g. for the cores
of ), making the case for the isothermal
regime even more solid. However, because of the simplicity of our
model, the results are only qualitative, while quantitatively
correct values would only be accessible through a more elaborate model.
shows that close to the critical core mass there are non-isothermal effects.
But the basic isothermal picture is valid for most of (the
quasi-homogenous part of) the manifold. It even appears that the
possible transition from homogenous to compact state can be
initiated within the isothermal regime.
3.8 Manifolds and Environment
Manifold solutions are dependent on four environmental parameters:
the gas temperature of the protoplanet (and of the
surrounding-nebula), the orbital distance from the parent
star, the mean molecular weight , and the mass of the parent
star . These parameters influence the balance of the
two forces that determine the radial density structure - the
outward force arising from the gas pressure, and the inward force
of gravity; and are connected with pressure through
Eq. ( 4), while and
determine the Hill-sphere, i.e. the volume of the envelope mass.
Because of the simplicity of the model, the impacts of and
on the solutions will be discussed together, as will the
influence of and . In reality, these parameters
will have very different impact.
Unless otherwise specified, the reference parameters throughout the current section are: log()=-5, AU, , and .

3.8.1 Temperature and Mean Molecular Weight
Although this model is isothermal, the choice of gas
temperature influences the solution manifold quantitatively. From
Eq. (4) it is clear that pressure relates linearly to
temperature. Since the pressure force counterbalances the
gravitational force, protoplanets with hotter envelopes require
more gravity (and thus more mass) for a hydrostatic solution. The
value of the critical core mass is a good example of the
quantitative influence of the temperature. For example, the
critical core mass for a 123 K protoplanet in Jupiter’s
orbit is 0.0948 , while the critical core mass value for a 5000 K case is 24.5 .
Figure 10 shows that, for subcritical cores and
low gas densities at the core surface (region III in
Fig. 2), the gas temperature has virtually no
impact on the envelope mass. Since the envelope mass is small
compared to the core mass, the envelope parameters (e.g. ) have no influence on the hydrostatic force balance via
gravity feedback. On the contrary, for envelopes in which
self-gravity shapes the radial structure (regions IV and II in
Fig. 2), the envelope
mass is significantly affected by different .
The scaling law which relates manifolds of various temperatures is
discussed in Sect. 3.10.
As previously mentioned, this simple model does not incorporate an
energy transport equation, nor does it take into account the gas
and dust opacities. Therefore, a change in cannot be
distinguished from the corresponding change in , and will not
be further discussed.

3.8.2 Orbital Distance and Star Class
Orbital distance, together with the masses of
the protoplanet and the parent star determine the protoplanet’s
gravitational sphere of influence, the so called Hill-sphere.
Since the available volume for the protoplanet’s envelope scales
with the cube of the orbital distance (see
Eq. (1)), the strength of the envelope’s
self-gravitating effect depends critically on the distance from
the core to the parent star (see Fig. 11).
Therefore, for the inner protoplanets to have (at least partly)
self-gravitating envelopes, the gas density at the core surface
must be larger than for the corresponding
outer protoplanets.
For solutions with compact envelopes (right side of Fig. 11 and enlargement) the orbital
distance has no impact on the envelope mass, since the radii of the compact inner part are typically several
orders of magnitude smaller than their respective Hill-spheres.
The transition from a uniform self-gravitating to a compact
envelope is characterized by a considerable drop in the gas
density for the outer envelope stratifications. In addition,
protoplanets close to the parent star have relatively small
Hill-radii and most of the envelope mass can be found in the
proximity of the core. Therefore, the transition from uniform to
compact envelope for protoplanets close to the parent star is less
abrupt than for more
distant protoplanets, as can be seen in the enlargement of Fig. 11.
Varying the mass of the parent star is equivalent to changing the
orbital distance of the protoplanet, provided that the gas
temperature stays the same. It follows from Eq. (1)
that , e.g. changing the orbital
distance of the protoplanet from 5.2 AU to 1 AU is equivalent to
changing the mass of the parent star from to . It remains to be seen
whether this equivalence will hold for a more complex model,
because the nebula properties will likely change in accordance
with the known mass-luminosity relation as is varied.
3.9 Static Critical Core Mass
There are several definitions of the critical core mass currently
in use. The critical core mass concept has been introduced by
various investigators (e.g. Perri & Cameron (perri (1974)),
Mizuno et al. (miz78 (1978)), Mizuno (mizuno (1980)), Bodenheimer
& Pollack (boden86 (1986)), Wuchterl (1991a )). As a
starting point, we choose here a definition suggested by Wuchterl
(1991a ), for ’static critical core mass’: No more
static core-envelope
models with increasing core mass exist at the critical mass.
This definition is valid along a (time) sequence of protoplanetary models with increasing . It is
only along such a sequence, in the context of the static models, that a time evolution with growing cores can
proceed. Essentially, the static critical core mass is the largest core mass for a static protoplanet that can be
embedded in a given nebula, characterized by a nebula gas density, a temperature, and
a distance from a parent star.
For the ( AU and K) manifold this means that, among
the solutions with (defined for the minimum mass solar
nebula, e.g. Hayashi et al. hayashi (1985)), the solution with the
largest core mass determines the static critical mass
(Fig. 12, the innermost solid line). This gives a
static critical core mass of
.
Figure 12 shows that the value for the critical
core mass exhibits a generally weak dependence on the density of
the surrounding nebula, so the choice of
from different nebula models is
not critical. For the very dense nebulae (around ) and depending on the choice of the solution branch
(cf. Sect. 3.9.1), the values for the local critical
core masses can span several
orders of magnitude even for the same nebula.
The critical core masses for different manifolds are presented in
Table 2, and are found to depend on the
parameters that affect the hydrostatic balance (cf.
Sect. 3.8).
By comparing Figs. 1 and 2 it follows that the natural choice for the global static critical core mass, one which is valid for the whole manifold, should be the core of the protoplanet which is at the interface of all four manifold regions (cf. Fig. 2). The model at the interface has a minimum in the envelope mass, for a manifold cut along the constant value. The interface is also an inflection point for a manifold cut at a constant . The conditions for the global static critical core mass thus are:
|
|
(16) |
Since the numerical values for the global critical core masses are very close to the values of the critical core masses from the definition suggested by Wuchterl (1991a ), we do not present the global numerical values separately.
The values obtained for critical core masses in this model agree well with those of Sasaki (sasaki (1989)), who used a similar set of assumptions. However, such isothermal values are significantly smaller than today’s commonly accepted critical mass values, obtained with the inclusion of detailed energy transfer, which are typically between 7 and 15 . The reasons for this are two-fold. Firstly, we use the equation of state for an ideal gas. Secondly, the temperature of the isothermal gas is taken from nebula models, hence the nebula temperature is the temperature of the entire protoplanet. This is certainly a lower limit for a realistic temperature of the interior of the protoplanet. Larger critical core mass values are obtained if the gas temperature is in the range of the temperatures for the interior of gas giants modelled with detailed energy transfer (cf. Sect. 3.8.1). Clearly, the correct determination of the critical core mass requires temperature structure, but the emphasis in this work was not on quantitative details, but rather on global qualitative features.

3.9.1 Local Critical Core Mass
From Figs. 12 and 13 one can see that, for each subcritical core immersed in a nebula, there are at least two permitted solutions. However, if one considers only the time-sequence of hydrostatic models with a growing core, it is clear that solutions with higher density at the core surface cannot be reached.

The situation is more complicated if the protoplanet is embedded in a denser protoplanetary nebula. Our model clearly predicts multiple solutions for certain sets of parameters (Fig. 13). Instead of one solution branch for a given nebula (with two solutions for each core, as for a minimum mass solar nebula), several solution-branches are possible, again each with two solutions for a specific core (Fig. 12, dashed solution branches for ). Multiple solution-branches are enabled by envelope self-gravity (cf. Fig. 14) and are due to tidal restrictions imposed by the parent star via (cf. Fig. 3, region IV).
Each solution branch has one critical core mass, beyond which there is no static solution, for a sequence of hydrostatic models with increasing core mass. For the minimum mass solar nebula this means one critical core mass, according to the definition suggested by Wuchterl (1991a ). For some denser nebulae, however, the existence of several branches implies several local critical core masses, where solutions beyond the critical core mass of the branch are unavailable locally. After reaching the local critical core mass, the planet could, in principle, continue evolving by ’jumping’ to another branch. One of us has observed similar behavior for certain sets of initial parameters in hydrodynamical models. The local critical core mass satisfies the above definition but not Eq. (16) for the global critical core mass.
3.9.2 Double Maxima
A special case of multiple solutions can be seen in Figs. 5, 13, and 15 as double peaks in the envelope mass. For every (subcritical) core, two special solutions, which fit into the same nebula cloud (i.e. have the same and have almost exactly the same envelope mass (equal to one part in , or better), are found to exist. Usually these two solutions have a very similar stratification in the outer parts of the protoplanet’s envelope, but deep inside the protoplanet their radial structure is quite different (cf. Sect. 3.5).
Supercritical cores do not posses such a feature, because the density profile always effectively goes to zero long before the Hill radius is reached. Therefore there is no significant contribution to the envelope mass in the outer stratifications, and the envelope mass increases monotonically with the gas density at the core surface (cf. Fig. 3).

Envelopes with lower gas density at the core surface,
, (Fig. 15) have a
maximum possible mass (for the corresponding manifold) because the
envelope gas density at the core surface is low enough to ensure
uniformity for the major part of the radial structure.
Consequently, the envelope density does not substantially decrease
from the core-surface value. At the same time, is high enough to allow significant mass contributions
from the outer parts of the envelope, where the volume (and
therefore the mass, for a given density) per unit radius, is the
largest. Values for such maximum envelope masses are
tabulated in Table 2.
Envelopes with higher build up
the self-gravitating effect (SG effect starts as soon as
) very close to their core.
Because of the very strong self-gravitating effect
( for the innermost regions),
the
radial density fall-off close to the core (Fig. 15) is strong.
A new, effective core is formed from the dense
envelope-gas-layer wrapped tightly around the core. In this case,
the envelope density distribution resembles one with the core (and
the radius) of this effective core. In stratifications where the
envelope mass becomes comparable to the effective core, another
self-gravitating effect changes the radial envelope density
distribution to
.
For a particular choice of , the
envelope density profile in the outer stratifications matches that
of , thus making the mass of both
envelopes almost equal.
3.10 Temperature-Mass Invariance
It has been noted that, if mass and distance are measured in a system of appropriate units (i.e. mass in units of core mass, and distance in units of core radii), solution manifolds with different temperatures are almost identical, except for a shifting on a core-mass-axis, according to the relation:
| (17) |
that can be derived for homologous envelopes satisfying
, for
any pair of and such that . In other words, the radial profile of
a certain protoplanet with core mass and temperature
will be the same as the radial profile of another protoplanet with
core mass and temperature , if
Eq. (17) is obeyed, and if the mass is measured
in units of core mass and the length in units of core radius.
This is true for all manifold regions, sub- and super-critical,
self-gravitating or not. Note that in Fig. 10
the non-self-gravitating region was not affected by a change in
envelope temperature, but relation (17) does
hold even for non-self-gravitating envelopes, since it connects
envelopes with different temperatures and core masses.
Fig. 10 was plotted for different temperatures,
but constant core mass.
4 Discussion and Conclusions
In an effort to obtain a global overview of hydrostatic protoplanetary equilibria, we have chosen a simple physical model so as to be able to clearly understand the interaction of competing processes.
Our use of relatively simple physics has several consequences; because the ideal gas equation of state is used, gas particles are ‘soft’, and can be compressed as much as is needed, in effect overestimating the importance of gravity relative to gas pressure, when large envelope-gas-pressure is applied. A comparison of the ideal gas EOS to the numerical Saumon-Chabrier EOS shows disagreement for the isotherm and densities above . This would indicate that the non-ideal EOS is needed for high-density effective cores.
It has been noted that manifold properties are insensitive to variation of orbital distance or mass of the parent star , as long as holds (cf. Sect. 3.8.2). Also, solutions whose envelope temperature and core mass obey relation (17) are found to be the same, if appropriate units for mass (i.e. core mass) and length (i.e. core radius) are used. This indicates the existence of analytic solutions for some envelope regimes, through certain dimensionless scaling variables. Such a treatment is, however, out of the scope of the present paper.
An envelope gas temperature is equal to the nebula throughout the protoplanet, and that certainly underestimates the thermal pressure and hence reduces the values for the critical core mass. However, from Equ. 17, one can show that for a more realistic estimate of the envelope temperature representative for the young planets (5000 K) critical core mass values are overestimated (), because of envelope isothermality/lack of an energy transport equation and use of ideal-gas EOS, when compared to canonical critical core mass values from protoplanetary models with detailed microphysics.
Both the local and the global critical core masses signal the end of the availability of the hydrostatic solutions. In the case of the local critical core mass, non-availability holds for a small region of the parameter space around the local critical core mass, while for the global critical core mass this is true for every core larger than the critical core mass. The significant difference between the two types of critical core mass is that, at the global critical core mass (and above), the non-isothermal effects are crucial in shaping the structure of the protoplanetary envelopes, and are present throughout the parameter space. These non-isothermal effects are important for determining the details of the dynamical disk-planet interaction.
The critical core mass values obtained in this model are almost two orders of magnitude smaller than the canonical critical core masses which incorporate detailed energy transfer. Thus, if subcritical or just-critical regimes of a dynamical disk-planet interaction are to be investigated through a model that is locally isothermal, the planet mass should be set appropriately. Most of the present locally-isothermal disk-planet models (e.g. Kley kley (1999), D’Angelo et al. dangelo02 (2002), dangelo03 (2003), Nelson & Papaloizou nelson04 (2004)) operate with planets which should be deep in the super-critical regime.
A solution set from our model encompasses solutions that are reminiscent of the planets in the various stages of evolution (from small rocks embedded in the dilute nebula to the mature planets as we know them), and of various configurations (the telluric planets of region I in Fig. 2, and the gas giants of region II). The ’nebula’ and ’mature planet’ regimes are the physically intuitive beginning and end phase of planetary evolution. However, the ’protoplanet’ regime presents us with an interesting region in parameter space, where planets could make the transition from ’infancy’ to ’maturity’. Depending on the detailed structure and the dynamics of the surrounding nebula, it is easy to conceive a standard scenario of planet formation. That is, the accretion of nebula gas onto a supercritical protoplanet. Other scenarios could be imagined as well, e.g. a massive protoplanet could release a major part of its envelope to reach the appropriate equilibrium, or it could dramatically condense its otherwise mostly gaseous envelope. Amounts of dust in the environment will doubtless play a very important role in the process.
In conclusion, several important features of the solution set have to be mentioned:
-
1.
Two basic types of the envelope equilibria are found for protoplanets:
uniform; the density of the envelope gas drops weakly from the core to the outer boundary
compact; a dense gas layer forming an effective core, and a very low, exponentially decreasing, gas density further out
Both types can be self-gravitating or non-self-gravitating, dividing the solution manifold into four distinct regions. -
2.
As a consequence of the envelope’s self-gravitating effect, a wide range of possible envelope solutions exists.
-
3.
We have developed a new concept for the global static critical core mass, which marks the contact point of all four qualitatively different types of protoplanets. This concept is based on a qualitative change of the envelope properties while considering a complete set of available solutions (a solution manifold), as opposed to the critical core mass definitions which are valid only for a solution subset fitting a particular nebula.
-
4.
For every subcritical core there are at least two envelope solutions possible (a self-gravitating one and a non-self-gravitating one) for a given nebula, and for a certain nebula parameters the number of the possible envelope solutions can be even larger. Such nebulae also have multiple (local) critical core masses.
-
5.
The global static critical core mass value is shown to decrease with the increasing orbital distance , mainly because of the decrease in the temperature of the surrounding nebula.
References
- (1) Bodenheimer, P., & Pollack, J. B. 1986, Icarus, 67, 391-408
- (2) Bodenheimer, P., Hubickyj, O., & Lissauer, J. J. 2000, Icarus, 143, 2
- (3) Carnahan, N. F & Starling, K. E. 1969, J. Chem. Phys. 51, 635-636
- (4) D’Angelo, G., T. Henning and W. Kley 2002, Astron. Astroph. 385, 647
- (5) D’Angelo, G., W. Kley and T. Henning 2003, Astroph. Journ. 586, 540
- (6) Garvan, F. 2001, The Maple Book (Chapman & Hall)
- (7) Guillot, T. 1999, Science, 286, 72-77
- (8) Hayashi, C., Nakazawa, K., & Nakagawa, Y. 1985, Protostars and Planets II, 1100
- (9) Ikoma, M., Emori, H., & Nakazawa, K. 2001, Aph. J., 553, 999-1005
- (10) Kippenhahn, R. & Weigert, A. 1991, Stellar Structure and Evolution (Springer-Verlag)
- (11) Kley, W. 1999, MNRAS, 303, 696
- (12) Kusaka, T., Nakano, T., & Hayashi, C. 1970, Prog. Theor. Phys., 44, 1580-1596
- (13) Mizuno, H., Nakazawa K., & Hayashi, C. 1978, Prog. Theor. Phys., 60, 699-710
- (14) Mizuno, H. 1980, Prog. Theor. Phys., 64, 544-557
- (15) Nelson, R. P. & Papaloizou, J. C. B. 2004, MNRAS, 350-3, 849-864
- (16) Perri, F., & Cameron, A. G. W. 1974, Icarus 22, 416-425
- (17) Sasaki, S. 1989, Astron. Astrophys., 215, 177-180
- (18) Shu, F. H. 1992, The Physics of Astrophysics, Volume II, University Science Books
- (19) Saumon, D., Chabrier, G., & van Horn, H. M. 1995, ApJS, 99, 713
- (20) Stahl, B., Kiessling, M. K-H., & Schindler, K. 1995, Planet. Space Sci., 43, 271-282
- (21) Stevenson, D. J. 1982, Planet. Space Sci., Vol. 30, No. 8, 755-764
- (22) Schwarzschild, M. 1957, Structure and Evolution of the Stars, Princeton University Press
- (23) Wuchterl, G. 1991a, Icarus, 91, 39-52
- (24) Wuchterl, G. 1991b, Icarus, 91, 53-64
- (25) Wuchterl, G. 1993, Icarus, 106, 323-334
- (26) Wuchterl, G., Guillot, T., & Lissauer, J. J. 2000, Protostars and Planets IV, 1081