Multi-wavelength observations of the 2002 outburst of GX 339–4:
two patterns of X-ray–optical/near-infrared behavior
Abstract
We report on quasi-simultaneous Rossi X-ray Timing Explorer and optical/near-infrared (nIR) observations of the black hole candidate X-ray transient GX 339–4. Our observations were made over a time span of more than eight months in 2002 and cover the initial rise and transition from a hard to a soft spectral state in X-rays. Two distinct patterns of correlated X-ray–optical/nIR behavior were found. During the hard state the optical/nIR and X-ray fluxes correlated well, with a nIR vs. X-ray flux power-law slope similar to that of the correlation found between X-ray and radio fluxes in previous studies of GX 339–4 and other black hole binaries. As the source went through an intermediate state the optical/nIR fluxes decreased rapidly and once it had entered the spectrally soft state, the optical/nIR spectrum of GX 339–4 was much bluer and the ratio of X-ray to nIR flux was higher by a factor of more than 10 compared to the hard state. In the spectrally soft state changes in the nIR preceded those in the soft X-rays by more than two weeks, indicating a disk origin of the nIR emission, and providing a measure of the viscous time scale. A sudden onset of nIR flaring of 0.5 magnitudes on a time scale of a day was also observed during this period. We present spectral energy distributions, including radio data, and discuss possible sources for the optical/nIR emission. We conclude that in the hard state this emission probably originates in the optically thin part of a jet and that in none of the X-ray states X-ray reprocessing is the dominant source of optical/nIR emission. Finally, comparing the light curves from the ASM and PCA instruments, we find that the X-ray/nIR delay depends critically on the sensitivity of the X-ray detector, with the delay inferred from the PCA (if present at all) being a factor of 3-6 times shorter than the delay inferred from the ASM; this may be important in interpreting previously reported X-ray-optical/nIR lags.
Subject headings:
accretion, accretion disks — binaries (including multiple): close — black hole physics — ISM: jets and outflows — stars: individual (GX 339–4) — X-rays: stars1. Introduction
Optical radiation from low-mass X-ray binaries is often attributed to thermal emission from the outer accretion disk or companion star (see e.g. van Paradijs & McClintock, 1995), either as the result of internal heating or reprocessing of X-rays from the central source. Strong observational evidence for reprocessing in neutron star systems is provided by the optical counterparts of type-I X-ray bursts (see e.g. McClintock et al., 1979; Matsuoka et al., 1984). Both their magnitude and time lag with respect to the X-ray peak (which is on the order of seconds) are in line with what is expected for reprocessing in the outer disk. In black hole systems, however, the larger accretion disks may be able to account for most of the optical radiation. Evidence for reprocessing is not as direct; type-I X-ray bursts are not present and often special techniques (e.g. O’Brien et al., 2002) are required to search for the effects of X-ray reprocessing. Based on the correlations between the X-ray, Hα, and optical continuum emission, Hynes et al. (2004) found evidence of reprocessing in V404 Cyg. In XTE J1118+480 the detection of the Balmer jump (McClintock et al., 2001) argues for direct disk emission, but detection of rapid UV, optical, and infrared variability cannot be explained by disk emission (either direct or as the result of reprocessing). Fast optical variability has also been observed in GX 339-4 (Motch et al., 1982, 1983) and it has been suggested that such variability in the optical flux of black hole binaries has to be due to a process other than thermal emission, e.g. cyclotron or synchrotron emission (see e.g. Fabian et al., 1982; Merloni et al., 2000; Kanbach et al., 2001; Hynes et al., 2003a).
Black hole soft X-ray transients (SXTs) (Tanaka & Lewin, 1995; Chen et al., 1997; McClintock & Remillard, 2003) provide an excellent opportunity to investigate the importance of irradiation and non-thermal processes to the optical spectra of X-ray binaries. These systems spend most of their time in quiescence, but occasionally they show outbursts as the result of a dramatic increase in mass accretion rate. During these phases, SXTs brighten by many orders of magnitude at almost all wavelengths. X-ray monitoring during outbursts has revealed a rich behavior that is usually described in terms of distinct phenomenological X-ray states and the transitions between them. The nomenclature of these states has undergone many and, at times, confusing changes in the past. Our understanding of black hole state is still evolving and in order to avoid the risk of using a classification scheme that may soon be outdated, we opt for a very simplified nomenclature in this paper. We recognize only three states, based on the slope of the spectral power-law index and the presence/strength of band-limited noise in the power spectrum. These states are: 1) a spectrally hard state, in which the spectrum is dominated by a power-law component with photon index 1.3-1.5 and the spectrum is dominated by strong (20–40 % rms) band-limited (flat-topped) noise, 2) an spectrally intermediate state, in which the power-law index varies between 1.5 and 2.5 and the band-limited noise and QPOs increase in frequency and decrease in strength (10–20 % rms) with photon index 3) a spectrally soft state, in which the spectrum is dominated by a thermal component, the power-law index is 2.5 or higher, and the power spectrum does not show strong band limited noise, but relatively weak red noise, with or without QPOs. Our definition of the spectrally soft state includes observations that would be classified as steep power-law state or thermal-dominant state by McClintock & Remillard (2003), but for this paper we do not distinguish between these states, as they turn out to have very similar optical/nIR properties. It is important to realize that the criteria summarized above are merely guidelines. One usually needs to study an entire outburst to identify groups of distinct behavior before individual observations can be classified. A full characterization of the states in GX 339–4 is going to be addressed in Homan et al. (2004) and Belloni et al. (2004); a full description of states is not relevant to this paper. Here it is enough that to distinguish the hard and intermediate states from the others.
The observed changes in the spectral and variability properties between the X-ray states suggests that the geometry of the inner accretion flow evolves considerably from one state to the other. The efficiency of irradiation of the disk (and companion star) is probably affected by such changes in the geometry; e.g., a spherical geometry, such as a compact corona, emits radiation more isotropically than the (presumably) flat inner parts of a thin accretion disk. Also, radio observations indicate that in the hard, and intermediate states a strong outflow is often present (Fender, 2003), which may contribute to the infrared, optical and X-ray fluxes (Markoff et al., 2001). Significant spectral changes are therefore expected to occur and are, in fact, observed in the optical/nIR (see e.g. Motch et al., 1985; Jain et al., 2001a) as the source moves from one state to another. These changes can be used to distinguish the different mechanisms responsible for the optical/nIR as well as to constrain models for the accretion flow geometry in the different X-ray states.
In this paper we present (quasi-)simultaneous X-ray and optical/nIR observations of the black hole SXT GX 339–4. This source was discovered with -7 in 1972 (Markert et al., 1973) and an optical counterpart was identified by Doxsey et al. (1979). Since then it has undergone several outbursts during which it was observed in all states at X-ray, optical/nIR, and radio wavelengths (see references in Liu et al., 2001). It is an easy target to observe in optical and infrared bands with an of 15.4–20. A mass function of 5.80.5 M⊙ was established by Hynes et al. (2003b) strongly supporting the black hole classification of the primary. Optical observations of GX 339–4 in 1981 (Motch et al., 1982, 1983) revealed fast variations and even a 20 s QPO which were interpreted by Fabian et al. (1982) as varying cyclotron emission from a very hot gas. Motch et al. (1985) report a sudden decline in the -band magnitude as the source made a transition from the a spectrally hard to a spectrally soft X-ray state, after which an anti-correlation was observed between and the 3–6 keV flux. They were able to fit the hard state spectral energy distribution (SED) of the source from the infrared (14) to X-rays (19) with a single power-law, while the soft state SED showed strong deviations from a single power-law. On the basis of this they suggested that different optical emission mechanisms operate in the two X-ray states. Their hard state SED is of particular interest as it has recently been suggested that the in the hard state the SED may be dominated from radio to X-ray wavelengths by emission from a jet outflow (Markoff et al., 2001, 2003).
Monitoring of GX 339–4 in the hard state revealed that radio and X-ray fluxes correlate over more than three decades of X-ray flux over a four year time period (Corbel et al., 2003). This correlation extends to other SXTs (Gallo et al., 2003) and even AGN (Merloni et al., 2003; Falcke et al., 2003). Here we show that a similar correlation is present during the 2002 hard state of GX 339–4 between optical/nIR and X-rays over a similar range in X-ray flux. The observations discussed here were performed during the rise of an outburst that started early April 2002 (Smith et al., 2002b; Belloni et al., 2002; Fender et al., 2002; Belloni et al., 2004). Thanks to an extensive monitoring campaign (by David Smith and co-workers) with the Rossi X-ray Timing Explorer (RXTE ) we were able to follow the source in X-rays from quiescence to the peak of the outburst. A similar optical/nIR monitoring campaign was started just before the outburst, which resulted in an excellent X-ray–optical/nIR dataset of a black hole X-ray transient during the early phases of an outburst. We give an overview of our data in §2 and present our analysis and results in §3. Possible interpretations of the observed behavior are discussed in §4. Conclusions and a summary are presented in §5.
2. Observations and Data Reduction
2.1. Optical and Infrared Photometry
Optical photometry of GX 339–4 was taken between UT 2002 February 10 – May 29 (MJD 52315–52423) on a daily basis when possible. Near-infrared photometry was obtained between UT 2002 January 21 – September 24 (MJD 52295–52541). Observations in the optical ceased earlier than near-infrared due to the failure of the optical CCD. Observations were made with the YALO111Yale, AURA, Lisbon, Ohio consortium, http://www.astronomy.ohio-state.edu/YALO/. YALO is now superseded by SMARTS (Small and Medium Aperture Research Telescope System), http://www.astro.yale.edu/smarts/, which currently uses ANDICAM on the 1.3m CTIO telescope. 1.0m telescope at CTIO using the ANDICAM222http://www.astronomy.ohio-state.edu/ANDICAM/ camera. ANDICAM takes simultaneous optical and infrared images over a variety of band-passes. In our observations we used Johnson -, - and CIT -band filters.
Exposure times for the optical images were 240 sec in and 200 sec
in . Optical images were bias subtracted and flat-fielded using
CCDPROC in IRAF. Photometry was performed using DAOPHOT in IRAF. In the -band we obtained nine images of
50 sec each. Each set of nine images were reduced using an in-house
IRAF script which flat-fields, sky subtracts, shifts and
combines each set of images. Photometry of the combined images was
performed using DAOPHOT in IRAF. The errors shown on the
data points are those obtained with DAOPHOT. The photometry
was calibrated using the standard stars T PheD
(optical, Landolt, 1992) and P9103333Persson faint infrared
standards,
http://www.ctio.noao.edu/instruments/ir_instruments/ir_standards/hst.html
(infrared).
2.2. X-ray observations
The X-ray observations were performed with the Proportional Counter Array (PCA; Zhang et al., 1993; Jahoda et al., 1996) and the High Energy X-ray Timing Experiment (HEXTE; Gruber et al., 1996; Rothschild et al., 1998) on-board the Rossi X-ray Timing Explorer (RXTE; Bradt et al., 1993). We analyzed data taken between UT 2001 March 6 (MJD 51974) and UT 2002 October 13 (MJD 52560), corresponding to a total of 137 pointed observations (excluding one which was only 48 seconds long). The exposure times for the individual observations range from 400 to 18000 s, with the observations before MJD 52360 all being shorter than 1300 s. Only data from Proportional Counter Unit 2 (PCU2) were used for the analysis in this paper, as it is the only detector that was operational during all observations and is the best calibrated detector of the 5 PCUs. From HEXTE we only used cluster A data.
PCA spectra were produced from the standard 2 mode data, which has a time resolution of 16 s and covers the 2–60 keV range with 129 channels. HEXTE spectra were created from the standard mode Archive data which has a nominal 32 s time resolution and covers the 10–250 keV range with 64 channels. Spectra were produced for each observation using FTOOLS V5.2. All spectra were background subtracted and dead-time corrected. A systematic error of 0.6% was added to the PCA spectra, which is a common practice. The PCA (3–25 keV) and HEXTE (20–150 keV) spectra of each observation were fit simultaneously in XSPEC (Arnaud, 1996, V11.2) using an overall normalizing constant that was allowed to float for cross-calibration purposes. We used the following combination of models: a (cut-off) power-law (cutoffpl or powerlaw), a multi-temperature thermal model (diskbb - hereafter referred to as the ’disk’ component, see e.g. Mitsuda et al., 1984), a relativistically smeared emission line around 6.5 keV (laor), a smeared absorption edge (smedge), and an absorption component (phabs). We also added an edge (edge) at 4.79 keV with optical depth to correct for an instrumental Xe edge at this energy in the PCA spectra. was fixed to a value of atoms cm-2 (Kong et al., 2000). This model led, on average, to values of that were slightly smaller than 1. Note that in the early phase of the outburst the disk component, the emission line and the smeared edge were not significantly detected and therefore removed from our fit model. Also, when the source was not significantly detected with HEXTE, fits were made to the PCA spectrum only. Unabsorbed fluxes were measured in the 3–100 keV range. If no fits were made to the HEXTE spectra, the fit to the PCA spectrum was extrapolated. A more detailed description of the spectral (and variability) analysis and a complete overview of the fit results of the whole outburst will be presented elsewhere.
3. Results
3.1. X-ray light curves
In Figure 1a we show three X-ray light curves of GX 339–4 during the first half of its 2002/2003 outburst: the total flux (solid line), the flux of the (cut-off) power-law (dashed line), and the disk black-body flux (dotted line), all in the 3–100 keV band. The first significant detection () of the source with the RXTE/PCA was made on MJD 52324 (marked by the upward arrow), although the outburst likely started before this date. For comparison we have also marked the date of the first detection with the RXTE/ASM, on MJD 52365, by the downward arrow. Had the source not been monitored with the RXTE/PCA we would not only have missed out on more than 40 days of valuable X-ray data, but we would also have miscalculated the true delay between the X-ray and optical/nIR rise. Extrapolation of the light curve around the time of the first ASM detection back to zero flux (based either on PCA or ASM data) resulted in an earlier start (15–25 days earlier), but still considerably later than the first PCA detection. The presence of an initial slow rise, as observed with the PCA, shows that the start times obtained from such extrapolations should be interpreted with some care. For the same reason we do not use the first significant PCA observations to obtain a ’improved’ start time; we simply do not know the shape of the light curve below our detection limit.
The dashed-dotted horizontal line Figure 1a indicates the average flux measured in the 8 observations prior to MJD 52324. This flux level (a significant detection of 1.4 x 10⁻¹¹ erg scm-2) is about a factor of 10 higher than the lowest values observed during quiescence (in September 2000 by Corbel et al., 2003), but probably represents the confusion limit for the PCA (R. Remillard, private communication). If so, this indicates that we may have missed a considerable part of the rise due to the limited sensitivity of the PCA compared to the X-ray imaging instruments (BeppoSAX and XMM-Newton) that were used for the observations in quiescence. The rise of the outburst was initially slow, with an increase in 25 days by a factor of 6 with respect to the level in the 55 days before MJD 52324. The next 30 days saw a dramatic increase by a factor of more than 350 in flux. After MJD 52380 the rate of increase slowed down considerably with the source entering a broad maximum for about 20 days during which it reached a maximum flux of 3.25 x 10⁻⁸ erg scm-2.
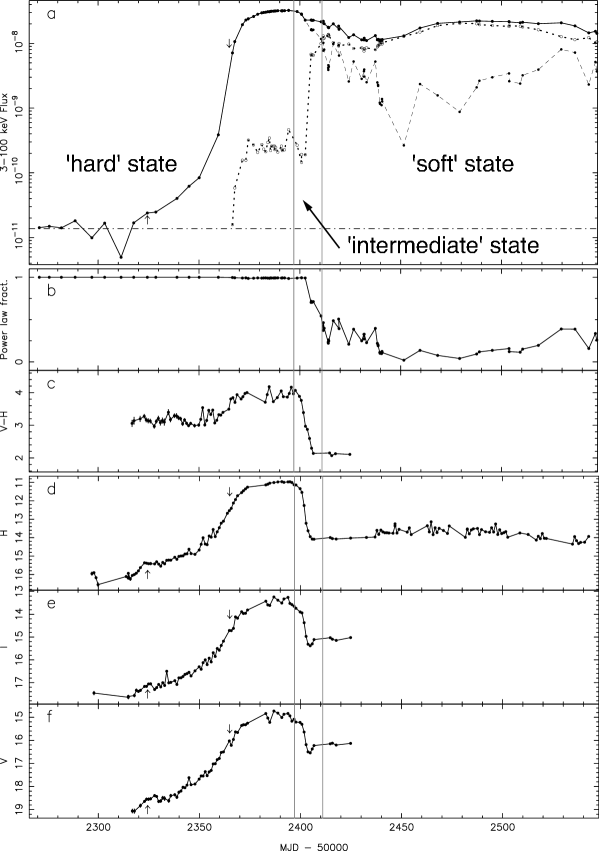
Before MJD 52405 the contribution of the disk component to the X-ray spectrum was very small, with the power-law component contributing close to 100% of the 3–100 keV flux, as can be seen in Figure 1b. No disk component was detected before MJD 52366, after which we measured values that were typically 1% of the total flux. This changed dramatically on MJD 52405 when the disk flux had increased by a factor of more than 35 compared to the previous observation, three days earlier. This day also marked a change of behavior in the power-law flux which, until then, had shown only smooth day-to-day variations, but suddenly showed erratic changes on top of a steady decline. Although the power-law fraction (Fig. 1b) suggests that the X-ray spectrum did not change considerably before MJD 52405, X-ray color curves (Belloni et al., 2004; Homan et al., 2004) indicate that spectral changes already started before MJD 52400. It is interesting to see that, like the power-law flux, the disk flux showed a decline for about 25 days after it reached a local maximum on MJD 52414. After MJD 52438 the source entered a long period in which the disk component contributed more than 75% of the 3–100 keV flux, showing a slow increase followed by a similarly slow decrease. During this period the power-law flux showed large variations. It should be noted, however, that it was in general hard to constrain the high energy part of the spectrum in this part of the outburst, because of the low number of counts.
3.1.1 X-ray states
Based on the definitions of the X-ray states given in §1 we can attempt to (preliminary) classify the X-ray observations. The period until MJD 52398 can be classified as a hard state; the power spectrum was dominated by a power law component with an index of 1.3–1.4. As the luminosity increased the power-law component showed minor steepening. This steepening accelerated around MJD 52398, which is the day where we put the transition to the intermediate state. In addition to the rapid steepening of the power-law component to an index of 2.5 we also observed accelerated changes in the QPO frequencies (Belloni et al., 2004) during the intermediate state. Note that the exact date of the transition from the hard state to intermediate state is to some extent arbitrary as many of the properties show a smooth evolution across the transition. However, the date of MJD 52398 is chosen also because it marks a clear change in the optical and nIR properties of the source (see §3.2 and §3.3) and in the hardness-intensity diagram (Belloni et al., 2004). The intermediate state ended on MJD 52410. On that day the power spectrum showed strong band-limited noise, while on the next day (and some of the following days) we detected red noise and type B QPOs (Belloni et al., 2004). Note that during the intermediate state, on MJD 52402, the disk flux showed a dramatic increase, without substantially changing or interrupting the evolution of the power-law index and type C QPO frequencies (see Wijnands et al., 1999; Remillard et al., 2002, for a definition if QPO types). From MJD 52411 onward the source showed several types of power spectra, but the spectra were in general much softer (see Fig. 1b) and the variability weaker than before that time. We classify all these observations as the spectrally soft state, ignoring for the moment the significant changes in the variability properties within that state. The approximate times of the hard/intermediate state and intermediate/soft state transitions are indicated by the vertical lines in Fig. 1.
3.2. Optical/nIR light curves
The outburst in the optical/nIR (Fig. 1d–f) started around MJD 52317, a week before our first significant detection in X-rays. We note, however, that this start is also consistent with zero delay between X-rays and the optical/nIR (see also §3.3), as the first PCA detection does not necessarily represent the true start of the outburst in X-rays. Between MJD 52296–52300 the -band light curve indicates the possibility of a dip before the outburst. It is difficult to place any constraints on this, however, due to the lack of data during this time. After MJD 52317, when the source was in the hard state, the optical/nIR light curves all showed a profile similar to that of the X-ray flux; an initially slow increase followed by a faster rise that evolved into a broad maximum. While the optical/nIR color (Fig.1c) remained at the same level for the first 35 days of the outburst, a clear reddening was observed around MJD 52360.
Similar to the X rays, the optical/nIR fluxes started decreasing as the source entered the intermediate state. After an initially slow decline the optical/nIR light curves decreased dramatically around 52400 by more than 3 mag in , more than 2 mag in , and almost 2 mag in , all within 5 days. During this short phase the V-H dropped from 4 to 2, indicating the spectrum became much bluer. By comparison, the decay in X-rays was much slower than in the optical/nIR, with a time scale of 30–40 days. After the fast decline a short dip (3–4 days) was observed in the I- and V- bands, but not in the H-band. After this dip the optical/nIR remained more or less constant.
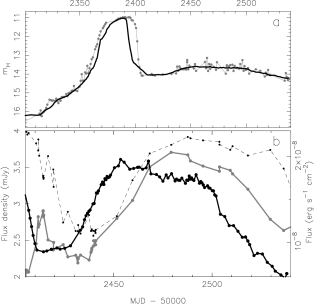
A few days before the disk component started to dominate the X-ray spectrum two changes occurred in the -band light curve (see Fig. 2a). First, the source brightened by about half a magnitude and, second, there was a sudden onset of variability. The variations had an amplitude of and a typical time scale of a day (although our sampling does not exclude faster variations). They were were not observed in one or more of our three reference stars, hence they are intrinsic to GX 339–4. Also, the apparent lack of variability in -band between MJD 52410–52435 can not be explained by the sparser sampling of the source during that period. By randomly removing points from the light curve in order to obtain a similar sampling as that between MJD 52410–52435, we were not able to hide the large variation observed after MJD 52435. Note that while the onset of flaring nearly coincided with the disk component becoming the dominant X-ray spectral feature, the flaring remained present when the power-law component became more prominent again, at the end of our data set. Unfortunately no observations were made in the V- and I-bands during the flaring period, so it is not known whether similar variations were also present in the optical.
To get a better idea of the long-term changes in the H-band during the flaring period we calculated a 20 day running average of the total H-band light curve (running averages with 15–25 day intervals produced similar results). In addition to the first peak around MJD 52390, the smoothed curve (Fig. 2a) shows a second broad maximum that peaks around MJD 52450. In Fig. 2b we compare this second -band maximum with the total and disk X-ray fluxes from the same period. Note the change from a magnitude scale in Fig. 2a to a (linear) flux density scale in Fig. 2b. In X-rays the source reached a peak well after that in the H-band with a delay of 15–20 days. By actually shifting the light curves in time with respect to each other, we find that they overlap best with a shift of about 18 days.


3.3. X-ray–optical/nIR correlations
From Figure 1 it is clear that in the hard state the profiles of the optical/nIR light curves are similar to that of the power-law flux light curve. In the spectrally soft state, however, the nIR light curve is much more similar to that of the disk flux, with a much lower IR/X-ray ratio than in the hard state. The intermediate state seems to represent the transition between these two types of behavior. To illustrate this, we show a plot of H-band flux density versus total X-ray flux in Figure 3a. The H-band magnitudes were converted back to flux density units, only using data points from the X-ray and H-band light curves that were taken within less than 2 days from each other. The open circles in Figure 3a are from the (hard state) rise of the outburst until MJD 52394 (corresponding to the peaks in X-rays and the H-band light curves). As can be seen, the X-ray and H-band fluxes in this state are strongly correlated, with a correlation coefficient of 0.99, although some scatter is present. Fitting these points with a power-law yields = 0.530.02 where . The relation seems to steepen somewhat toward higher X-ray fluxes. Fits with a power-law to the points with an X-ray flux smaller and larger than erg scm-2 give indices of 0.650.03 and 0.730.03, respectively, which, unlike the overall relation, are consistent with the slope of radio/X-ray relations found by Corbel et al. (2003) and Gallo et al. (2003). The fact that both are steeper than the overall correlation is due to the relative displacement of the two groups, with the low X-ray flux group having a relatively higher H-band flux density. Such a displacement could in principle be explained if there is another underlying component to the -band flux, but not for the X-ray flux, so that at low light levels, the -band levels off whereas the X-ray does not. Note that errors on the X-ray fluxes obtained from XSPEC are hard to estimate, especially when multi-component models are used. Power-law slopes measured using a wide range in errors were all consistent with each other.
After the peak of the outburst, when it entered the intermediate state, the source started following a path that clearly deviated from the one traced out in the hard state. This path is indicated by the dotted line and the crosses in Figure 3a. During this period the H-band flux dropped by a factor of 17, while the X-ray flux dropped by a factor of only 1.4. In the spectrally soft state the source traced out a clockwise pattern, which probably corresponded to the 15–20 day delay measured between the smoothed H-band curve and X-ray curve.
In Fig. 3b and 3c we show correlations between the H-band flux density, and the power-law and disk flux, respectively. Comparing these panels to panel (a) confirms that during the rise of the outburst the H-band flux correlates well with the power-law component and that the circular pattern in the spectrally soft state is indeed due to a delay between the disk flux and H-band flux density. Plots of V-band and I-band flux densities versus total X-ray flux (not shown) are similar to those for the H-band flux density . Both correlate well during the hard state and can be fitted with a (slightly flatter) power-law with indices of 0.480.02 for the I-band and 0.440.03 for the V-band.

3.4. Spectral Energy Distributions
To relate the (spectral) changes in the optical/nIR, X-ray and radio bands to each other, we have created several spectral energy distributions (SEDs). The radio flux densities were taken and estimated from Fender et al. (2002) and Gallo et al. (2004) (also E. Gallo and S. Corbel, private communication). Our optical/nIR magnitudes were converted to flux densities (Zombeck, 1990) and dereddened assuming an of atoms cm-2 (Kong et al., 2000). The was converted (Predehl & Schmitt, 1995) to a reddening E(B-V) of 0.94, which was in turn converted into dereddening factors using the values found in Cardelli et al. (1989). These factors were 1.67 (H ), 3.63 (I ), and 14.78 (V ). Our X-ray spectra were deconvolved using the model fit (with set to zero) and then converted to flux densities (Zombeck, 1990). Figure 4 shows four SEDs: two from the hard state (MJD 52368, with X-ray data from MJD 52367, and MJD 52382), one from the intermediate state (MJD 52406; radio data from MJD 52408), and one from the spectrally soft state (MJD 52483; X-ray data from MJD 52487). For comparison we plot the SED of MJD 52368 also in the other three panels (gray dots). Note that the errors on the optical/nIR points are correlated through the uncertainty on (which dominates the error) and should therefore have the same direction.
The first two SEDs (Fig. 4a,b) show that the brightening of the X-rays and optical/nIR in the hard state is accompanied by a brightening of the radio by a similar factor. The optical/nIR part in these hard state SEDs has a shape (see also Fig. 5) that is very similar to the turnover observed by Corbel & Fender (2002) in GX 339–4 during its 1981 and 1997 outbursts. The slopes of power-laws that connect the radio and H-band points for the first and second SED are 0.180.01 and 0.150.01, respectively. These slopes are very similar to those of the optically thick/self absorbed radio spectra of black holes sources in their hard state (Fender, 2001; Fender et al., 2001). This association is supported by the fact that the -band point of the second SED lies close to the extrapolation of the radio spectrum, which has a slope of 0.140.02 (the full range is indicated by the two dotted lines). Corbel & Fender (2002) suggested that the near-infrared lies above the optically thin break of the compact jet synchrotron spectrum. Although such a break cannot be seen in our data, the negative spectrum slope between the and -bands, suggests this to be the case in our hard state observations as well.

The intermediate state SED (Fig. 4c) shows a clear steepening of the X-ray spectrum and the disappearance of the turnover in the optical/nIR. Two sets of radio points are shown in the intermediate state SED. The lower one represents the base level at the start of the radio observation, indicating a small decrease compared to the second hard state set, and the upper one the peak of a radio flare that began two hours after the start of the observation and lasted for at least six hours (Gallo et al., 2004). A clear change in the spectral index can be seen, indicating a change to more optically thin emission as the source brightened. The radio ejecta associated with this flare were followed for more than four months by Gallo et al. (2004). For the soft state SED (Fig. 4d) no I- and V-band data were available. The X-ray spectrum was even steeper than in the intermediate state but the H-band flux was of a similar value. The source was still detected at radio wavelengths at a flux density significantly higher than in the first hard state observation. The radio spectral index and imaging observations (Gallo et al., 2004) show that this emission was from an extended rather than a compact source.
In Figure 5 we show the evolution of the optical/nIR part of the SED in more detail. The solid lines are from the rise until the peak in the optical/nIR, the dashed lines from the decay. The H-band not only rises faster than the I- and V-bands, but also decays much faster than those bands. The slope between the V and I bands stayed surprisingly constant. Judging from similar the profiles of the three optical/nIR bands one would think they were produced by the same component and that the spectral reddening seen in the H-band would also be observed in the I/V part of the spectrum. However, this is not clearly seen. Possible explanations for this will be discussed in §4.2.1
4. Discussion
During the first 240 days of its 2002/2003 outburst GX 339–4 was observed in three X-ray states: a hard state (before MJD 52398), an intermediate state (MJD 52398–52410) and a spectrally soft state (after MJD 52411). In the hard state a clear correlation between the optical/nIR and X-ray fluxes was observed with no measurable lag between the X-rays and optical/nIR. In the intermediate state the ratio of optical/nIR and X-ray fluxes decreased by more than a factor of 5–10 compared to the hard state. This ratio remained more or less constant in the spectrally soft state, where long-term changes in the X-rays lag those in the nIR by 20 days. This difference in behavior suggests that the optical/nIR emission in the hard state had a very different origin than in the latter two states and that the intermediate state represents a transitional state. This is supported by the changes in the optical/nIR SEDs.
4.1. Comparison to previous outbursts and other sources
X-ray–optical/nIR behavior similar to that reported in §3 has been observed before in GX 339–4. During the hard-to-soft transition of the 1981 outburst Motch et al. (1985) observed a fast (8 days) decline in the -band intensity by a factor of 2.5–3, while the 3–6 keV Hakucho count rate increased simultaneously by a similar factor. For comparison, examining a light curve of our 3–6 keV RXTE/PCA count rate reveals an increase by a factor of 1.6 during a period in which the -band flux dropped by a factor of 2.3. Motch et al. (1985) were able to fit the optical/nIR and X-ray parts of their hard state SED with a single power-law with index . None of our observations are consistent with this, not even when using the much lower of Motch et al. (1985). We do, however, observe a similar dramatic change between the SEDs of the hard and soft spectral state. Our hard state SEDs are quite similar to those in Corbel & Fender (2002) which show a clear turnover in the optical/nIR range.
In the last few years long-term optical/nIR campaigns have been undertaken for the two black hole X-ray transients XTE J1859+226 (Sánchez-Fernández et al., 2001; Zurita et al., 2002) and XTE J1550–564 (1998/1999 and 2000 outbursts; Sánchez-Fernández et al., 1999; Jain et al., 1999, 2001a, 2001b). In most of these cases the optical/nIR data were only compared to RXTE/ASM and not to RXTE/PCA data. The optical/nIR light curve of XTE J1859+226 peaked a few days after the RXTE/ASM light curve, as opposed to GX 339–4 where the optical/nIR peaked about 15 days before a (local) maximum in the ASM light curve (around MJD 52410, not visible as a peak in the RXTE/PCA light curve). RXTE/PCA observations show that near the end of the X-ray coverage of XTE J1859+226 the source made a transition to a harder spectral state. We analyzed four of the five observations after this transition and find that the energy spectra are well fitted with power-laws with indices between 1.7 and 2.3, suggesting a transitional phase to the hard state. The transition to the harder state occurred between MJD 51587–51608 and does not clearly stand out in the optical/nIR. XTE J1859+226 did show several mini-outbursts in optical/nIR. However, they all occurred when the X-ray observations had ended and the source had presumably returned to the hard state.


After reaching its peak, the H-band light curve of the 2000 outburst of XTE J1550–564 showed a strong decrease by 1.5 magnitudes within 8 days (Jain et al., 2001a). This decrease started when the source made a transition from the hard state to the intermediate state (Rodriguez et al., 2003). Unlike GX 339–4, in XTE J1550–564 a similar decrease is not observed in the I- and V-bands. On the other hand, the return of XTE J1550–564 to the hard state shows up as an increase in all three optical/nIR bands, similar to what was observed in GX 339–4 when it returned to the hard state at the end of the 2002/2003 outburst (M. Buxton, in prep.) and more recently in 4U 1543–47 at the end of its 2002 outburst (Buxton & Bailyn, 2004). This suggests that the hard state can be associated with an enhancement of the nIR and, to a lesser extent, the optical. In this respect, it is important to distinguish between the hard state, where the hard component completely dominates, and the other three states which do show a hard component, but a (much) weaker and steeper one. Observations of XTE J1550–564 during the second part of its 1998/1999 outburst suggest an anti-correlation between the optical/nIR and the strength of the hard spectral component in the spectrally soft state (Jain et al., 2001b), possibly indicating that the hard component in these states has a different origin that the one in the hard state, as has already been suggested before (see, e.g., Coppi, 1999).
4.2. Origin of the optical/nIR emission
There are several physical components to an X-ray binary, many of which are theorized to produce significant optical/nIR emission: the accretion disk, the secondary star, a jet (e.g. Markoff et al., 2001), and/or a magnetically dominated compact corona (e.g. Merloni et al., 2000). In the first two components the optical/nIR can either be the results of internal or external heating by X rays, depending upon the state of the system and exact parameters. Shahbaz et al. (2001) and Chaty et al. (2002) showed that the companion star in GX 339–4 is most likely an evolved low-mass star with little (20–30%) contribution in the near-infrared in quiescence. Assuming a black hole mass of 5.8 , a secondary mass of 0.52 , and an orbital period of 1.75 days (Hynes et al., 2003b), which gives a binary separation of cm, irradiation of the secondary by an X-ray source with a luminosity of erg s-1 is unlikely to increase the optical/nIR flux by more than a factor 10, much less than the factor of a few hundred required to explain the observed optical/nIR increase. This basically rules out the secondary as the dominant source of optical/nIR emission in GX 339–4 during outburst. In the following sections we discuss how the other suggested components can explain the observed optical/nIR behavior.

4.2.1 Hard state
During the rise in the hard state of GX 339–4 we observed a strong correlation between the nIR and X-ray fluxes. Their relationship has a similar power-law form as the radio/X-ray correlations observed in the hard states of GX 339–4 and other black-hole binaries (Hannikainen et al., 1998; Corbel et al., 2003; Gallo et al., 2003), though with a slope of 0.530.02 compared to 0.710.01. Our slope was calculated using the full 3–100 keV X-ray band rather than the 2–11 keV band used by Gallo et al. (2003), but extends over a similar range in X-ray flux as the radio/X-ray correlations. While the origin of the X-ray emission in the hard state is still a matter of debate, the radio emission is generally believed to be from a jet outflow (for a recent review see Fender, 2003).
The similarity between the nIR/X-ray and radio/X-ray relations suggests that most of the nIR emission in the hard state could originate in the jet as well. This was already suggested by Corbel & Fender (2002) who found that the nIR emission in the 1981 and 1997 hard states of GX 339–4 lies on an extrapolation of the radio spectrum of the source. They interpreted the nIR emission as being optically thin synchrotron emission from a compact jet. This interpretation is supported by several additional arguments. First, neither thermal emission from a (heated) disk444Following Vrtilek et al. (1990) we calculated the spectrum of an irradiated accretion disk (outer radius cm) and found that for a range of reasonable parameters it peaks at wavelengths well below the -band. X-ray reprocessing can therefore not explain the observed upturn between the and bands. or companion star, nor a magnetically dominated compact corona, can explain the nIR excess that is apparent from our two hard state SEDs, since these models predict an decrease toward longer wavelengths in the optical/nIR. Synchrotron emission from a compact jet can naturally account for this excess, as it is predicted to peak in the nIR for X-ray binaries, and is intrinsically much redder than the other components (Markoff et al., 2001). Second, a disk origin of the optical/nIR can probably also be ruled out on the basis of its observed decay by factors of 5–15 around MJD 52400. Such changes should occur on a viscous time scale, which in this system is much longer (probably 15–20 days, as we argue in §4.2.3). Reprocessing could in principle explain the fast time scales, since the optical would almost immediately follow the X-rays. However, if the sudden drop around MJD 52400 was the result of a decrease in the illuminating X-ray flux (assuming a constant outer disk geometry) the optical/nIR spectrum should have become redder (because of the lower outer disk temperature), while in fact the opposite was observed. Finally, as soon as the disk black body started to contribute significantly in the (3–100 keV) X-ray band, the nIR flux decreased dramatically. This behavior is similar to what is seen for the radio flux in GX 339–4, which is quenched in the spectrally soft state (Fender et al., 1999).
Although the above suggests that the nIR in the hard state is dominated by emission from a (compact) jet, extended nIR emission from galactic black hole binaries has so far only been observed once, in the micro-quasar GRS 1915+105 (Sams et al., 1996). The typical size scales of the IR-emitting regions are in general too small to be easily observed with worse than subarcsecond resolution.
We can look to the light curve for some clues about contributions from other mechanisms. The fact that the optical/nIR emission did not return to pre-outburst levels after the MJD 52400 decrease probably indicates that, during the hard state, other components in addition to a jet contributed to the optical/nIR. The steep “V” shape of the SED from the nIR to optical also suggests two distinct components to the emission, and while it seems fairly likely that the -band data point is dominated by jet synchrotron, the - and -bands could be combinations of various components. Possible contributors to the bands are thermal emission from an accretion disk or even irradiation of the outer disk or companion star as suggested by Corbel & Fender (2002). While spectrally direct disk emission could be possible (see Fig. 7), the fast optical timescales observed are inconsistent with the expected thin disk viscous timescales and they limit the thermal contribution from the disk. The maximum disk contribution in the hard state is probably close to the level observed in the intermediate state after MJD 52400. What we know is that the slope of the blue side of the “V” remained remarkably stable over the rising hard state, while the lower half seems to be rising more, comparatively. So whatever the underlying physics, it is clear that these two components are somewhat decoupled.
Most likely, the rise in the SED above the nIR is due to some combination of thermal and non-thermal emission, but dominated by synchrotron/cyclotron emission originating in a different region from the outer jet responsible for the radio through nIR emission. This could either be the foot point, or base, of the jet, or some kind of magnetized compact corona (e.g., Fabian et al., 1982; Merloni et al., 2000), though the difference between these two scenarios may be semantical. As a means for discussion, in Figs. 6 & 7, we show examples of two extreme cases involving jets. Figure 6 shows the case when a jet is responsible for most of the SED of the two observed hard states. We stress that these are not fits to the data, because they have not been convolved with the response matrices for the PCA detector, nor do they include fine features such as reflection and iron lines. However, they represent the maximal jet model contribution to the SED, and can help define what is possible in a more conservative approach, shown in the opposite extreme in Fig. 7.
The models in Figure 6 contain 3 basic components: the band is dominated by synchrotron radiation from the base of the jet, and the same emitting electrons inverse Compton scatter with these synchrotron photons to create the bump dominating the higher X-ray frequencies. This base component must be slightly decoupled from the rest of the jet, which creates the radio-IR via self-absorbed synchrotron emission, or else it would be difficult to explain the steep “V” in the SED. Such a decoupling is not expected, but could result from extreme cooling or escape of the radiating particles before a zone of (re-)acceleration, whereas in a non-decoupled case the particles are predominantly cooling adiabatically. The models in Fig. 6 were calculated for a high inclination angle of 60 degrees. Varying this angle by 10 degrees leads to similar results, whereas angles of lower than 30–40 degrees would have resulted in flatter spectra and angles higher than 70–80 degrees (for which there is no evidence) in steeper spectra and a loss of power.
We take the opposite approach in Fig. 7, and show a model for the hard state SED of MJD 52368, where the I/V data result mainly from direct multicolor thermal disk emission (playing somewhat devil’s advocate to show an extreme case despite arguments against it). The jet is assumed to radiate only beyond an acceleration zone, producing optically thick radio to nIR emission, and leaving room for a separate corona to produce the hard X-rays (not shown). The disk model shown has fairly extreme parameters, comprising in power for a 7 black hole, with an inner disk temperature of only keV. This temperature was chosen to fall just below the soft X-ray data points, as is normally expected for bright hard states. These choices result in an inner disk truncated at and the outer disk ends at in order to go through the IR/optical data. A lower temperature would result in a similar fit for slightly lower luminosities, and thus greater values for the inner disk radius. This model is quite artificial in that the jet model is simply set to zero before the acceleration zone, and in reality there will be some emission from the base, or the corona is equivalent to the base of the jet and a self-consistent relationship to the outer jet must be worked out.
Either class of model has difficulty reproducing the steep “V”, which will be a tight constraint for any theory. Within the context of an entirely jet-dominated model, a more sharply peaked particle distribution than quasi-thermal in the base, or modified geometry could give a better fit to the “V”. What is important to note is that jets have the potential to contribute greatly to the SED beyond the radio/nIR, and in both cases the jet synchrotron emission is difficult to suppress. In order to fit the assumed optically thick-to-thin turnover near the -band, and be significantly under the X-rays, either the power-law of accelerated particles must be very steep, or only a tiny fraction of the total number of particles can be accelerated. In these models we assumed of the particles were accelerated, with particle distribution spectral indices typical of shock acceleration (). Acceleration via other mechanisms such as magnetic reconnection as seen in solar flares would result in even harder spectral indices.
The changes in the two hard state SEDs over time can be accounted for in jet-dominated models by varying the total power and with slight changes in the geometry and equipartition of energy. We plan to explore these variations along with full fitting to the X-rays in another paper.
It is not clear if jet emission dominated the nIR (and possibly also the optical) for the entire hard state. Around MJD 52360 we observed a strong reddening in the color, possibly indicating that only at that point the jet started to dominate the optical/nIR emission. Interestingly, taking only the hard state data after MJD 52360 the slope of the -band/X-ray flux relation becomes 0.730.03, which is consistent with the value for the radio/X-ray relation (0.710.01). It should be noted however, that the slope of the data before MJD 52360 steepens to 0.650.03, which is also marginally consistent with 0.71.
4.2.2 Intermediate state
The accelerated steepening of the power-law component in the X-ray spectrum coincides with the source leaving the nIR/X-ray relation that was observed in the hard state. The steepening of the power-law component could be the result of increased cooling or less efficient particle acceleration. If at the same time also the fraction of accelerated particles goes down, this could explain the sudden drop in the optical and nIR fluxes. Regardless of the exact interpretation of the sudden decrease in the optical/nIR, our observations strongly suggest that the compact jet started to change when the source enters the intermediate state, before it likely shut off completely in the spectrally soft state. At the end of the intermediate state the optical/nIR was probably dominated by the contribution from the accretion disk (see also §4.2.3).
After the source entered the intermediate state and then the spectrally soft state, the X-ray power-law component decreased on a much longer timescale than the optical/nIR component. This further suggests a different origin for the power-law component in the other three states, as already mentioned at the end of §4.1.
4.2.3 Soft state
While the optical/nIR light curves in the hard state had a shape similar to that of the X-ray power-law flux, in the spectrally soft states they were more similar to that of the X-ray disk flux. The observed lag (15–20 days) of the X-ray flux variations with respect to those in the H-band (Figure 2) strongly suggest a disk origin of the optical/IR emission in those states. The magnitude of the lag is in line with what one would expect for the time it takes for changes in the mass accretion rate in the outer disk (where most of the optical/nIR originates) to reach the inner disk (where the X-ray are produced), i.e. the viscous time scale. The fact that a delay of this order is observed also indicates that X-ray reprocessing is of minor importance to the nIR continuum, since in that case changes in the X-rays would have preceded those in the -band by several seconds. The disk origin of the optical/nIR is also supported by the changes in the SED. The optical/nIR points of the MJD 52406 SED were fitted by a power law with slope 1.40.4. This is marginally consistent with , which is expected for the Rayleigh-Jeans part of a multi-color disk spectrum.
The sudden onset of flaring in the -band as the disk component became the dominant X-ray spectral component (around MJD 52440) is not well understood. These fast changes are not observed in the X-ray band. The sampling in the X-rays is arguably not as good as in the -band but individual X-ray observations made during the nIR-flaring period show hardly any variability, making a reprocessing origin unlikely. The flares may have a similar origin as the optical flares found by Zurita et al. (2003) in five quiescent soft X-ray transients. These have similar amplitudes, but shorter time scales (up to hours). Zurita et al. (2003) suggested a magnetic loop reconnection events in the outer accretion disk as a possible explanation. Rapid optical/IR variability has been observed before in the hard states of GX 339–4 and XTE J1118+480 (Hynes et al., 2003a), but the time scales involved there are much shorter and the X-rays always show variations on a similar time scale.
4.3. X-ray vs. optical/nIR delay
Optical/nIR monitoring campaigns of GRO J1655–40 (Orosz et al., 1997), XTE J1550–564 (Jain et al., 2001a), and 4U 1543–47 (Buxton & Bailyn, 2004) revealed that in these sources the start of the outburst in X-rays lagged the start in the optical/nIR by 3–11 days. These outbursts most likely started in an ”off” state ( erg s-1), and could thus be different from the event reported here for GX 339-4, which may have started in a higher luminosity state ( erg s-1, based on the lowest detected flux by Corbel et al. (2003) and assuming a distance of 6 kpc). Nevertheless, our results may be relevant for interpreting these other events. The reported delays are generally thought to reflect the viscous time scale of a thin accretion disk, which determines the time it takes for the increase in mass accretion rate to reach the inner, X-ray emitting regions of the accretion flow, and/or the time it takes to replace a radiatively inefficient advection dominated accretion flow (ADAF, see e.g. Hameury et al., 1997). In both the above cases the measurements of the delays were based on a comparison of optical/nIR with RXTE/ASM data, which is far less sensitive than the RXTE/PCA. Our data set for the 2002 outburst of GX 339–4 shows that a source may already be rising for several weeks before the ASM is able to detect it. The X-ray delay that we measure with the PCA is less than a week and consistent with zero delay, whereas the ASM yields a delay of 20-45 days, a factor of more than 3–6 longer. Obviously, this has important consequences for conclusions based on delays measured with the ASM. For example, if the delays estimated from the ASM light curves were longer than the true delay by the same factor as found in the case of GX 339–4, then the true delays in GRO J1655–40, XTE J1550–564, and 4U 1543–47 may have been only 0.5–2 days.
Delays shorter than a few days are difficult to understand in disk instability models, which predict the X-rays (from the inner disk or ADAF) to rise about a week after the optical/nIR (from the outer disk). No delays are expected if both the hard X-rays and optical/nIR are produced by a jet or the base of a jet. In fact, the optical/nIR should lag the X-ray in such a case, by seconds to minutes. However, it is not clear how the jet is fed with matter during the early stages of the outburst, as there is no sign of an inner accretion disk in the early X-ray spectra. One option is that the jet is not fed by the inner accretion disk, but rather by an independent flow, that is able to respond much faster to changes in the accretion rate than the accretion disk itself, and possibly couples directly to the jet. The existence of such a second flow has recently been discussed by several authors (van der Klis, 2001; Smith et al., 2002a).
4.4. X-ray reflection and reprocessing
In the parts of the spectrally soft state and the intermediate state at the end of the 2002/2003 outburst Fe K emission lines and reflection components in the X-ray spectrum of GX 339–4 (Miller et al., 2004a, b) provide strong evidence for a source that irradiates the inner accretion flow with hard X-rays. Assuming a concave shape for the accretion disk, one would expect that such a source of hard X-rays might also to be able to irradiate the outer parts of the accretion disk, which should be visible as enhanced optical/nIR flux. However, the fact that no clear evidence is found for reprocessed X-rays in the optical/nIR suggest that the geometry of the irradiating source is not efficient for X-ray heating of the outer disk. This would favor a geometry for the hard X-ray source in which it is aligned with the disk plane (and does not radiate isotropically) rather than it being elevated above the disk.
5. Summary & Conclusions
Both from a spectral and variability viewpoint it is becoming increasingly clear that in some X-ray states the optical/nIR emission in black hole X-ray binaries must have a strong non-thermal component (see e.g. Corbel & Fender, 2002; Kanbach et al., 2001; Hynes et al., 2003a). Our observations revealed, in great detail, a switch in the dominating optical/nIR emission mechanism as GX 339–4 moved from the hard X-ray state to intermediate state and then the spectrally soft state. In the hard state we found a correlation between the optical/nIR and X-ray fluxes that extended over three orders of magnitude in X-ray flux and which had a similar slope as the one found between radio and X-ray fluxes in several black hole binaries, including GX 339–4. The non-measurable delay between X-ray and optical/nIR fluxes and the spectral energy distribution suggest a non-thermal/jet origin for the nIR emission in the hard state. The optical emission in the hard state is probably due to a combination of emission from a jet, a (heated) accretion disk and possibly a compact corona. As soon as the source entered the intermediate state we observed a large decrease in the optical/nIR fluxes, which suggests changes in the jet properties, even though the radio stayed at a similar level as in the hard state. In the spectrally soft state the ratio of X-ray to optical/nIR was a factor of 10 higher than in the hard state and the delay between nIR and X-ray fluxes was more than two weeks. These changes in the X-ray and optical/nIR properties suggest that the dominant source of optical/nIR emission was a non-heated (or only moderately heated) accretion disk. It is interesting to note that in none of the X-ray states X-ray reprocessing in the outer disk seems to be the dominant source of optical/nIR emission.
Our monitoring observations have shown that the optical/nIR properties of black hole X-ray binaries are extremely sensitive to the X-ray state of the system. Especially the X-ray to optical/nIR flux ratio may be helpful in determining the state of systems for which accurate X-ray spectral and variability properties cannot be obtained.
Finally, we want to stress the importance of extending optical/nIR monitoring of black hole transients to perform variability studies simultaneously with X-ray observations. Optical variability studies have often been done without simultaneous X-ray coverage (Imamura et al., 1990; Steiman-Cameron et al., 1990, 1997) and in cases were X-ray data was obtained, the observations were predominantly in the hard X-ray state (Kanbach et al., 2001; Hynes et al., 2003a). Similar observations in other X-ray states will greatly increase understanding of the accretion flows in these systems, as the changes in the optical/nIR variability properties (e.g. energy dependence over many orders of QPO frequency) can be related to changes in the spectral energy distribution and be used to rule out possible sources of optical/nIR emission. For example, recent X-ray and optical observations of the black hole transient H1743–322 by Spruit et al. (2004) seem to indicate that so-called type B X-ray QPOs (observed in parts of the spectrally soft states) no optical counterpart unlike those in the hard and intermediate states (the so-called type C QPOs), supporting claims that the optical/nIR in these two states have very different origins.
References
- Arnaud (1996) Arnaud, K. A. 1996, in ASP Conf. Ser. 101: Astronomical Data Analysis Software and Systems V, Vol. 5, 17
- Belloni et al. (2004) Belloni, T., Homan, J., Casella, P., et al. 2004, A&A, submitted
- Belloni et al. (2002) Belloni, T., Nespoli, E., Homan, J., et al. 2002, in New Views on Microquasars, 75–+
- Bradt et al. (1993) Bradt, H. V., Rothschild, R. E., & Swank, J. H. 1993, A&AS, 97, 355
- Buxton & Bailyn (2004) Buxton, M. & Bailyn, C. 2004, ApJ, in press
- Cardelli et al. (1989) Cardelli, J. A., Clayton, G. C., & Mathis, J. S. 1989, ApJ, 345, 245
- Chaty et al. (2002) Chaty, S., Mirabel, I. F., Goldoni, P., et al. 2002, MNRAS, 331, 1065
- Chen et al. (1997) Chen, W., Shrader, C. R., & Livio, M. 1997, ApJ, 491, 312
- Coppi (1999) Coppi, P. S. 1999, in ASP Conf. Ser. 161: High Energy Processes in Accreting Black Holes, 375–+
- Corbel & Fender (2002) Corbel, S. & Fender, R. P. 2002, ApJ, 573, L35
- Corbel et al. (2003) Corbel, S., Nowak, M. A., Fender, R. P., Tzioumis, A. K., & Markoff, S. 2003, A&A, 400, 1007
- Doxsey et al. (1979) Doxsey, R., Bradt, H., Johnston, M., et al. 1979, ApJ, 228, L67
- Fabian et al. (1982) Fabian, A. C., Guilbert, P. W., Motch, C., et al. 1982, A&A, 111, L9+
- Falcke et al. (2003) Falcke, H., Koerding, E., & Markoff, S. 2003, ArXiv Astrophysics e-prints
- Fender (2003) Fender, R. 2003, astro-ph/0303339
- Fender et al. (1999) Fender, R., Corbel, S., Tzioumis, T., et al. 1999, ApJ, 519, L165
- Fender et al. (2002) —. 2002, The Astronomer’s Telegram, 107, 1
- Fender (2001) Fender, R. P. 2001, MNRAS, 322, 31
- Fender et al. (2001) Fender, R. P., Hjellming, R. M., Tilanus, R. P. J., et al. 2001, MNRAS, 322, L23
- Gallo et al. (2004) Gallo, E., Corbel, S., Fender, R. P., Maccarone, T. J., & Tzioumis, A. K. 2004, MNRAS, 347, L52
- Gallo et al. (2003) Gallo, E., Fender, R. P., & Pooley, G. G. 2003, MNRAS, 344, 60
- Gruber et al. (1996) Gruber, D. E., Blanco, P. R., Heindl, W. A., et al. 1996, A&AS, 120, C641
- Hameury et al. (1997) Hameury, J.-M., Lasota, J.-P., McClintock, J. E., & Narayan, R. 1997, ApJ, 489, 234
- Hannikainen et al. (1998) Hannikainen, D. C., Hunstead, R. W., Campbell-Wilson, D., & Sood, R. K. 1998, A&A, 337, 460
- Homan et al. (2004) Homan, J., Belloni, T., Nespoli, E., et al. 2004, ApJ, to be submitted
- Hynes et al. (2004) Hynes, R. I., Charles, P. A., Garcia, M. R., et al. 2004, ApJ, 611, L125
- Hynes et al. (2003a) Hynes, R. I., Haswell, C. A., Cui, W., et al. 2003a, MNRAS, 345, 292
- Hynes et al. (2003b) Hynes, R. I., Steeghs, D., Casares, J., Charles, P. A., & O’Brien, K. 2003b, ApJ, 583, L95
- Imamura et al. (1990) Imamura, J. N., Kristian, J., Middleditch, J., & Steiman-Cameron, T. Y. 1990, ApJ, 365, 312
- Jahoda et al. (1996) Jahoda, K., Swank, J. H., Giles, A. B., et al. 1996, Proc. SPIE, 2808, 59
- Jain et al. (2001a) Jain, R. K., Bailyn, C. D., Orosz, J. A., McClintock, J. E., & Remillard, R. A. 2001a, ApJ, 554, L181
- Jain et al. (2001b) Jain, R. K., Bailyn, C. D., Orosz, J. A., et al. 2001b, ApJ, 546, 1086
- Jain et al. (1999) Jain, R. K., Bailyn, C. D., Orosz, J. A., Remillard, R. A., & McClintock, J. E. 1999, ApJ, 517, L131
- Kanbach et al. (2001) Kanbach, G., Straubmeier, C., Spruit, H. C., & Belloni, T. 2001, Nature, 414, 180
- Kong et al. (2000) Kong, A. K. H., Kuulkers, E., Charles, P. A., & Homer, L. 2000, MNRAS, 312, L49
- Landolt (1992) Landolt, A. U. 1992, AJ, 104, 340
- Liu et al. (2001) Liu, Q. Z., van Paradijs, J., & van den Heuvel, E. P. J. 2001, A&A, 368, 1021
- Markert et al. (1973) Markert, T. H., Canizares, C. R., Clark, G. W., et al. 1973, ApJ, 184, L67+
- Markoff et al. (2001) Markoff, S., Falcke, H., & Fender, R. 2001, A&A, 372, L25
- Markoff et al. (2003) Markoff, S., Nowak, M., Corbel, S., Fender, R., & Falcke, H. 2003, A&A, 397, 645
- Matsuoka et al. (1984) Matsuoka, M., Mitsuda, K., Ohashi, T., et al. 1984, ApJ, 283, 774
- McClintock et al. (1979) McClintock, J. E., Canizares, C. R., Cominsky, L., et al. 1979, Nature, 279, 47
- McClintock et al. (2001) McClintock, J. E., Haswell, C. A., Garcia, M. R., et al. 2001, ApJ, 555, 477
- McClintock & Remillard (2003) McClintock, J. E. & Remillard, R. A. 2003, astro-ph/0306213
- Merloni et al. (2000) Merloni, A., Di Matteo, T., & Fabian, A. C. 2000, MNRAS, 318, L15
- Merloni et al. (2003) Merloni, A., Heinz, S., & di Matteo, T. 2003, MNRAS, 345, 1057
- Miller et al. (2004a) Miller, J. M., Fabian, A. C., Reynolds, C. S., et al. 2004a, ApJ, 606, L131
- Miller et al. (2004b) Miller, J. M., Raymond, J., Fabian, A. C., et al. 2004b, ApJ, 601, 450
- Mitsuda et al. (1984) Mitsuda, K., Inoue, H., Koyama, K., et al. 1984, PASJ, 36, 741
- Motch et al. (1982) Motch, C., Ilovaisky, S. A., & Chevalier, C. 1982, A&A, 109, L1
- Motch et al. (1985) Motch, C., Ilovaisky, S. A., Chevalier, C., & Angebault, P. 1985, Space Science Reviews, 40, 219
- Motch et al. (1983) Motch, C., Ricketts, M. J., Page, C. G., Ilovaisky, S. A., & Chevalier, C. 1983, A&A, 119, 171
- O’Brien et al. (2002) O’Brien, K., Horne, K., Hynes, R. I., et al. 2002, MNRAS, 334, 426
- Orosz et al. (1997) Orosz, J. A., Remillard, R. A., Bailyn, C. D., & McClintock, J. E. 1997, ApJ, 478, L83+
- Predehl & Schmitt (1995) Predehl, P. & Schmitt, J. H. M. M. 1995, A&A, 293, 889
- Remillard et al. (2002) Remillard, R. A., Sobczak, G. J., Muno, M. P., & McClintock, J. E. 2002, ApJ, 564, 962
- Rodriguez et al. (2003) Rodriguez, J., Corbel, S., & Tomsick, J. A. 2003, ApJ, 595, 1032
- Rothschild et al. (1998) Rothschild, R. E., Blanco, P. R., Gruber, D. E., et al. 1998, ApJ, 496, 538
- Sánchez-Fernández et al. (1999) Sánchez-Fernández, C., Castro-Tirado, A. J., Duerbeck, H. W., et al. 1999, A&A, 348, L9
- Sánchez-Fernández et al. (2001) Sánchez-Fernández, C., Castro-Tirado, A. J., Giménez, A., et al. 2001, Astrophysics and Space Science Supplement, 276, 51
- Sams et al. (1996) Sams, B. J., Eckart, A., & Sunyaev, R. 1996, Nature, 382, 47
- Shahbaz et al. (2001) Shahbaz, T., Fender, R., & Charles, P. A. 2001, A&A, 376, L17
- Smith et al. (2002a) Smith, D. M., Heindl, W. A., & Swank, J. H. 2002a, ApJ, 569, 362
- Smith et al. (2002b) Smith, D. M., Swank, J. H., Heindl, W. A., & Remillard, R. A. 2002b, The Astronomer’s Telegram, #85, 85, 1
- Spruit et al. (2004) Spruit, H. C., Steinle, H., & Kanbach, G. 2004, astro-ph/0404524
- Steiman-Cameron et al. (1990) Steiman-Cameron, T., Imamura, J., Middleditch, J., & Kristian, J. 1990, ApJ, 359, 197
- Steiman-Cameron et al. (1997) Steiman-Cameron, T. Y., Scargle, J. D., Imamura, J. N., & Middleditch, J. 1997, ApJ, 487, 396
- Tanaka & Lewin (1995) Tanaka, Y. & Lewin, W. H. G. 1995, in X-ray binaries (Cambridge Astrophysics Series, Cambridge, MA: Cambridge University Press, —c1995, edited by Lewin, Walter H.G.; Van Paradijs, Jan; Van den Heuvel, Edward P.J.), p. 126
- van der Klis (2001) van der Klis, M. 2001, ApJ, 561, 943
- van Paradijs & McClintock (1995) van Paradijs, J. & McClintock, J. E. 1995, Optical and Ultraviolet Observations of X-ray Binaries (X-ray Binaries, eds. W.H.G. Lewin, J. van Paradijs, and E.P.J. van den Heuvel (Cambridge: Cambridge Univ. Press), p. 58), 58–+
- Vrtilek et al. (1990) Vrtilek, S. D., Raymond, J. C., Garcia, M. R., et al. 1990, A&A, 235, 162
- Wijnands et al. (1999) Wijnands, R., Homan, J., & van der Klis, M. 1999, ApJ, 526, 33
- Zhang et al. (1993) Zhang, W., Giles, A. B., Jahoda, K., et al. 1993, Proc. SPIE, 2006, 324
- Zombeck (1990) Zombeck, M. V. 1990, Handbook of space astronomy and astrophysics (Cambridge: University Press, 1990, 2nd ed.)
- Zurita et al. (2003) Zurita, C., Casares, J., & Shahbaz, T. 2003, ApJ, 582, 369
- Zurita et al. (2002) Zurita, C., Sánchez-Fernández, C., Casares, J., et al. 2002, MNRAS, 334, 999