Observation of the Ankle and Evidence for a High-Energy Break in the Cosmic Ray Spectrum
Abstract
We have measured the cosmic ray spectrum at energies above eV using the two air fluorescence detectors of the High Resolution Fly’s Eye experiment operating in monocular mode. We describe the detector, PMT and atmospheric calibrations, and the analysis techniques for the two detectors. We fit the spectrum to models describing galactic and extragalactic sources. Our measured spectrum gives an observation of a feature known as the “ankle” near eV, and strong evidence for a suppression near eV.
1 Introduction
The highest energy cosmic rays yet detected, of energies up to and above eV, are interesting in that they shed light on two important questions: how are cosmic rays accelerated in astrophysical sources, and how do they propagate to us through the cosmic microwave background radiation (CMBR)[1]? The acceleration of cosmic rays to ultra high energies is thought to occur in extensive regions of high magnetic fields, regions which are expanding at relativistic velocities[2]. Such regions are rare and are to be counted among the most violent and interesting objects in the universe.
Once accelerated, interactions between the ultra high energy cosmic rays (UHECR) and the CMBR cause the cosmic rays to lose energy. The strongest energy loss mechanism comes from the production of pions in these CMBR interactions at UHECR energies above about eV. This energy loss mechanism produces the Greisen-Zatsepin-K’uzmin (GZK) suppression[3, 4]. In addition, production in these same interactions provides a somewhat weaker energy loss mechanism above a threshold of about eV. A third important energy-loss mechanism at all energies comes from universal expansion.
In previous publications[5, 6], we have reported on our measurements of the cosmic ray spectrum using data collected independently, in monocular mode, by the two detectors of the High Resolution Fly’s Eye experiment (HiRes). We here report on an updated measurement of the flux of UHECR, covering an energy range from eV to over eV, using a significantly larger data set for the HiRes-II detector. With the improved statistical power available in this data, we study two features in this spectrum: a break in the spectral slope at eV, called the “ankle”[7, 8, 9], and a steepening of the spectrum near the threshold for pion production.
The HiRes experiment performs a calorimetric measurement of the energy of cosmic rays. UHECR produce extensive air showers (EAS) when they enter the atmosphere. The HiRes detector collects the fluorescence light emitted by EAS as they propagate through the atmosphere. Charged particles in the shower excite nitrogen molecules which fluoresce in the ultraviolet (300 to 400 nm). The fluorescence yield is about five photons per minimum ionizing particle per meter of path length[10]. As an EAS propagates through the atmosphere, the detector measures the number of photons seen as a function of time and angle. From this information, we reconstruct the geometry of the shower and the solid angle subtended by the detector from each point of the shower. From the number of photons collected, we reconstruct the number of charged particles in the shower as a function of the depth of the atmosphere traversed. We integrate the energy deposited in the atmosphere[11] to find the energy of the primary cosmic ray.
UHECRs are thought to be protons or heavier nuclei up to iron. While nucleus-nucleus collisions are complex, the general features of the interaction can be understood in terms of a simple superposition model. In this model each nucleon generates an independent EAS. The superposition of many, lower energy showers will result in an EAS with different statistical properties than an EAS produced by one high energy proton. This allows one to measure the composition of the primary cosmic rays on a statistical basis.
2 The HiRes Detectors
The HiRes detectors have been described extensively elsewhere[12, 13]. In brief, they consist of spherical mirrors, of area 5.1 m2, which collect the fluorescence light and focus it onto a cluster of 256 photomultiplier tubes arranged in a 16 x 16 array. Each tube in the cluster views about one square degree of the sky. Time and pulse height information are collected from each tube. The HiRes detectors trigger on and reconstruct showers that occur within a radius of about 35 km.
The HiRes-I detector is located atop Little Granite Mountain on the U.S. Army Dugway Proving Ground in west-central Utah. It consists of 21 mirrors, and their associated phototube arrays, arranged in one ring, observing from 3 degrees to 17 degrees in elevation and providing almost complete coverage in azimuthal angle. The detector uses a sample-and-hold readout system which integrates phototube pulses for 5.6 . This is long enough to collect the signal from all cosmic ray showers of interest.
The HiRes-II detector is located on Camel’s Back Ridge, also on Dugway Proving Ground, about 12.6 km SW of HiRes-I. It consists of 42 mirrors, arranged in two rings, covering from 3 to 31 degrees in elevation and almost the whole azimuthal angle range. This detector uses a flash ADC (FADC) readout system with a 100 ns sampling time.
In this article, we present data collected from June 1997 to February 2003 for HiRes-I, and from December 1999 through September 2001 for HiRes-II. For HiRes-II, this is about four times the data that was reported on previously. We collect data on nights when the moon is down for three hours or more. In a typical year each detector collects up to about 1000 hours of data.
The weather is clear about of the time at the HiRes sites. Since clouds can reduce the experiment’s aperture, we record the existence of clouds by operator observations, infrared cameras, and evidence from data collected by the detector (this consists primarily of the upward going laser and flasher pulses, used to measure the atmospheric conditions, which have a distinct signature upon encountering a cloud; actual cosmic rays also appear emerging from clouds). Only data from those nights in which the aperture is not reduced by cloud cover are used in our spectrum measurements.
3 Calibration
The two most important calibrations we perform are of the photomultiplier tube (PMT) gains[14, 15], and of the clarity of the atmosphere[16]. We use a stable xenon flash lamp, carried to each detector and used to illuminate the photomultiplier array, to find PMT gains. The xenon lamp produces a light intensity of about 10 photons per mm2 at the face of the PMTs; this intensity is traceable to NIST-calibrated photodiodes and is stable to about 2%, flash-to-flash. Separate calibrations of PMT gains using photoelectron statistics and using the absolute light intensity of the xenon flash lamp agree within uncertainties. Xenon flash lamp data are collected about once a month. A second calibration system, using a frequency-tripled YAG laser, is used to monitor phototube gains on a night-to-night basis. We estimate that the relative calibration techniques are accurate to about 3% with an absolute calibration uncertainty of about %.
The atmosphere is our calorimeter, but it is also the medium through which fluorescence light propagates to the detectors. To calculate the number of fluorescence photons emitted by a cosmic ray shower, we must understand the way in which the atmosphere scatters this light between the EAS and the detector. The molecular component of the atmosphere is quite constant, with only small seasonal variations, and the Rayleigh scattering it produces is well understood. The aerosol content of the atmosphere can vary considerably over time, and with it, the amount of light scattered and its angular distribution.
To measure these quantities, we perform an atmospheric calibration using YAG lasers operating at wavelength nm. At each of our two sites, we have a steerable beam laser which is fired in a pattern of shots that covers the detector’s aperture, and which is repeated every hour. The scattered light from the laser at one site is collected by the detector at the other site. The amount of detected light is then analyzed to determine the scattering properties of the atmosphere. The properties that we measure are the vertical aerosol optical depth (VAOD), the horizontal aerosol extinction length, and the aerosol scattering phase function (the angular distribution of the differential scattering cross section).
Because about half of the data from HiRes-I were collected before the lasers were installed, we use average values of the measured parameters in this analysis: a horizontal aerosol extinction length of 25 km (the average horizontal molecular extinction length is 17 km), an average phase function, and a VAOD of 0.04[5, 16, 17]. The atmosphere at our sites is quite clear: the average atmospheric correction to an event’s energy is about 10% (see below for the effect on flux measurements). We are most sensitive to the value of VAOD. The RMS of the VAOD distribution is 0.02, and we use this RMS value as a conservative estimate of the systematic uncertainty in this parameter.
4 HiRes-II Data Analysis
The analysis of the HiRes-II monocular data has been described previously[6]. The data presented here were collected during 540 hours of good weather running, and consists of 21 million triggers, mostly of random sky noise and events generated by atmospheric lasers and other man-made light sources. Events were selected that satisfied the following criteria:
-
Angular speed
-
Selected tubes
-
Photoelectrons/degree 25
-
Track length , or for events extending above elevation
-
Zenith angle
-
In-plane angle
-
In-plane angle uncertainty
-
150 , and is within 50 g/cm2 of begin visible in detector
-
Average Čerenkov Correction 70%
-
Geometry fit /d.o.f. 10
-
Profile fit /d.o.f. 10
-
Minimal trigger from signal tubes required after March 2001
These cuts remove events in which the monocular geometric reconstruction is poor or in which the longitudinal profile cannot be determined accurately. The final event sample consisted of 2685 events covering an energy range from eV ( to eV.
The geometry of each event is reconstructed using the time and angle information from the hit PMTs. First a pattern recognition step is performed to choose phototubes that lie on a line both in angle and in time. Next the plane that contains both the shower and the detector is determined from the azimuth and elevation of hit tubes; the angle of the shower in this plane is determined from a fit to phototube time and angle information. The resolution of shower-detector plane determination is about , and the in-plane angle uncertainty is on average.
With the geometry determined, the profile of the number of charged particles in the shower is calculated from the phototube pulse heights. Corrections are made for atmospheric scattering of the light, and for other effects such as mirror reflectivity, phototube quantum efficiency, etc. A correction is made for the Čerenkov light produced by charged particles in the shower. Both direct and scattered Čerenkov light contributions to the light seen by the PMTs are calculated and subtracted. The number of charged particles is calculated from the fluorescence light at the shower using the fluorescence yield and its pressure and temperature variation as given by Kakimoto et al[10]. The resulting shower development profile, expressed as a function of slant depth, is fit to the Gaisser-Hillas parameterization[18] (this has been seen to fit UHE cosmic ray showers quite well[11, 19]). We integrate over the Gaisser-Hillas function and multiply by the average energy loss rate of 2.19 MeV/g/cm2 to calculate the energy of the primary cosmic ray. We then correct for unobserved energy, mostly neutrinos and muons which hit the ground. This correction[17], which varies from 10% at eV to 5% at eV, is determined during the Monte Carlo calculation of the aperture. It is similar to the calculation in reference [11].
A fraction of the HiRes-II events are also observed by HiRes-I. In this case we perform a cross-check on our monocular determination of the shower geometry. Figure 1 shows a scatter plot of the energy using monocular geometry versus the energy using stereo geometry, for those events in which such a comparison is possible.

The energy resolution, including statistical and systematic effects and the uncertainty in reconstructing the shower geometry, has been calculated in the Monte Carlo simulation[17]. The overall resolution is . It improves from below eV to above eV.
5 Monte Carlo Simulation
To calculate the aperture as a function of cosmic ray energy, a very accurate Monte Carlo (MC) simulation of the experiment was performed[6]. Two libraries of cosmic ray showers, one for proton primaries and one for iron primaries, were generated using the Corsika 5.61[20] EAS simulation program and the QGSJet 01[21] hadronic event generator. Events from these libraries were placed by a detector simulation in the vicinity of the HiRes-II detector. This program also simulated the fluorescence and Čerenkov light generated by the showers, and calculated how much of this light would have been collected by the detectors. A complete simulation of the optical path, trigger, and readout electronics was performed. This simulation followed the experimental conditions that pertained over the data-collection period. The results were written out in the same format as the data and analyzed by the same data analysis program described above. The stereoscopic energy spectrum of the Fly’s Eye experiment[7], in the form of a broken power law fit, and the composition measurements made by the HiRes/MIA hybrid experiment[22] and by HiRes in stereo[23] were used as inputs.
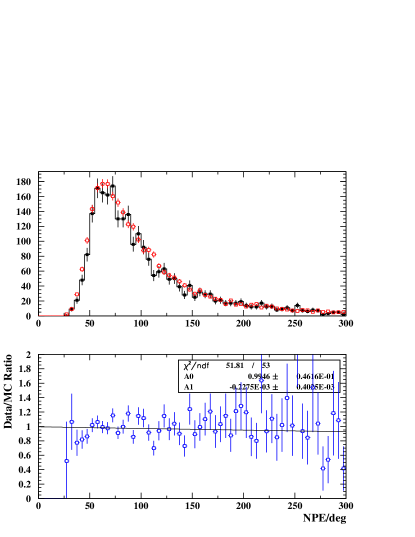
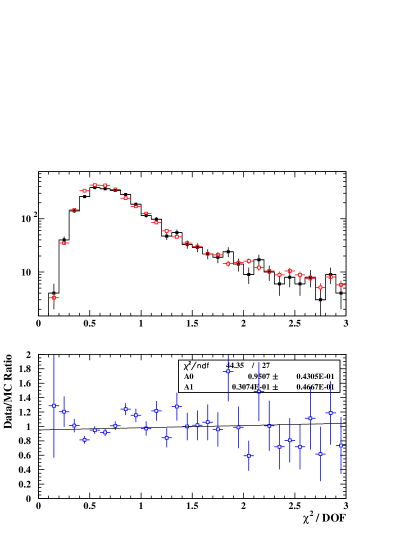
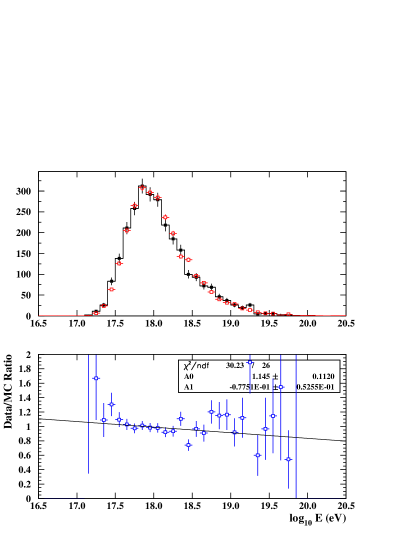
To convince ourselves that the MC simulation is accurate, we compare many MC distributions of geometrical and kinematic variables to the data. The agreement in these comparisons is excellent and indicates that we understand our detector. Figure 2 shows the brightness of showers: the number of photoelectrons per degree of track. The agreement between the data and MC simulation indicates that the same amount of light is collected in the MC as in the data. Figure 3 shows the of a fit to the time vs. angle plot from which we determine shower geometry. The agreement here indicates that the resolution of the MC is the same as that of the data. Figure 4 shows a histogram of the number of events vs the logarithm of their energy in EeV. The agreement here shows that, when we use previous measurements of the spectrum and composition in the MC, and a complete simulation of the acceptance, we reproduce the experiment’s energy dependence.
6 HiRes-I Analysis
The analysis of the HiRes-I monocular data has also been described previously [5, 6]. The main difference from the HiRes-II analysis is that, with only one ring of mirrors, most tracks are too short to reliably determine the geometry from timing alone. Although the determination of the shower-detector plane is still excellent, correlations between the fit distance to the shower and the fit in-plane angle become large for short tracks.
A reconstruction procedure using the pulse height information in addition to the tube angles and timing information has been developed: the profile constrained fit (PCF). The PCF uses the one-to-one correlation between in-plane angle and shower profile: the in-plane angle with the best fit shower profile is chosen as the in-plane angle of the shower. The Gaisser-Hillas function is used in this profile fit. The PCF works poorly for events close to the detector (within about 5 km), and for lower energy events (below eV), where less of the shower profile is seen. These events are excluded from the HiRes-I monocular sample. The PCF also works poorly if too much Čerenkov light contaminates the fluorescence signal; these events are cut also. In reconstructing MC events, it is found that, even with these cuts, the resolution is somewhat worse than for HiRes-II, and that there is an energy bias.
Since stereo events are seen in both detectors, they have excellent geometrical determination using the intersection of the two shower-detector planes. For these events, comparison of the PCF reconstruction to the stereo reconstruction shows the same energy resolution and bias as seen in the MC sample. Having confidence that we understand the PCF, we correct for the bias. Figure 5 shows the energy resolution of the PCF reconstruction for MC events and for stereo events after the correction. The agreement is excellent.
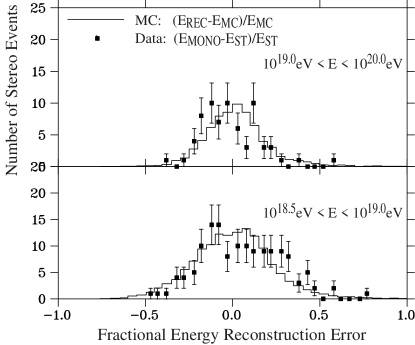
Figure 6 shows comparisons between the HiRes-I data and the MC simulation for the distance to the shower core of showers in three energy bands. Again the agreement is excellent.

7 Systematic Uncertainties
The largest systematic uncertainties in the calculations of energy are the absolute calibration of the phototubes ()[15], the fluorescence yield ()[10], and the correction for unobserved energy in the shower ()[11, 17]. These three uncertainties, added in quadrature, give an uncertainty in the energy of . This effect of this energy uncertainty in calculating the flux is [5].
To test the sensitivity of the flux measurement to atmospheric uncertainties, we generated new MC samples with VAOD values of 0.02 and 0.06, i.e., with the average plus and minus one RMS value, and analyzed them (and the data) using the same VAOD values. This provides a conservative estimate of the flux uncertainty since the systematic uncertainty in the average VAOD is less than the RMS. The result was a change in the flux of . Adding this in quadrature with the sources of systematic uncertainty described above results in a net uncertainty of . This uncertainty is common to the flux measurements from HiRes-I and HiRes-II.
The effect of using an average VAOD value, rather than the changing but measured values has also been studied[24, 17]. The changes to the energy scale and flux are negligible.
The limited elevation coverage of the HiRes-II detector makes the aperture calculation sensitive to the composition assumptions used in the MC simulation. This and other sources of systematic uncertainty (the given input spectrum and using an average atmosphere) are considered in reference [24]. The composition assumptions have a negligible effect on the aperture above an energy of eV, and give a systematic uncertainty of order the statistical uncertainty only at eV.
8 Results
Figure 7 shows the calculated aperture of the two HiRes detectors. At an energy of eV the aperture is nearly 10,000 km2 sr.
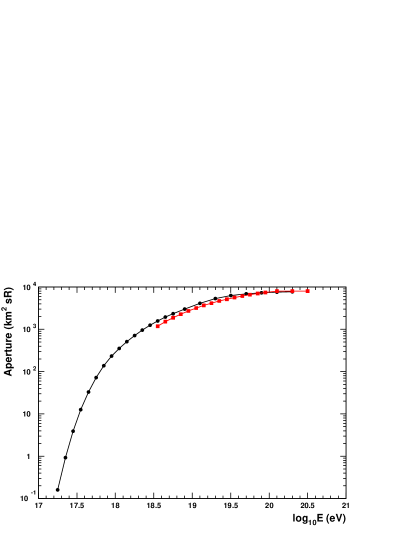
Figure 8 shows the measured spectrum of cosmic rays[25]. The spectrum has been multiplied by E3 for clarity. The closed squares (open circles) are the HiRes-I (HiRes-II) measurements. For comparison to previous experiments, the up-triangles are the stereo Fly’s Eye spectrum[7], and the down-triangles are the result of the Akeno Giant Air Shower Array (AGASA)[8]. The HiRes-I and HiRes-II monocular measurements agree with each other very well in the overlap region, and are also in good agreement with the Fly’s Eye stereo spectrum.
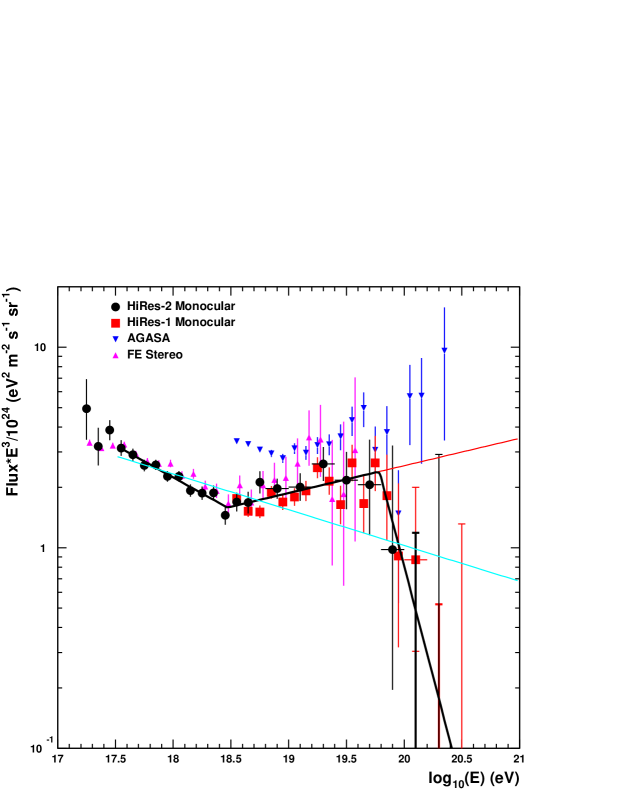
In this plot the ankle shows up clearly at eV (. The spectrum steepens again at eV (. The AGASA spectrum appears to continue unabated above this energy while the HiRes spectrum falls above this point.
We test whether our data are consistent with this interpretation of the AGASA spectrum by fitting our data to a broken power law. This fit is also shown on Figure 8. This fit had two floating break points separating three regions of constant spectral slope. The fit was performed using the normalized, binned maximum likelihood method[26], which allows us to include sparsely populated and empty bins. The fitted break points are at and . The fitted spectral slopes are , , and . The for the fit is 30.1 for 33 degrees of freedom. If we extend the middle section of the fit (as shown by the red/grey line in Figure 8) to higher energies, our aperture predicts that we should have 28.0 events above the second break point energy of , where we really have 11. The Poisson probability for 11 or fewer events with a mean of 28 is . We therefore conclude that our data is not consistent with a continuation of the spectrum unabated above the pion production threshold. It is worth emphasizing that we have considerable sensitivity to such a continuation, but the data do not support it.
A similar fit with only one break point has a of 46.0 for 35 degrees of freedom, worse by nearly 16 than the fit above (a significance of ). The fitted break point is at , and the fitted spectral slopes are and . A fit with no break points at all has a bad of 114 for 37 degrees of freedom, demonstrating that the ankle is clearly observed in our data. The spectral slope is . This fit is shown on Figure 8 as a cyan/light grey line.
9 Fitting the Spectrum
The implications of our spectrum measurement can be explored using a toy model of UHECR. In this model, there are two types of sources, galactic and extragalactic. We choose the galactic sources to be consistent with the HiRes/MIA and HiRes stereo composition measurements[22, 23]: we assign the iron component of the cosmic ray flux to be galactic[27]. This assignment is consistent with the expectation that the highest energy galactic cosmic rays should be those of the highest charge. The proton component we take to be extragalactic.
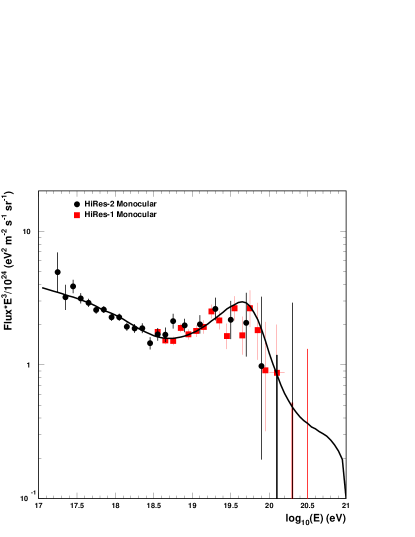
To describe the extragalactic cosmic rays, we assume that all sources have the same power law spectrum, and that cosmic rays lose energy in propagating to the earth by pion and production from the CMBR photons, and by the cosmological red shift[29]. The sources are assumed to be uniformly distributed and to evolve in density by . Figure 9 shows our spectrum result with the best fit superimposed on it. The fitted values and of , the spectral slope of the spectrum at the source, are and .
10 Summary
We have measured the flux of ultrahigh energy cosmic rays from eV to over eV. Our experiment detects atmospheric fluorescence light from cosmic ray showers and performs a calorimetric measurement of cosmic ray energies. We perform calibrations of our detector and measure the light-scattering properties of the atmosphere. The total systematic uncertainty in our spectrum measurement averages 31%.
In our energy range we observe two features in the UHECR spectrum visible through changes in the spectral power law. We observe the ankle at eV. We also have evidence for a suppression at a higher energies, above eV.
This work is supported by US NSF grants PHY-9321949, PHY-9322298, PHY-0098826, PHY-0245428, PHY-0305516, PHY-0307098, by the DOE grant FG03-92ER40732, and by the Australian Research Council. We gratefully acknowledge the contributions from the technical staffs of our home institutions and the Utah Center for High Performance Computing. The cooperation of Colonels E. Fischer and G. Harter, the US Army, and the Dugway Proving Ground staff is greatly appreciated.
References
- [1] A.A. Penzias and R. Wilson, Astrophys. J. 142, 419 (1965); R.H. Dicke et al., Astrophys. J. 142, 414 (1965); G.F. Smoot et al., Astrophys. J. 396, L1 (1992).
- [2] R.J. Protheroe, Topics in Cosmic Ray Astrophysics (ed. M.A. DuVernois, Nova Science Publishing, NY, 1999) and astro-ph/9812055.
- [3] K. Greisen, Phys. Rev. Lett. 16, 748 (1966).
- [4] G.T. Zatsepin and V.A. K’uzmin, Pis’ma Zh. Eksp. Teor. Fiz. 4, 114 (166) [JETP Lett. 4, 78 (1966)].
- [5] R. Abbasi et al., Phys. Rev. Lett. 92, 151101 (2004).
- [6] R. Abbasi et al., to appear in Astropart. Phys., astro-ph/0208301.
- [7] D.J. Bird et al., Phys. Rev. Lett. 71, 3401 (1993).
- [8] M. Takeda et al., Astropart. Phys. 19, 447 (2003).
- [9] M. Ave et al., Astropart. Phys. 19, 47 (2003).
- [10] F. Kakimoto et al., Nucl. Inst. and Meth. A 372, 527 (1996); M. Nagano et al., Astropart. Phys. 20, 293 (2004); J. Belz et al. (FLASH Collaboration), in preparation.
- [11] C. Song, Z. Cao et al., Astropart. Phys. 14, 7 (2000).
- [12] T. Abu-Zayyad et al., Proc. 26th Int. Cosmic Ray Conf. (Salt Lake City), 5, 349 (1999).
- [13] J. Boyer, B. Knapp, E .Mannel, and M. Seman, Nucl. Inst and Meth. A 482, 457 (2002).
- [14] J.H.V. Girard et al., Nucl. Inst and Meth. A 460, 278 (2001).
- [15] J.N. Matthews and S.B. Thomas for the HiRes Collaboration, Proc. 28th Int. Cosmic Ray Conf. (Tsukuba), 911 (2003).
- [16] K. Martens and L. Wiencke for the HiRes Collaboration, Proc. 28th Int. Cosmic Ray Conf. (Tsukuba), 485 (2003); L. Wiencke for the HiRes Collaboration, Proc. 27th Int. Cosmic Ray Conf. (Hamburg), 635 (2001).
- [17] A. Zech, Ph.D. thesis, Rutgers University, 2004 (http://www.physics.rutgers.edu/~aszech/thesis.html).
- [18] T. Gaisser and A.M. Hillas, Proc. 15th Int. Cosmic Ray Conf. (Plovdiv), 8, 353 (1977).
- [19] T. Abu-Zayyad et al., Astropart. Phys. 16, 1 (2001).
- [20] D. Heck, J. Knapp, J.N. Capdevielle, G. Schatz and T. Thouw “CORSIKA : A Monte Carlo Code to Simulate Extensive Air Showers”, Report FZKA 6019 (1998), Forschungszentrum Karlsruhe.
- [21] N.N. Kalmykov, S.S. Ostapchenko and A.I. Pavlov, Nucl. Phys. B (Proc. Suppl.) 52B, 17 (1997).
- [22] T. Abu-Zayyad et al., Phys. Rev. Lett. 84, 4276 (2000).
- [23] R. Abbasi et al., Astrophys.J. 622, 910 (2005).
- [24] A. Zech, Proc. of the Cosmic Ray Int. Sem. (CRIS’04), Nucl. Phys. B - Proc. Supl. 136, 34 (2004).
- [25] The spectrum is available in tabular form at http://www.physics.rutgers.edu/~dbergman/HiRes-Monocular-Spectra.html.
- [26] S. Baker and R. Cousins, Nucl. Inst. and Meth. 221, 437 (1984).
- [27] E. Waxman, Astrophys. J. Lett. 452, L1 (1995); J.N. Bahcall and E. Waxman, Phys. Lett. B556, 1 (2003).
- [28] J. Linsley, Proc. 18th Int. Cosmic Ray Conf. (Bangalore), 12, 135 (1983).
- [29] V. Berezinsky, A.Z. Gazizov, S.I. Grigorieva, hep-ph/0204357; S.T. Scully and F.W. Stecker, Astropart. Phys. 16, 271 (2002); De Marco, Blasi, Olinto, Astropart. Phys. 20 (2003) 53.