11email: soltan@camk.edu.pl (AMS)
2 MPI für extraterrestrische Physik, Giessenbachstraße, 85748 Garching, Germany
11email: mjf@mpe.mpg.de (MJF)
11email: ghasinger@mpe.mpg.de (GH)
Signs of WHIM in the soft X-ray background
Small angular scale structure of the soft X-ray background correlated with the galaxy distribution is investigated. An extensive data sample from the ROSAT and XMM-Newton archives are used. Excess emission below keV extending up to at least Mpc around galaxies is detected. The relative amplitude of the excess emission in the keV band amounts to % of the total background flux. A steep spectrum of the emission at higher energies is indicated by a conspicuous decline of the signal above keV. The XMM-Newton EPIC/MOS data covering wider energy range than the ROSAT PSPC are consistent with a thermal bremsstrahlung spectrum with keV. This value is consistent with temperatures of the Warm-Hot Intergalactic Medium derived by several groups from hydrodynamic simulations. Correlation analysis allows for estimate of the average excess emission associated with galaxies but the data are insufficient to constrain physical parameters of the WHIM and to determine the contribution of WHIM to the total baryonic mass density.
Key Words.:
X-rays: diffuse background – large-scale structure of Universe1 Warm-Hot Intergalactic Medium
X-ray telescopes on board the satellites EINSTEIN, ROSAT and Chandra have firmly established the discrete nature of the extragalactic X-ray background (XRB). High angular resolution provided by the imaging optics allowed for isolation of various classes of point-like X-ray sources, leaving unresolved only a small fraction of the total XRB flux.
While the observational evidences are dominated by the discrete sources, theoretical considerations indicate that in the soft X-rays still a non negligible fraction of the XRB should remain in the form of the diffuse component. Apart from clusters of galaxies which have been recognized sources of the extended emission since the beginning of X-ray astronomy, a substantial amount of plasma residing in the intergalactic space might be hot enough to emit a noticeable amount of the X-ray flux. Following Cen & Ostriker (1999), several groups performed hydrodynamical simulations which have demonstrated that a significant fraction of baryons in the Universe has not yet accumulated in stars and galaxies. It is estimated that % of the baryonic matter fills the intergalactic space (e.g. Davé et al. 2000). This gas slowly falls toward potential wells created by the (non-baryonic) dark matter. The density and temperature of the infalling material increase and around mass concentrations arise halos of the hot plasma. The spatial distribution and physical parameters of the diffuse gas in the local Universe () are distinctly different from both the matter in galaxies and plasma in clusters of galaxies. This constituent of the baryonic matter is known as WHIM – Warm-Hot Intergalactic Medium (Davé et al. 2000).
The quantitative characteristics of the WHIM as a function of redshift depend on the rate the gas is accumulating. The process is determined by the evolution of the gravitational potential and by the non-gravitational heating, so called feedback (e.g. Zhang & Pen 2002). Details of the feedback, i.e. transfer of energy and matter from galaxies back to the intergalactic medium have been investigated extensively in the literature (e.g. Davé et al. 2000, Bryan & Voit 2001, Croft et al. 2001). Although all these theoretical studies ascertain the WHIM contribution to the soft XRB, the quantitative estimates of the WHIM emission are still rather uncertain.
A potential contribution to the soft XRB from the diffuse component is strongly constrained by the source counts. It appears that the integrated flux produced by sources above the Chandra limit amounts to % in the keV band (Moretti et al. 2003). A smooth extrapolation of counts down to sources fainter by an order of magnitude than the present-day limit gives % of the XRB. Consequently, the diffuse fraction cannot exceed %, though this estimate is subject to large uncertainties. Deep counts in the Lockman Hole by Worsley et al. (2004) using the XMM EPIC cameras show that sources above the detection threshold of few erg cm-2s-1 generate in the keV band % of the integral XRB. The resolved fraction below keV is consistent with %, although, with large uncertainty due to lack of precise measurement of the total flux. Moreover, Sołtan (2003) estimated that roughly % of the soft XRB constitutes purely diffuse component (unrelated to the WHIM emission) due to Thomson scattering of X-ray photons. Thus, the upper limits established for the WHIM are rather restictive and impose important constraints on the feedback models (Bryan & Voit 2001).
Despite the poor understanding of processes involved and limited precision of calculations, hydrodynamical simulations provide information on physical parameters and spatial structure of the WHIM. The advanced models are flexible enough to conform to the observational limits. For instance, the simulations by Croft et al. (2001) predict that in the keV energy band % of the XRB is generated by the intergalactic gas with temperatures in the range of K.
The low emission strength makes the direct detection of the WHIM signal extremely difficult. To search for traces of the extragalactic thermal radiation, Kuntz et al. (2001) analyzed the surface brightness distribution of the ROSAT All-Sky Survey (RASS) at high galactic latitudes. They found that after subtraction of galactic and extragalactic sources and the local extended emission, the data are consistent with the smooth thermal component with keV and amplitude of erg/(s cm2 sr keV) in the keV band. In the discussion the authors stated that the observed signal is probably a mixture of the WHIM and the Galactic halo emission.
All the simulations show that the WHIM emission is strongly correlated with the galaxy distribution. Thus, the straightforward way to look for the WHIM presence is to measure the XRB flux around galaxies and clusters. Recently we have investigated the cross-correlations between the soft X-ray maps of RASS and the galaxy distribution using the Lick counts (Shane & Wirtanen 1967) and Abell cluster catalog (Abell 1958, Abell et al. 1989). Coarse pixel binning of the RASS () and Lick counts () allowed only for the analysis of the correlation signal at relatively large angular separations, effectively above (Sołtan et al. 2002; references to earlier work on this subject therein). Our investigation was also impeded by the narrow useful energy range and the low energy resolution of the RASS maps. The data we used were binned in three overlapping energy bands: R5, R6 and R7 centered at , , and keV, respectively (Snowden et al. 1994).
Our calculations revealed a clear excess of the soft emission associated with the galaxies and clusters. The effect was measured at separations for the Abell clusters and up to for the Lick counts. However, the signal amplitude was weak and we were not able to put strong constraints on the temperature of the emission. At a confidence level of % the temperature was below keV (assuming the thermal bremsstrahlung mechanism).
According to simulations, the surface brightness of the WHIM emission increases sharply as the distance to the gravitational center gets smaller. In the present investigation we analyze the distribution of the XRB intensity around galaxies at few arc min scales, where the expected signal should by stronger. In Sect. 2 the observational material is described. Calculations and main results are presented in Sect. 3 while in Sect. 4 we shortly discuss limitations of the present work.
2 Observational data
Both simulations (Croft et al. 2001) and extrapolation of our results based on the RASS (Sołtan et al. 2002) show that the strength of the WHIM emission is low in comparison with the total soft XRB even within arc min from a typical galaxy in the sample. It appears that the amplitude of the the cross-correlation function (CCF) of the soft XRB and galaxy distribution generated by WHIM at separations above would not exceed a couple of percent. To detect fluctuations of the XRB at such low level, scrupulous analysis of an extensive data sample is required.
2.1 PSPC data
The central area of the ROSAT PSPC field of view (unobstructed by the window supporting structure) is a circle of diameter. Similar size, albeit of more complex shape, have the field of view of the XMM-Newton EPIC/MOS cameras. The excellent characteristics of the ROSAT X-ray telescope – PSPC combination make this instrument well suited for searches of the low amplitude fluctuations of the XRB. The PSPC has strikingly smooth sensitivity over the entire field of view. The X-ray telescope introduces practically negligible vignetting within the central area and contamination of the accepted counts by the particle background is also quite low.
In a single ROSAT observation with the exposure time of s, typically PSPC counts are recorded in the central area in the band R5 and R6, and counts in R7 (if there are no bright sources in the field). To detect relative fluctuations with the amplitude of at high significance level, one needs a large number of observations. In order to maximize the signal-to-noise ratio, all the ROSAT PSPC pointings at high galactic latitude, devoid of bright or known extended sources, available in the archive have been used.
Since we concentrate on the diffuse extragalactic signal, only pointings satisfying stringent criteria have been included in the analysis. In particular, pointings at known extended sources (SN remnants, clusters of galaxies, nearby galaxies) have been excluded. In selecting “good” observations we generally followed criteria used by Sołtan et al. (2001) to build a sample of observations suitable for the investigation of the autocorrelation function of the soft XRB. In the present analysis we used also observations at high galactic latitudes from the south galactic hemisphere.
From nearly 300 PSPC observations we have selected 217 for further processing. The sample contained pointings with the Galactic hydrogen column density below cm-2. Next, all the sources detected in each energy band have been removed. We have applied the Poissonian statistics to search for point-like enhancements exceeding the threshold. Such procedure effectively eliminates all high amplitude non-homogeneities of the count distribution and substantially reduces noise of the CCF. Also, circular areas around all clusters and groups of galaxies found in the NASA/IPAC Extragalactic Database (NED) have not been used in the CCF calculations. After the removal of all the sources and clusters, total numbers of counts in the data amount to in the band R5, in R6 and in R7.
2.2 EPIC/MOS data
A large collective area of the X-ray telescopes of the XMM-Newton Observatory gives higher count rates as compared to the ROSAT PSPC. Also a wide energy range and good energy resolution contribute to the unique quality of the data. However, investigation of the extended diffuse emission is hampered by strong vignetting of the telescope, highly variable non–X-ray background and imperfections of the CCD detectors. All these effects could be accounted for with relative ease in case of the point source analysis, but pose a serious problem for the investigation of the smoothly varying signal. Elaborated procedures to deal successfully with the instrumental effects in the context of the background measurements are presented by Lumb et al. (2002), Read & Ponman (2003) and De Luca & Molendi (2004). These investigations allow to measure the absolute level of the cosmic signal with the accuracy of several percent. In the present investigation we do not attempt to determine the net XRB flux, but we concentrate on the XRB fluctuations correlated with the galaxy distribution. Although the expected amplitude of this signal is smaller than uncertainties of the total XRB measurements, the correlation analysis can be used to isolate effectively the WHIM emission.
To select observations suitable for the present investigation, criteria analogous to the PSPC pointings have been applied. In preparation of the data we generally followed prescriptions by Snowden et al. (2002). The data have been divided into four energy bands: keV (band X1), keV (X2), keV (X3) and keV (X4). For the band X1 only pointings with the Galactic hydrogen column density cm-2 have been used, for band X2 – pointings with cm-2, and for bands X3 and X4 – pointings with cm-2. All the data in the public archive obtained with the MOS1 and MOS2 detectors have been used. After excluding pointings with bright sources and known extended sources, the total number of usable pointings reached 150. All point-like enhancements present in the data have been removed in a similar way as in the PSPC observations.
Because of the vignetting the count distribution within the field of view is highly nonuniform. Exposure maps created for each energy band include vignetting effects. To compensate vignetting, one should correct the image focused by the X-ray telescope using the exposure map. However, amount of contamination by the non-vignetted counts varies in time and for each pointing is different (Read & Ponman 2003). In effect, the vignetting corrections are not adequately described by the exposure map and have to be determined for each observation separately. Also, the source extraction introduces some additional bias for the vignetting amplitude. Amount of the removed photons depends on the exposure time (for longer exposures a larger fraction of the XRB is decomposed into recognized sources). Thus, the deep exposures are relatively more contaminated by the non-vignetted counts.
To minimize gradients of the count distribution generated by the telescope the following procedure has been applied. We assumed that some, a priori unknown, fraction of counts, , is subject to the vignetting while the remaining counts are free from the vignetting and are distributed randomly in the field of view. Thus, the large scale variations observed in the integral counts have smaller relative amplitude than implicated by the exposure map, . The effective exposure correction, , applicable to the actual observation was assumed to have the form:
| (1) |
where is the average exposure time. The observed counts were divided by the array and the resulting “corrected” counts were fitted to the flat distribution. The value of was adjusted using the maximum-likelihood method. The calculations have been performed separately for each observation, energy band (X1, …, X4) and detector (MOS1 and MOS2)
2.3 Galaxy data
For all the X-ray observations (PSPC and EPIC/MOS) the NED has been searched for galaxies brighter than mag or within the redshift range of . Nearly objects have been extracted from the database. Clearly, the selected galaxies do not constitute a complete or homogeneous sample. Pointings are covered by a variety of galaxy surveys. In effect, the number of galaxies within the field of view of the individual pointing depends on the specific survey characteristics and to less extent reflects statistical properties of the galaxy population at the selected magnitude limits. Nevertheless, galaxies found within the field of view of each pointing separately represent an unbiased set of objects suitable for calculations of the CCF with the X-ray photon distribution.
3 Diffuse emission in the PSPC and EPIC/MOS observations
To estimate the average intensity of the XRB at distance from a randomly chosen galaxy we use the formula:
| (2) |
where the sums extend over all pointings and all galaxies, denotes total number of counts recorded in pixels separated by angle from the galaxy and is the exposure time of the observation. All the PSPC data were binned into pixels and EPIC/MOS into . In the absence of any signal correlated with galaxies, one should expect , the average XRB flux.
3.1 PSPC
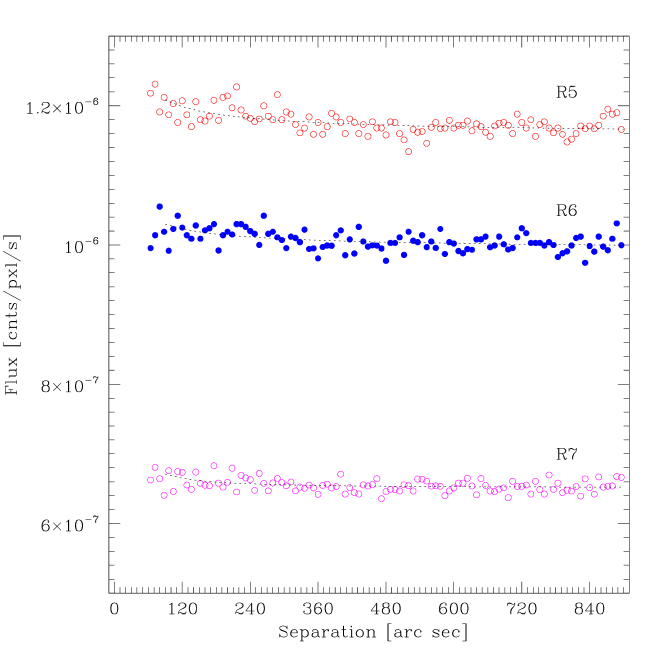
The distributions of in the three energy bands, R5, R6, and R7, are shown in Fig. 1. Scatter of points for each energy band is slightly larger than the statistical noise implied by the number of “galaxy – X-ray count” pairs. Additional fluctuations of the are generated by weak sources not removed from the data. A quantitative analysis of plots in Fig. 1 reveals weak but statistically significant systematic trends in all three bands. The null hypothesis that over the separation range of is rejected at in the band R5, in R6, and in R7. The S/N ratio is assessed under the assumption that uncertainties of all points (for each band separately) are equal. To test the efficiency of our analysis, analogous calculations have been performed in which we searched for the possible enhancements of the soft X-ray emission around quasars and known weak X-rays sources. Since the great majority of objects in those two categories are much more distant than objects in the galaxy sample, we have not expected to detect any correlation signal. Unfortunately, the number of objects in this “test sample” was much smaller than number of galaxies. Because of that uncertainties of the CCF estimates have been substantially larger. Nevertheless, the differences between the galaxy and the test sample were significant. No X-ray enhancements around the test objects have been detected and in the soft band R5 the test data were incompatible with the galaxy signal at the level of .
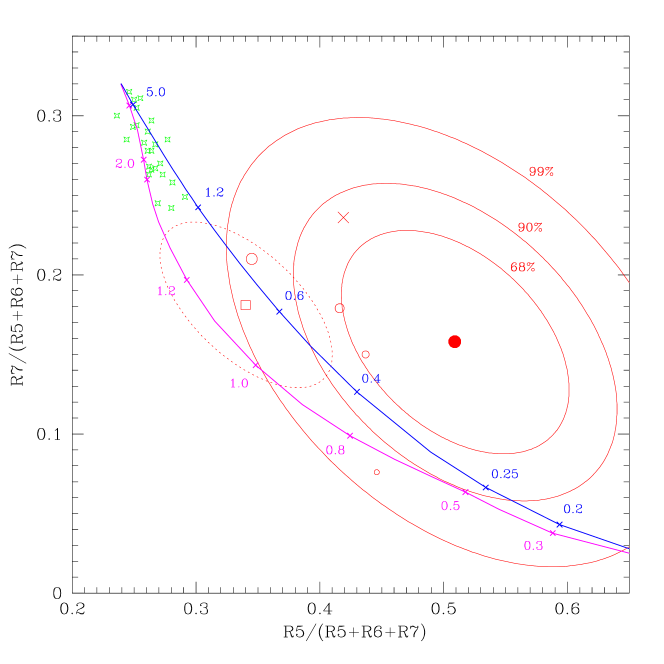
To measure the excess emission correlated with the galaxy distribution linear fits to the plots in Fig. 1 have been calculated. The slopes of those fits for three energy bands determine the enhancements potentially generated by the WHIM. These data were then used to construct the X-ray “colour-colour” diagram shown in Fig. 2 in the same way as the diagrams for the RASS maps in Sołtan et al. (2002). A large solid dot indicates a position of the excess emission. Solid ellipses define %, % and % confidence limits based on the simulations. The large cross situated above the center of the plot gives the average colours of the integral XRB.
Curves in Fig. 2 show the loci of the thermal emission: the upper curve indicates colours of the bremsstrahlung, while the lower curve – plasma emission with metal abundances reduced to % of cosmic abundances. Labels give temperatures in keV. The X-ray colours of the enhancements found by Sołtan et al. (2002) in the RASS maps are shown with open symbols. The open square denotes the colours around the Abell clusters (the dotted ellipse represents the % confidence limits), and open circles – around galaxies. The enhancements are integrated between and for clusters, while for the Lick counts the results are shown for separation bins: , , , and , where the smaller symbol in Fig. 2 refers to the larger separation. For both samples corresponds to several Mpc and it is likely that some contribution to the X-ray halos detected in the RASS is generated not only by the diffuse WHIM emission, but also by the hot gas in poor groups of galaxies which surround the rich Abell clusters and have typical temperatures of the order of K.
Stars in the upper left corner show the colours of “normal” clusters of galaxies selected from the ROSAT archives. Clear separation of clusters and the extended emission in Fig. 2 demonstrates that at least substantial fraction of the diffuse emission correlated with galaxies does not originate in the “unknown” clusters but represents a distinct component of the soft XRB.
Next, we have tried to fit the observed variations of the the X-ray surface brightness enhancements around galaxies by a power law:
| (3) |
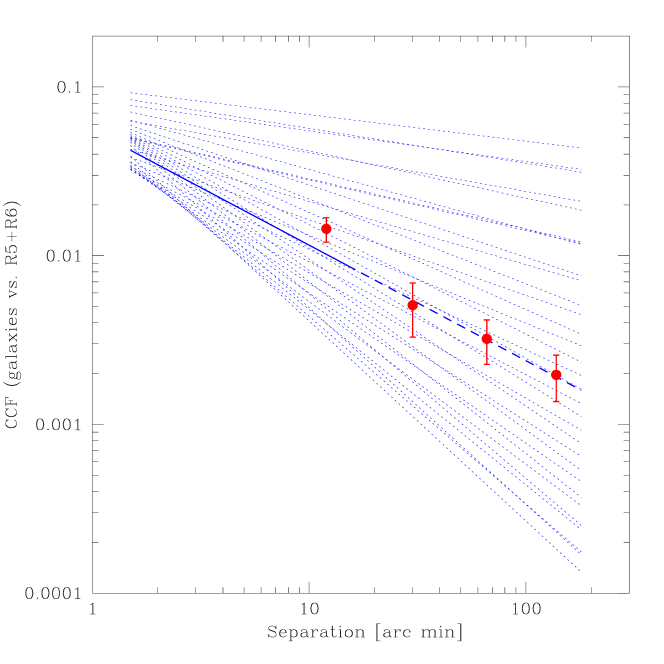
with three a priori unknown parameters , and , where represents the XRB component uncorrelated with galaxies. In this case, however, the signal-to-noise ratio was too low to obtain restrictive limits for the interesting parameters. The best fit values for the slope were equal to for bands R5 and R6 and for R7, but the range of uncertainties was wide at any reasonable significance level. To improve statistics, we have repeated all the calculations using merged bands R5 and R6. The allowed range of fits still covers a large area in parameter space (Fig. 3). This is mostly because the data cover a narrow range of separations. Additionally, we do not have a priori sufficiently accurate information on and all three parameters have to be fitted simultaneously.
In Fig. 3 we plotted also the CCF of the RASS with the galaxy distribution of the Lick counts (see Sołtan et al. (2002) for the details of calculations). Error bars represent uncertainties based on the simulations. Near perfect agreement between the ROSAT pointings and the All-Sky Survey is to some extent accidental, since the galaxy samples in both investigations have different statistical properties; in particular they have different magnitude limits and undoubtedly different redshift distributions. It is evident, however, that estimates of the CCF at small separations are consistent with the extrapolation based on the RASS.
3.2 EPIC/MOS
Search for the WHIM emission in the EPIC/MOS observations was realized in a similar way as with the PSPC data. First, we have determined the in four energy bands. Te eliminate residual effects introduced by vignetting, we have compared the real data with data from simulations. In a single simulation run the distribution of galaxies in each pointing was randomized and the calculations of were performed in the same way as for the real data. Then, the CCF of the X-ray and galaxy distributions was obtained by subtraction of the averaged simulated countrates from the observed data. For four energy bands 30 full simulation runs have been performed. The rms scatter between simulated functions was used as estimator of uncertainties in the real data.
| Band | Energy (keV) | Countrates [cnt/pxl/s] |
|---|---|---|
| X1 | 0.3 – 0.5 | |
| X2 | 0.5 – 1.0 | |
| X3 | 1.0 – 2.0 | |
| X4 | 2.0 – 4.5 |
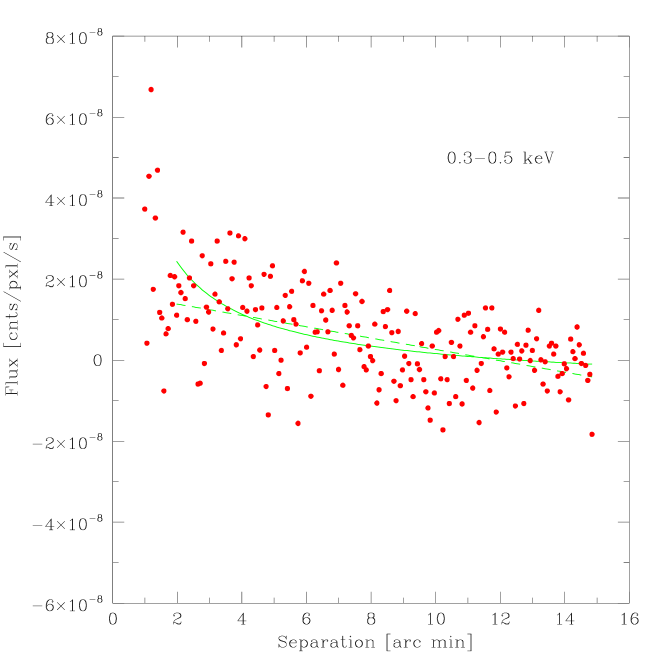
Despite the large number of pointings used in the present calculations, the signal-to-noise ratio of the correlation measurement is still low. In Fig. 4 the CCF of the energy band X1 ( keV) is shown with the two best fits to the data points for separations between and : linear (dashed line) and power law with (solid curve). Clearly, the S/N ratio is too low to distinguish between those two solutions. Nevertheless, the CCF signal is detected at a decent significance level. The slope of the linear fit differs from zero by more than .
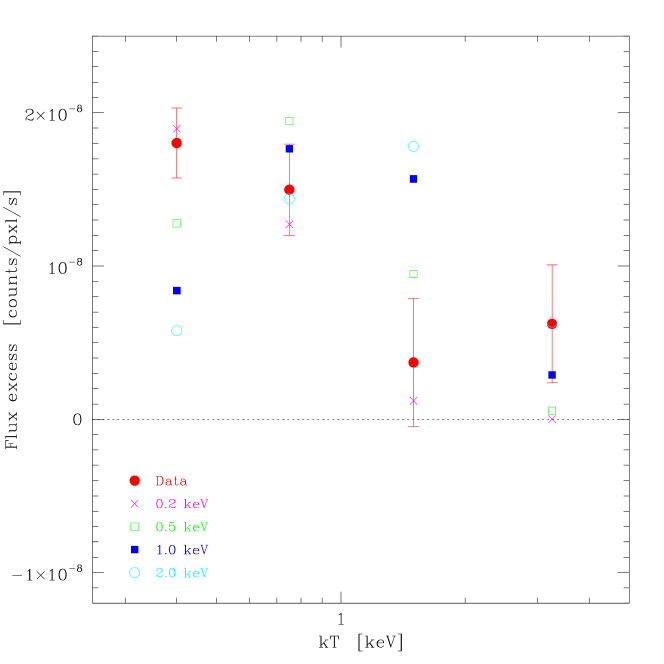
Using the slope determination we estimated the average excess countrate at separation of above the level measured at . The results for four energy bands are listed in the Table 1 and shown in Fig. 5. Then, we have convolved the thermal bremsstrahlung spectra with the effective area of the X-ray telescope/EPIC MOS detectors system and fitted the resulting counts in four energy bands to the observed signal. The predicted counts of thermal emission for , , and keV are also plotted in Fig. 5.
The spectrum of the observed enhancements correlated with the galaxy sample is roughly consistent with the thermal emission with keV and becomes incompatible with keV. The amplitude of the signal is, however, very weak. In the band X1 ( keV) it amounts roughly just to % of the total countrate.
Although, both the PSPC and EPIC/MOS data show traces of the WHIM emission, the amplitude of the signal obtained from the PSPC is roughly by a factor of 2 greater than from the EPIC/MOS. We have compared the amplitudes of the correlated emission in the band R5 and X2, as they cover similar energy ranges. Assuming a temperature of the bremsstrahlung emission keV, and correcting for effects of the absorption by cold gas in the Galaxy111The average hydrogen column density in the ROSAT sample amounts to cm-2, while in the XMM sample – cm-2. the excess surface brightness in the energy band keV measured by ROSAT is equal to erg/(cmsdeg2), while the XMM-Newton data provide erg/(cmsdeg2). Two factors could contribute to this difference. First, the observational material is heterogeneous. It spans a wide range of exposure times. In particular, the XMM-Newton sample covers more than deg2, but half of the counts comes from just above deg2. The distribution of exposures in the ROSAT sample is also very nonuniform. Consequently, the effective area of the survey is much smaller than the total area and it is possible that the effect of cosmic variance is partially responsible for different results.
Second, the galaxies selected from NED also constitute highly heterogeneous sample. Although the selection criteria for the PSPC and EPIC/MOS observations were identical, the average apparent magnitudes and surface density of galaxies are substantially different in both samples. The average galaxy magnitude selected in the EPIC/MOS data is fainter by mag than in the PSPC data. It is difficult to assess impact of those systematic effects, but it is likely that galaxies selected in the EPIC/MOS observations are on the average more distant than in the ROSAT observations and the measured CCF signal at fixed angular separation is weaker.
The amplitudes measured by both instruments differ by , where denotes just the statistical uncertainty introduced by both instruments. To compare measurements reduced to physical units one needs assessments of systematic errors which in the present investigation are not well determined.
4 WHIM emission - prospects for the quantitative study
Extensive search for fluctuations of the soft XRB using two excellent instruments – ROSAT PSPC and XMM-Newton EPIC/MOS – has led to the detection of extremely weak signal which most likely represents the WHIM emission. Although virtually all the available observational material (several hundreds of pointings) has been used, the signal-to-noise ratio does not allow for the quantitative study of physical properties of the WHIM. A strong dependence of the observed signal on energy is highly suggestive and – if the thermal mechanism is assumed – indicates temperatures below keV. Still, the data are insufficient to determine the density or temperature distributions of the emitting gas.
Correlation analysis provides information on the average amplitude and temperature of the WHIM emission. Simulations show, however, that both density and temperature of the intergalactic medium cover a wide range of magnitudes (Bryan & Voit 2001, Croft et al. 2001). To investigate physical parameters of the WHIM, one needs sensitive observations of a definite WHIM cloud associated with the individual concentration of galaxies. The present analysis shows that in the soft XRB the WHIM signal amounts to % of the total XRB. It seems that such a low threshold for the diffuse emission is below the sensitivity of the present-day instruments using wide energy bands. However, presence of strong lines in the thermal bremsstrahlung of optically thin plasma at temperatures expected for the intergalactic plasma could make the investigation of the WHIM possible. To test the feasibility of this approach we plan to search for characteristic spectral features of the XRB in the vicinity of selected galaxies using the EPIC/MOS observations.
ACKNOWLEDGMENTS. The ROSAT project has been supported by the Bundesministerium für Bildung, Wissenschaft, Forschung und Technologie (BMBF/DARA) and by the Max-Planck-Gesellschaft (MPG). We thank all people involved in the XMM-Newton project for making the XMM Science Archive and Standard Analysis System friendly environments. AMS thanks the Max-Planck-Gesellschaft for support. This research has made use of the NASA/IPAC Extragalactic Database (NED) which is operated by the Jet Propulsion Laboratory, California Institute of Technology, under contract with the National Aeronautics and Space Administration. This work has been partially supported by the Polish KBN grant 1 P03D 003 27.
References
- Abell (1958) Abell, G. O., 1958, ApJ Suppl., 3, 211
- Abell et al. (1989) Abell, G. O., Corwin, H, G. Jr. & Olowin, R. P. 1989, ApJ Suppl., 70, 1
- Bryan & Voit (2001) Bryan, G. L. & Voit, G. M. 2001, ApJ, 556, 590
- Cen & Ostriker (1999) Cen, R. & Ostriker, J. P. 1999, ApJ 514, 1
- Croft et al. (2001) Croft, R. A. C., Di Matteo, T., Davé, R., et al. 2001, ApJ, 557,67
- Davé et al. (2000) Davé, R., Cen, R., Ostriker, J. P., et al. 2000, ApJ, 552, 473
- De Luca & Molendi (2004) De Luca, A. & Molendi, S. 2004, A&A, 419, 837
- Kuntz et al. (2001) Kuntz, K. D., Snowden, S. L., & Mushotzky, R.F. 2001, ApJ 548, L119
- Lumb et al. (2002) Lumb, D. H., Warwick, R. S., Page, M., De Luca, A. 2003, A&A, 389, 93
- Moretti et al. (2003) Moretti, A., Campana, S., Lazzati, D., & Tagliaferri, G. 2003, ApJ, 588, 696
- Read & Ponman (2003) Read, A. M. & Ponman, T. J. 2003, A&A, 409, 395
- Shane & Wirtanen (1967) Shane, C. D. & Wirtanen, C. A. 1967, Publ. Lick Obs., Vol. XXII - part I
- Snowden et al. (1994) Snowden S.L., McCammon D., Burrows D. & Mendenhall J.A. 1994, ApJ 424, 714
- Snowden et al. (2002) Snowden, S., Immler, S., Arrida, M. et al. 2002, http://heasarc.gsfc.nasa.gov/docs/xmm/abc/
- Sołtan (2003) Sołtan A. M. 2003, A&A, 408, 39
- Sołtan et al. (2002) Sołtan A. M., Freyberg, M., Hasinger G. 2002, A&A, 395, 475
- Sołtan et al. (2001) Sołtan A. M., Freyberg, M., Trümper, J. 2001, A&A, 378, 735
- Worsley et al. (2004) Worsley, M. A., Fabian, A. C., Barcons, X. et al., 2004, MNRAS, 352, L28
- Zhang & Pen (2002) Zhang, P. J., & Pen, U. L. 2002, ApJ, 588, 704