Evolutionary Stellar Population Synthesis at High Spectral Resolution: Optical Wavelengths
Abstract
We present the single stellar population (SSP) synthesis results of our new synthetic stellar atmosphere models library with a spectral sampling of 0.3 Å, covering the wavelength range from 3000 Å to 7000 Å for a wide range of metallicities (twice solar, solar, half solar and 1/10 solar). The stellar library is composed of 1650 spectra computed with the latest improvements in stellar atmospheres. In particular, it incorporates non-LTE line-blanketed models for hot ( K), and LTE line-blanketed models (Phoenix) for cool ( K) stars. Because of the high spectral resolution of this library, evolutionary synthesis models can be used to predict the strength of numerous weak absorption lines and the evolution of the profiles of the strongest lines over a wide range of ages. The SSP results have been calculated for ages 1 Myr to 17 Gyr using the stellar evolutionary tracks provided by the Geneva and Padova groups. For young stellar populations, our results have a very detailed coverage of high-temperature stars with similar results for the Padova and Geneva isochrones. For intermediate and old stellar populations, our results, once degraded to a lower resolution, are similar to the ones obtained by other groups (limitations imposed by the stellar evolutionary physics notwidthstanding). The limitations and advantages of our models for the analysis of integrated populations are described. The full set of the stellar library and the evolutionary models are available for retrieval at the websites http://www.iaa.csic.es/rosa and http://www.iaa.csic.es/mcs/Sed@, or on request from the first two authors.
keywords:
galaxies: evolution – galaxies: stellar content – stars: evolution.1 Introduction
Evolutionary synthesis, introduced by Tinsley (1968), is a powerful tool for interpreting the integrated light of a stellar population. This technique makes a prediction for the properties of a stellar population taking as a free parameter the star formation rate, the initial mass function (IMF) and the metallicity. During the past decade, evolutionary synthesis models have been developed and improved significantly, using the newest and more advanced stellar evolutionary tracks and stellar libraries (e.g. Cerviño & Mas-Hesse, 1994; Fioc & Rocca-Volmerange, 1997; Leitherer et al., 1999; Vazdekis, 1999; Buzzoni, 2002a; Schulz et al., 2002; Bruzual & Charlot, 2003). In addition, they have been extended to new wavelength domains (e.g. Cerviño et al., 2000; Cerviño, Mas-Hesse, & Kunth, 2002, for and X-rays respectively). However, it is also well known that the power of this technique is very dependent on the reliability of the stellar models and libraries used as ingredients (Leitherer, Fritze- v.Alvensleben, & Huchra, 1996, and references therein), as well as on the size of the system to which the models are applied Cerviño, Luridiana, & Castander (2000); Bruzual (2002); Cerviño et al. (2001, 2002); Cerviño & Luridiana (2004); Gilfanov, Grimm, & Sunyaev (2004). One important question related to this technique is whether it is actually up to the challenge of interpreting multi-wavelength data to infer the properties of stellar populations of very different ages and metallicities (e.g. Origlia et al., 1999; Massey & Olsen, 2003).
In recent years, numerous observational surveys have been undertaken to measure the redshift evolution of the stellar properties of distant galaxies, with the goal of understanding the formation and evolution of galaxies. Spectral observations of intermediate and high redshift galaxies have shown a large variety of stellar populations. The integrated light of these galaxies has been analyzed with evolutionary synthesis models to derive ages, masses and metallicities. At ultraviolet (UV) wavelengths, many of these galaxies show the footprints of recent bursts of star formation. They are classified as star forming galaxies Steidel et al. (1996). The UV spectra of these galaxies, which are very similar to local starbursts, are dominated by resonance lines formed in the interstellar medium and/or in the winds of massive stars Pettini et al. (2000). Observations at rest-frame optical wavelengths of these high redshift galaxies (z 2) are scarce due to the lack of non-cryogenic near-infrared (NIR) multi-object spectrographs in very large telescopes. H nebular emission has been detected in a few of these galaxies. However, as in nearby star forming galaxies Brinchmann et al. (2004), the higher order Balmer lines appear in absorption, or in emission with strong absorption wings. Thus, to estimate the star formation rate in these galaxies requires a careful fit of the stellar continuum and subtraction of the absorption component of the Balmer lines. Evolutionary synthesis models at intermediate or at high spectral resolution are needed to perform this fit.
With this motivation, González Delgado, Leitherer, & Heckman (1999, hereafter GLH99) built synthetic spectra of H Balmer and He absorption lines of starbursts and post-starburst galaxies, using as input to the evolutionary code Starburst99 Leitherer et al. (1999) a stellar library of synthetic spectra, with a sampling of 0.3 Å, effective temperature from 50000 to 4000 K, and gravity in the range 0.0 log g 5.0 at solar metallicity (González Delgado & Leitherer, 1999, hereafter GL99). The line profiles were computed using a set of programs developed by Hubeny and collaborators Hubeny (1988); Hubeny, Lanz, & Jeffery (1995). Due to computational restrictions, we only computed small spectral ranges around the most important Balmer and Hei lines.
Many beautiful data sets on starbursts and galaxies with active galactic nuclei (AGN) have been obtained at intermediate spectral resolution in the last few years to date the stellar population González Delgado, Heckman, & Leitherer (2001); Cid Fernandes et al. (2001); Aretxaga et al. (2001); Kauffmann et al. (2003a, b, c); Cid Fernandes et al. (2004); González Delgado et al. (2004); Tadhunter et al. (2004). These results have motivated us to build a much improved stellar library, both in the mapping of the (, log ) plane and in the complete coverage of the optical spectral range at high spectral resolution. With this new library it is possible to predict the spectral evolution not only of young starbursts but also the properties of old stellar systems. Intermediate or high spectral resolution models are also required to constrain the stellar population in ellipticals, and to break the age-metallicity degeneracy Vazdekis & Arimoto (1999). With this motivation, Bruzual & Charlot (2003) presented models, computed with their code galaxev, at intermediate resolution (3 Å) covering a large range in ages (0.1 Myr to 20 Ga), and wavelengths (3200–9500 Å) for several metallicities. galaxev models are in some aspects similar to those presented in this paper, but they have much lower spectral resolution, different coverage of the (, log) plane and, most importantly, they use empirical stellar spectra. A comparison of the two sets of models is presented Section 5.
This paper is organized as follows. In Section 2, we briefly discuss the stellar library. A more detailed description is given by Martins et al. (2004). Section 3 describes the main stellar ingredients, the assumptions, and the computational techniques of the synthesis models. Section 4 presents the results and a discussion of the spectral evolution of stellar populations, at several metallicities, which evolve according to the Geneva or Padova isochrones. The models are compared with previous work in Section 5, and with observations of star clusters in the Large and Small Magellanic Clouds in Section 6. We discuss the limitation of the models in the red supergiant phase in Section 7. The summary and conclusions are in Section 8.
2 Stellar Library
This stellar library is an extension of the library built by GL99. Here, we present a brief description. A full discussion is given in Martins et al. (2004).
The grid includes the synthetic stellar spectra from 3000 to 7000 Å with a final spectral sampling of 0.3 Å. The spectra span a range of effective temperature from 3000 to 55000 K, with variable steps from 500 to 2500 K, and a surface gravity log to 5.5 with dex steps of 0.25 and 0.5. For each temperature, the minimum gravity is set by the Eddington limit. The library covers several metallicities: twice solar, solar, half and 1/10 solar. We assume solar abundance ratios for all the elements, and a helium abundance of He/H=0.1 by number. In addition to the spectral and metallicity coverage, this new library presents the following improvements with respect to GL99:
-
1.
Hot stars. Line-blanketed, non-LTE, plane-parallel, hydrostatic atmospheres are used to compute the stellar spectra of O-type stars. The spectra are from the grid of Lanz & Hubeny (2003)111Available at http://tlusty.gsfc.nasa.gov. This grid has 12 effective temperatures, K, with 2500 K steps, and eight values of the surface gravity, , with 0.25 dex steps. These models assume a microturbulence velocity of 10 km s-1.
-
2.
Cool stars. Line-blanketed, LTE, spherical atmospheres are computed with the PHOENIX code Hauschildt & Baron (1999); Allard et al. (2001) for stars with K, with steps of 500 K. The grid covers 13 values of surface gravity, , with 0.5 dex steps. The models assume a mass of 1 M, a mixing-length equal to 2.0, and a microturbulence velocity of 2 km s-1.
-
3.
Intermediate temperature stars. As in GL99, the synthetic spectra for stars with K are obtained with Kurucz LTE atmospheres222Available at http://kurucz.harvard.edu/ Kurucz (1993) and the program SYNSPEC333Available at http://tlusty.gsfc.nasa.govHubeny, Lanz, & Jeffery (1995), except that for stars with K, we use the program SPECTRUM444Available at
http://www1.appstate.edu/dept/physics/spectrum/spectrum.html Gray & Corbally (1994), together with Kurucz atmospheres. Differences found between the metallic line strengths and molecular bands using SPECTRUM and SYNSPEC are discussed in Martins et al. (2004).
In all the cases, the maximum distance between two neighboring frequency points for evaluating the spectrum is 0.01 Å. However, the spectra are degraded to have a final resolution of 0.3 Å by performing a rotational and instrumental convolution for each spectrum.
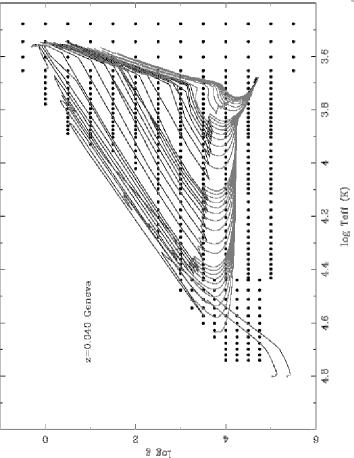
The library contains 415, 409, 416 and 411 spectra for Z=0.002, 0.010, 0.020 (solar) and 0.040, respectively. The typical grid coverage is illustrated in Figure 1. Isochrones obtained with the evolutionary tracks from the Geneva and Padova groups (cf. Section 3) have been over-plotted. The figure illustrates that this library constitutes a homogeneous set of stellar spectra covering a dense grid of fundamental parameters, including a significant number of models that reduce the problems of the close model assignation, assumed in most synthesis codes (see, however, Jamet et al., 2004, for a different approach). This library also presents some improvements with respect to STELIB555Available at http://webast.ast.obs-mip.fr/stelib/ Le Borgne et al. (2003), the stellar library used by galaxev; in particular, it includes models with K, and K and , which allow the prediction of the spectral evolution of the stellar populations of both very young starbursts and old systems. Furthermore, the high spectral resolution of the library allows us to predict the evolution of the Hei and Heii lines, and to estimate the absorption correction to the nebular He emission lines. This correction is very important for an accurate determination of primordial He abundance using nebular emission lines of star forming galaxies.
The full set of the stellar library is available for retrieval at the website (http://www.iaa.csic.es/rosa) or on request from the authors.

3 Description of the inputs
The library has been implemented in Starburst99 and Sed@666Sed@ is a synthesis code included in the Legacy Tool project of the Violent Star Formation European Network. The code is written in ANSI C under GNU Public License and, currently, is coordinated by M. Cerviño; the code and their results must be referred to solely by its documentation, Sed@ Reference Manual (in preparation), its web address and the citations in the headers of the resulting files. More information can be found at http://www.iaa.csic.es/mcs/Sed@. There are no significant differences between the results obtained with the two codes when models with the same ingredients (evolutionary tracks, IMF, ….) are compared. Here, we describe only the assumptions and prescriptions related to Sed@ models.
There is, however, a principal difference in the way the two codes. Starburst99 computes the isochrones from the implemented evolutionary tracks and obtains the results from the implemented atmosphere library. In contrast, Sed@ currently does not compute isochrones, but takes them from the literature if they are in the appropriate format.
3.1 Stellar initial mass function (IMF) and star formation law
The results presented here assume a power law IMF, , where the constant is determined by the total gas mass converted into stars. The slope is that derived by Salpeter (1955). The low-mass and high-mass cutoffs have been chosen as and , respectively (see Girardi & Bica, 1993, for a detailed discussion about the more appropriate choice of the lower mass limit). The IMF is binned into a grid of the initial masses determined by the particular isochrone, and all the stars belonging to the same mass bin are assumed to have exactly the same properties. The synthesis is done directly by adding the different contributions from the stars to all the synthesised wavelengths. Here, we explore only instantaneous burst models, normalized to .
3.2 Stellar evolution and isochrone integration
The models have been computed using the isochrone technique to produce a smooth spectral evolution. This technique was introduced by Charlot & Bruzual (1991) to avoid abrupt changes of the properties of the stellar populations associated with changes in the evolutionary stages of the stars when the mass resolution of the stellar tracks is inadequate. The isochrone synthesis technique is different from the one used by Tinsley & Gunn (1976), takes into account the lifetime of the stars in each evolutionary phases considered, imposing that the number of stars in a given phase of the stellar evolution must be proportional to the life time of such phase of an individual star. Such a condition, the so called Fuel Consumption Theorem, FCT Renzini & Buzzoni (1986); Buzzoni (1989), is specially relevant for the faster phases of the stellar evolution. Although both methods should be equivalent, the results depend on the method used (see Buzzoni, 1995, 2002b, for an extensive discussion).
In this work, two different sets of stellar isochrones are used. The first one is the set of isochrones from the Padova group by Bertelli et al. (1994) and Girardi et al. (2000) presented in Girardi et al. (2002)777The full set is available at http://pleiadi.pd.astro.it/, with metallicities Z=0.019 (solar), 0.008 and 0.004 (hereafter Padova isochrones). The initial mass resolution of the used Padova isochrones is sufficient to assure a correct integration of the isochrone-IMF product. These models follow the evolution from the zero-age main sequence to the early asymptotic giant branch (AGB) and to the first thermal pulse, or to the carbon ignition depending on the initial mass. They cover an age range from 4 Myr to 17 Ga in a set of 74 isochrones with a 0.06 log time sampling. An additional set at Z= 0.030 and 0.002 is also available on the Padova web server but it comprises a smaller range of ages (0.063 to 15.8 Gyr). We note that there are different sets of isochrones released by the Padova group, in particular, the isochrones from Marigo & Girardi (2001) fulfill the FCT requirements, unfortunately such isochrones do not cover the early ages of the evolution of stellar clusters. In this work we only present the results for the quoted Bertelli et al. (1994) and Girardi et al. (2000) set of isochrones.
Our second set has been computed from the list of non-rotating tracks of the Geneva group Schaller et al. (1992); Schaerer et al. (1993a, b); Charbonnel et al. (1993), including standardmass-loss rates computed at five metallicities: Z=0.040, 0.020 (solar), 0.008, 0.004 and 0.001888Note that the default in Starburst99 are the ”enhanced”, not the ”standard” mass-loss rate.. These tracks include all the phases of the stellar evolution from the zero-age main sequence to the end of the giant branch or the carbon ignition. The Geneva isochrones are calculated by means of a parabolic interpolation between the tracks (log M, log tk) in the HR diagram on a variable mass grid as prescribed in Cerviño et al. (2001). This prescription is also used for the isochrone computations in Starburst99. The isochrones were generated at specific ages with a variable time step: Myr for 1-10 Myr, Myr for 10-100 Myr, Myr for 100 Myr to 1 Gyr, and Gyr for 1-10 Gyr. Unfortunately this computation of the isochrones did not assure the FCT requirements (but it is partially implicit in the use of the parabolic interpolations), neither did it include the evolution of stars in the horizontal branch or later phases, which are quite relevant for the resulting spectrum at ages older than 1Gyr999The Geneva group also produces evolutionary tracks from the begining of the horizontal branch to the first thermal pulse in the AGB phase Charbonnel et al. (1996). However, these evolutionary phases have not been included due to the variations of the number of equivalent evolutionary points depending on the initial stellar mass.. We refer to Lançon et al. (2001) and Vázquez & Leitherer (2004) for other details about the completeness of the evolutionary phases and their relevance in the isochrones.
Since we are working with SSPs, we do not need to treat chemical evolution self-consistently in the evolutionary tracks. Therefore each star generation has the same metallicity during the evolution. On the other hand, the chemical evolution in the atmosphere of the individual stars has not been considered in the isochrone-atmosphere model assignation.
Because the isochrone metallicities do not coincide totally with the stellar atmospheres metallicities, we compute the models combining the isochrones and atmospheres as follow: isochrones at Z= 0.040 and 0.030 with the twice solar atmospheres; isochrones at Z= 0.020 and 0.019 with the solar atmospheres; isochrones at Z= 0.008 and 0.004 with the half solar atmospheres; and isochrones at Z= 0.001 with the 1/10 solar atmospheres.
4 Results
We are presenting the model predictions for the spectral evolution of single stellar populations. First, we describe the spectral energy distribution in the 3000–7000 Å range. Then, we present the spectral evolution of the hydrogen and helium lines (section 4.2) and of the metallic lines (section 4.3). The effect of metallicity on the spectra is illustrated, and the models are discussed for two different isochrone sets (Geneva and Padova).
4.1 Spectral evolution
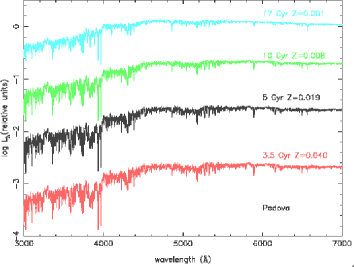
Figure 2 shows the spectral evolution of a single stellar population with solar metallicity at seven different ages of 4 Myr, 10 Myr, 50 Myr, 200 Myr, 1 Gyr, 3 Gyr, and 10 Gyr. The first effect to notice is the decrease with time of the stellar population luminosity, due to the most massive stars dying off. The second effect is the change in the shape of the continuum with time, up to a few Gyr; this is a consequence of the large variation of the effective temperature of massive and intermediate mass stars during their evolution. However, after 3 Gyr, the shape of the optical continuum is almost constant because low mass stars evolve within a small range of effective temperature. This results from the strong concentration of the isochrones at ages older than 3-4 Gyr (see Figure 1). Additionally, Figure 2 illustrates the strong time evolution of the Balmer and the 4000 Å breaks. The evolution of the strength of the Balmer lines is also striking. They have a maximum around 400 Myr, when A stars dominate the optical continuum.
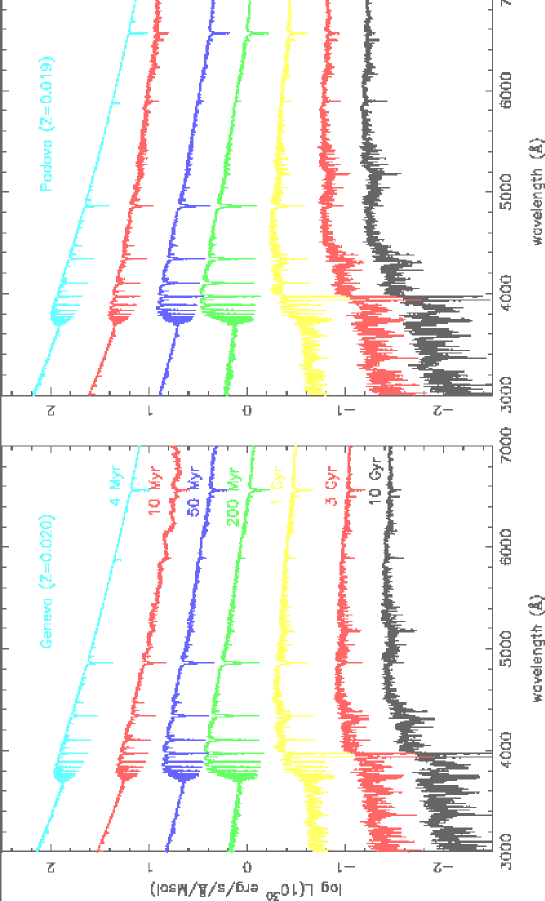
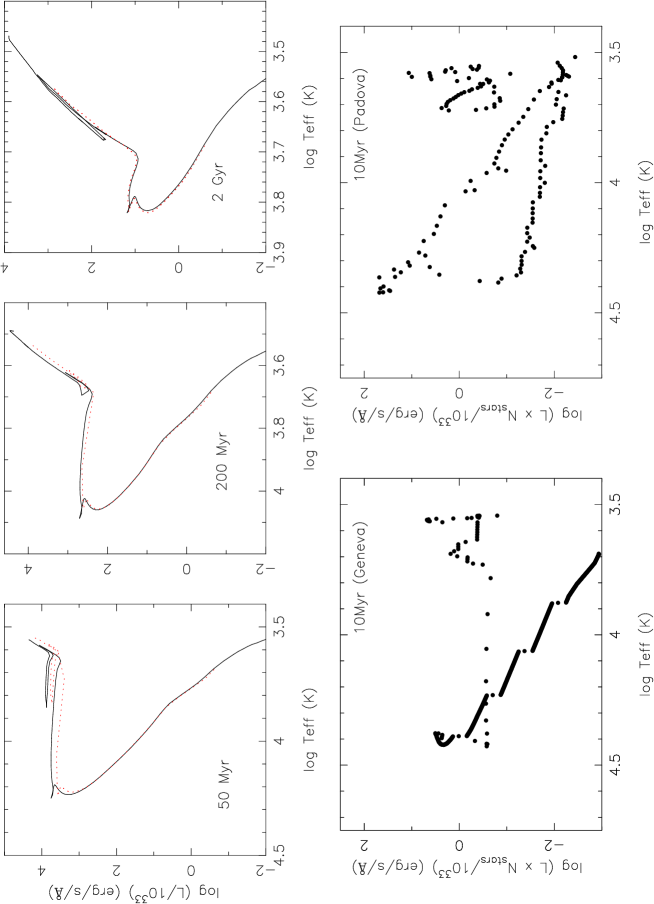
Figure 2 also shows that Geneva and Padova models have similar overall spectral characteristics; however, several detailed differences are clearly visible in this figure. First, the spectra obtained with the Padova models are always more luminous than the corresponding Geneva spectra. Second, the continuum shapes diverge in several stages of the evolution. For example, at older ages ( Gyr), the Padova spectra are systematically redder than Geneva’s due to the inclusion of more evolved phases after the tip of the red giant branch, and the absence of low-mass stars101010Note that the Geneva tracks are truncated at 0.8 M while the Padova isochrones include stars with mass M 0.2 M. According with Vázquez & Leitherer (2004), the differences between Padova and Geneva models are mainly due to this truncation. . These phases and low-mass stellar tracks are not included in the Geneva isochrones. However, at younger ages ( Myr), there is no systematic change of the shape of the continuum, with the Padova spectra bluer or redder than Geneva depending on the given age. These differences result directly from the isochrones (Figure 3). For example, at 50 Myr, the main sequence turnoff in the Padova isochrones is bluer than in Geneva, and the coolest stars in the Geneva tracks have lower than in the Padova models; these differences make the Padova spectrum bluer than the Geneva spectrum at 50 Myr. A significant difference between both sets of models is at RSG ages, i.e., 10 Myr at solar metallicity. At this age, the Geneva spectrum is steeper and shows stronger metallic bands at red wavelengths ( 5500 Å) than the Padova spectrum. These differences are produced by a larger contribution of cool and low gravity stars (Teff 4000 K, and log 0) to the total luminosity in the Geneva with respect to the Padova models (Figure 3).
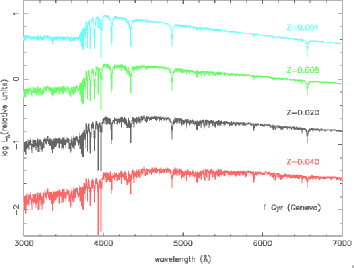
The metallicity effect on the spectral evolution is shown in Figure 4. We plot the spectra of a 1 Gyr stellar population at four different metallicities. The effect is appreciated in the slope of the continuum and in the strength of the lines. At this age, lower metallicity spectra are bluer, have stronger Balmer lines, and weaker metallic lines (Figure 4a). These changes are produced by the shift of the isochrones to higher temperatures with decreasing metallicity, which is a consequence of stars being brighter and hotter at lower metallicity. The effect of metallicity is also evident in spectra at older ages (few Gyr), where the continuum shape is similar in all the models, but there is a strengthening of the metallic lines from the most metal-poor to the most metal-rich stellar populations (Figure 4b).
4.2 Helium lines
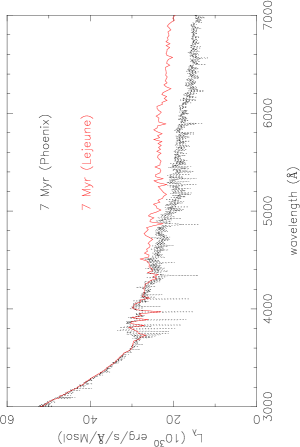
The high spectral resolution of our stellar library allows the prediction of the strength of many weak helium absorption lines that form in the optical continuum of young stellar populations. In Figure 5, we have labeled some of the most relevant Hei and Heii lines in the spectrum of a 7 Myr stellar population at Z=0.001. They are: Hei 3819, 4026, 4387, 4471, 4922, and 5876; and Heii 4200, 4541, 4686 and 5412. Heii lines are detected only during the first few years of the evolution; their equivalent widths decreasing with time from values of about 0.5 Å. Hei lines are more prominent and are detected during the first 100 Myr of evolution, when the optical continuum is dominated by B stars. Some of these Hei lines have been calculated previously by us (GLH99).
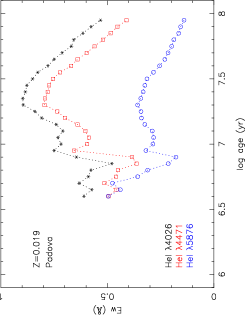
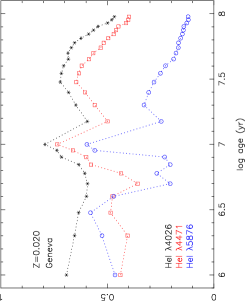
We measured the equivalent widths of three of these lines (Hei 4026, 4471 and 5876) in windows of 9-14 Å, integrating the flux from the pseudo-continuum obtained by a first-order polynomial fit to the continuum windows defined in Table 1. Figure 6 shows the equivalent widths of these lines for a stellar population at solar metallicity. Hei 4026 is one of the stronger lines, while Hei 5876 is much weaker. The Hei lines present a maximum value between 20 Myr and 50 Myr when the stellar population is dominated by B stars. Hei lines do not form after 100 Myr, the lifetime of B stars. The equivalent width has also a maximum between 7-15 Myr due to the presence of post-main sequence stars with K (see Figure 7 in GLH99).
Note, however, that these predictions for hot stars are estimated using static stellar atmosphere models Lanz & Hubeny (2003). They do not account for wind effects, which are important in very massive and evolved O stars. The lines most affected by winds are H and Heii 4686. The wind effects are less important in the Balmer and Hei lines in the blue spectral range, and at low metallicity Walborn et al. (1995).
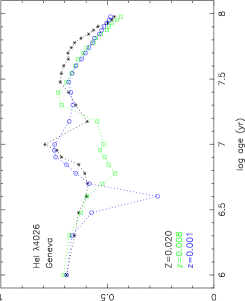
The main effect of the metallicity on the Hei lines results from the effect of the metallicity on the temperature of the turnoff, with metal-poor stellar populations having a higher turnoff temperature. The equivalent width of Hei lines is a function of and gravity, with a maximum at 20000 K and (GL99). Thus, the variation of EW(Hei) with metallicity depends on the variation of the turnoff temperature of the stellar population with metallicity.
| Line | Line windows | Continuum window (blue) | Continuum window (red) |
|---|---|---|---|
| H | 4092–4112; 4087–4117; 4070–4130 | 4012–4020 | 4158–4169 |
| H | 4330–4350; 4325–4355; 4310–4370 | 4262–4270 | 4445–4453 |
| H | 4852–4872; 4847–4877; 4832–4892 | 4770–4782 | 4942–4954 |
| H | 6553–6573; 6548–6578 | 6506–6514 | 6612-6620 |
| Hei 4026 | 4020–4031 | 4012–4020 | 4158–4169 |
| Hei 4471 | 4464–4478 | 4665–4675 | 4464–4478 |
| Hei 5876 | 5871–5880 | 5835–5845 | 5904–5912 |

4.3 Hydrogen lines
Figure 7 shows the synthetic profiles of the Balmer lines (H, H, H, H, H, H8, H9, H10,…, to the Balmer limit) for stellar populations at three different ages, 10 Myr, 100 Myr and 500 Myr at half solar metallicity, and for 1 Gyr at several metallicities (Z=0.019, 0.008 and 0.001). As it is well known, the profiles of the Balmer lines change significantly with age. The tendency is that the width of the lines increases with the evolution until about 500 Myr if the stellar population has solar metallicity. At ages younger than 1 Gyr, the profiles of these lines have only a small dependence on the metallicity. In individual stars, the strength of the hydrogen lines is independent of metal content. Therefore, the lines depend on metallicity only through the dependence of the stellar evolution in the integrated light of a stellar population.
Since at low metallicity a star of a given mass is hotter and evolves more slowly in the HR diagram, the maximum strength of the Balmer lines occurs at older ages. However, the dependence of the indexes of the Balmer lines with metallicity is stronger (Figure 8) at ages older than 1 Gyr. So, a metal-poor old stellar population can have Balmer lines similar to an intermediate age stellar population at solar or over-solar.
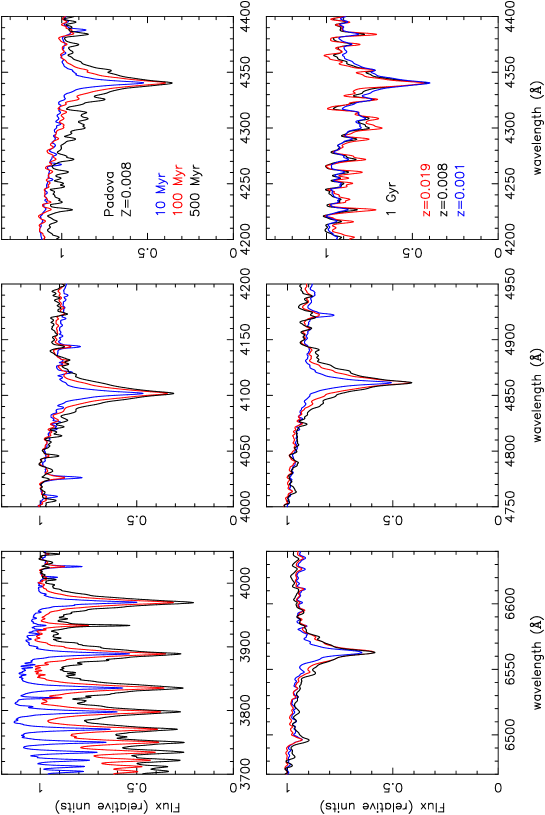
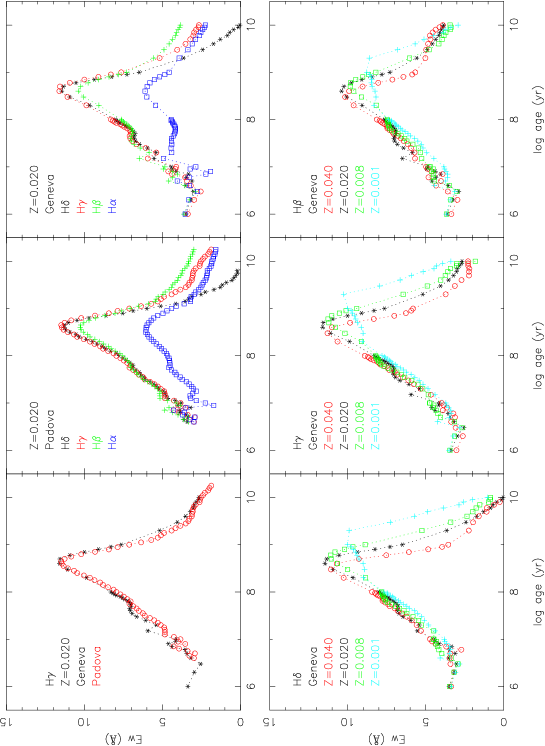
Figure 8 shows the evolution of the equivalent widths of the Balmer lines (H, H, H and H). The equivalent widths of these lines are measured in windows of width 20 Å, 30 Å, and 60 Å, centered on the lines, except for H which is measured in only two windows. However, only the values corresponding to the window of 30 Å are plotted in Figure 8. These windows have been chosen to evaluate the effect of line broadening on the EW. A narrow window is required to date old stellar populations, because it includes less contribution of neighboring metallic lines; in contrast, a wide window that includes the entire line wings is more useful to date intermediate age populations. The measurements are obtained by integrating the flux pseudo-continuum found through a first-order polynomial fit to the continuum windows defined in Table 1. H, H and H have a very similar behavior if the stellar population is younger than 1 Gyr. Their strengths range from 3 to 12 Å. During the first few million years, the EW is almost constant at Å. Then, the equivalent width increases with time until 400 Myr, when stars of 10000–9000 K dominate the optical continuum. The time evolution of H is smoother, changing from 3 to 6 Å. Note that the evolution of the strength of these lines is very similar in the Geneva and Padova spectra if the stellar population is younger than 1 Gyr. However, Padova models will predict younger ages than the Geneva models in old stellar populations.
We have not plotted the equivalent widths of the high-order Balmer series. They have a similar behavior as H and H, with values that range from 2-3 to 10 Å (GLH99). These lines are very useful for constraining the stellar ages in the nuclei of galaxies with an important contribution from nebular emission (e.g. González Delgado, Heckman, & Leitherer, 2001) due to the strong decrease of the nebular emission with the Balmer decrement, while the EW of absorption lines is constant or increases with wavelength.
4.4 The 4000 Å break
The Balmer discontinuity is another important age diagnostic in the optical continuum of a stellar population. Figure 2 shows how this discontinuity evolves with time up to converging with the 4000 Å break. While the 4000 Å break is produced by the accumulation of metallic lines around 4000–3800 Å, the Balmer discontinuity depends on the accumulation of the Balmer series below 4000 Å. Different definitions can be adopted to measure this discontinuity, and the usefulness of the definition depends on the stellar age that we are interested in measuring. In section 4.5, we will adopt the Rose (1994) definition for measuring the Balmer discontinuity to date young stellar populations. However, we adopt the 4000 Å break definition introduced by Balogh et al. (1999) to study the general change of the discontinuity for intermediate and old stellar populations. Balogh et al. use 100 Å continuum bands (3850–3950 Å and 4000–4100 Å) to measure the break. The main advantage of this definition is that the index is less sensitive to reddening effects. Other definitions using broader continuum bands have been proposed by Bruzual (1983) and Gorgas et al. (1999).
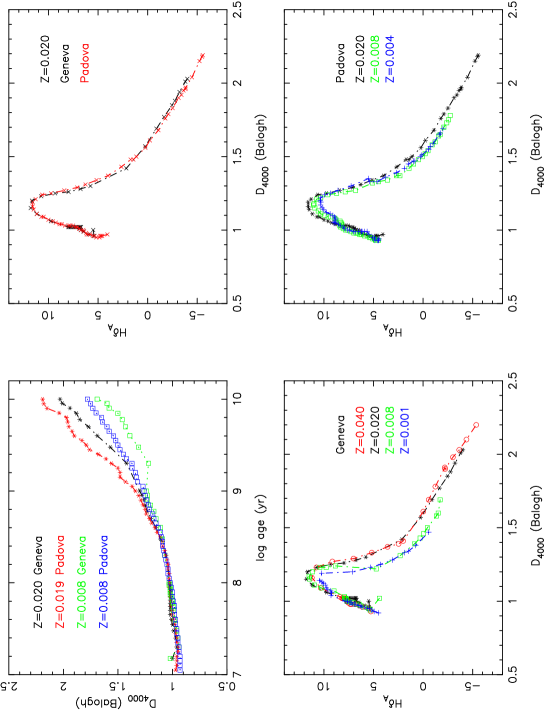
Figure 9 shows the strong variation of the index for ages older than 100 Myr. This index displays a similar behavior for the Padova and Geneva stellar models. However, the predictions differ for stellar populations older than 1 Ga; Geneva models, which do not contain all the relevant evolutionary phases, predict older ages, similarly to the case of the Balmer lines. On the other hand, for ages older than 400 Myr, this index definition significantly depends on the metallicity, mainly due to the fact that the blue continuum window includes the CaII K line which starts to be prominent at intermediate and old ages. The blue window also includes a CN band, which is strong in metal-rich old stellar populations.
Recently, the 4000 Å break has been used in combination with the H absorption line to date stellar populations of galaxies Kauffmann et al. (2003a, b, c). In that work, the authors use the H definition by Worthey & Ottaviani (1997). This index uses a central (4082–4122 Å) bandpass bracketed by two pseudo-continuum band passes (4030–4082 Å and 4122-4170 Å). The evolution of the 4000 Å break and the H index are plotted in Figure 9. Padova and Geneva models show similar values in the D4000–H plane for ages younger than 2 Gyr, but, again, the Geneva models predict older ages. This plot also shows the metallicity dependence of these two indexes. For a stellar population younger than about 400 Myr, the D4000–H plane does not depend on metallicity, but for older ages, the two indexes change significantly as a consequence of the variation of the 4000 Å break with the metal content and the effect of the metals on stellar evolution.
4.5 Spectral indexes
One of the most important problems in interpreting observed galaxy spectra is related to our ability to disentangle age and metallicity effects. It is well known that the best way to decouple these two effects is by combining the strength of lines which are mainly sensitive to the main sequence turnoff temperature, like the Balmer lines, with metallic lines which are sensitive to the temperature of the giant branch, which depends on metallicity Worthey et al. (1994); Buzzoni, Mantegazza, & Gariboldi (1994). The Lick system Burstein et al. (1984); Gorgas et al. (1993); Worthey et al. (1994); Worthey & Ottaviani (1997), which includes more than 25 spectral indexes at optical wavelengths, was designed to break this age-metallicity degeneracy. These indexes are calibrated using Galactic stellar spectra observed at a resolution of Å, and are useful to date stellar populations older than 1 Gyr. The lack of a significant number of high and intermediate mass stars in the stellar catalogs limits the ability of the system to date young and intermediate age populations. However, owing to the high-spectral resolution of our new stellar library, the evolutionary models presented here are rather useful for investigating an optimum set of spectral indexes to disentangle the metallicity and age effects in a large range of ages. This study will be presented elsewhere. Very recently Jiménez et al (2004) have pointed out that the best way to break the degeneracy is by including all the spectral features blue-wards of 4500 Å.
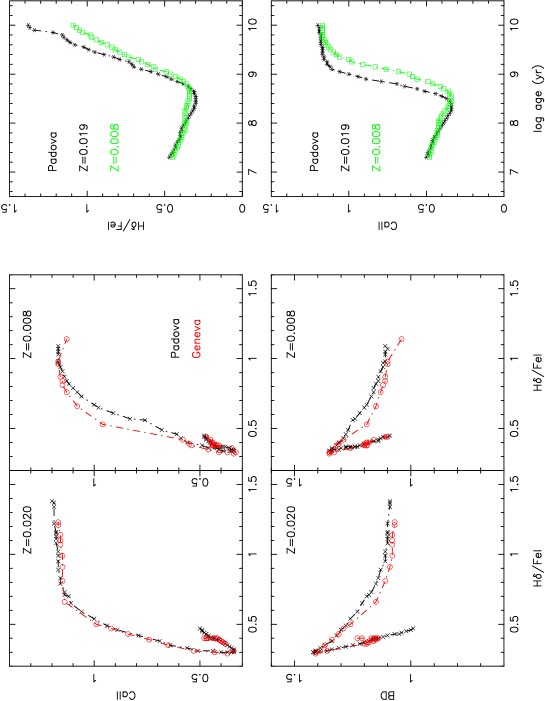
Alternatively, Rose (1984, 1985) has proposed to use the ratio of the measure of the central line depth of two neighboring spectral stellar features. This index definition has several advantages with respect to an equivalent width index. In particular, it is independent of the uncertainty associated with the location of the pseudo-continuum. In addition, this index is insensitive to reddening, but it depends on the spectral resolution (Vazdekis 2001; Martins et al 2004). Many of these indexes have been used to constrain the stellar population in elliptical galaxies (e.g. Rose, 1994), but also in young and intermediate age populations Leonardi & Rose (2003). Two relevant indexes are H/ and CaII. The former is defined as the ratio of the residual central intensity of H to that of the FeI 4045 line. The latter is defined as the ratio of the CaII H + H and CaII K lines. These two indexes combined with the Balmer discontinuity, defined as the ratio of the average flux in two narrow bands at 3700–3825 Å and 3525–3600 Å Rose, Stetson, & Tripicco (1987), can constrain the age and metallicity of a stellar population. The behavior of these indexes with age and metallicity is different. H/4045 is very sensitive to age, and it shows a strong evolution from few 100 Myr to 10 Gyr (Figure 10), increasing with age. The minimum value occurs when the continuum is dominated by 10000 K stars, due to an enhancement of H in early A stars. Because stars of type earlier than A0 have shallower Balmer lines, the index increases again toward younger ages. The CaII index shows a similar behavior to the H/ index at earlier ages, when the CaII lines are weak and the ratio depends mainly on the H depth. Then, the index remains almost constant when the Balmer lines (age Gyr) are weak and the core of the CaII lines are saturated (this happens in stars cooler than F5). The CaII index is also more dependent on metallicity than the H and Balmer discontinuity. Figure 10 also shows the behavior of these indexes for two metallicities and for the Geneva and Padova models.
5 Comparison with previous work
5.1 Low spectral resolution models
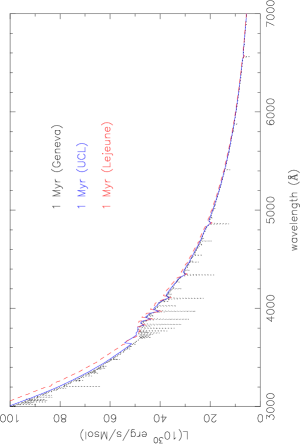
As pointed out in section 2, the new high spectral resolution stellar library presents two important changes with respect to previous work, related to the inclusion of line-blanketed models for hot () and cool () stars. To evaluate these improvements and to check the changes in the shape of the continuum, we have compared the synthetic high resolution spectra with low-resolution models obtained by Starburst99 and galaxev. Figures 11-13 show the comparison at three different ages, 1 Myr, 7 Myr and 5 Gyr.
At 1 Myr (Figure 11), the optical continuum at 3750 Å follows quite well the continuum, obtained with Starburst99 using Lejeune Lejeune, Buser, & Cuisiner (1997), or Kurucz, stellar atmospheres. In the near-UV, however, the flux is lower, and it is comparable to Starburst99 + UCL stellar atmospheres Smith, Norris, & Crowther, P.A. (2002). UCL models include O and W-R atmospheres with line blanketing by Pauldrach, Hoffmann, & Lennon (2001) and Hillier & Miller (1998). This difference between the fluxes at near-UV is clearly illustraded in Figure 13 of Lanz & Hubeny (2003). They show that O stars with Teff 35000 K have lower emission in the 3000-4000 Å interval than the Kurucz models. At older ages (not shown), the agreement between Sed@ (Geneva) and Starburst99+Lejeune is remarkable.
Spectra corresponding to old stellar populations obtained with the Padova isochrones are also in very good agreement with the galaxev low-resolution models which were computed using the Kurucz (1991) stellar atmospheres models (Figure 12).
However, there is a significant disagreement between the high resolution models and low-resolution models at some specific ages when there is an important contribution of cool red supergiants, for example at 7-15 Myr in the Geneva, and at 9-14 Myr in the Padova models, both at solar metallicity (Figure 13). At these ages, the contribution to the total luminosity of low gravity and cool (Teff 4000 K) stars (see the HR diagram in Figure 13) is very high. While the low-resolution models from Starburst99111111Note, however, that this discrepancy also appears if we compare these high-resolution models with Sed@ low-resolution models computed with the Geneva isochrones and Lejeune stellar atmospheres. also use Kurucz and/or Leujene stellar atmosphere models, here we are using PHOENIX models for these cool stars. Even though PHOENIX and Leujene atmospheres at low temperatures agree quite well for main sequence stars, PHOENIX produces less flux than Kurucz at red wavelengths in stars of low gravity. This is the reason why the high-resolution models have a steeper slope than the low-resolution models. See Martins et al. (2004) for further discussion.

5.2 Intermediate spectral resolution models
Next, we compare our synthetic spectra with the available intermediate spectral resolution models by Vazdekis (1999) and galaxev. These comparisons allow a check in terms of the continuum shape but also in terms of the stellar line strengths.
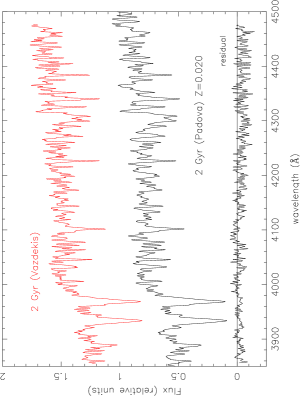
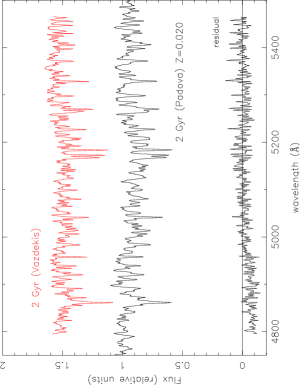
Vazdekis (1999) computed single stellar population models at a resolution of Å in two reduced spectral regions 3850–4500 Å and 4800–5450 Å. He uses a subsample of stars from the original Jones (1997) empirical stellar library. The models are computed at several metallicities and for ages older than a few 100 Myr. In Figure 14, we compare our and Vazdekis’s models for a stellar population of 2 Gyr at solar metallicity in the two wavelength regions covered by Vazdekis (1999). The agreement between the continuum shape and the strength of the lines in the two models is excellent.
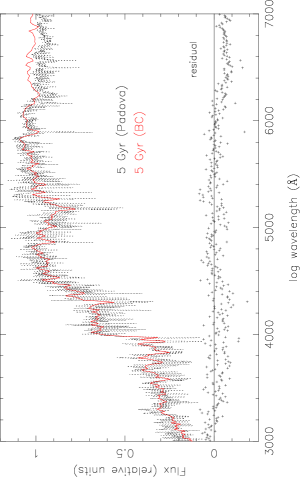
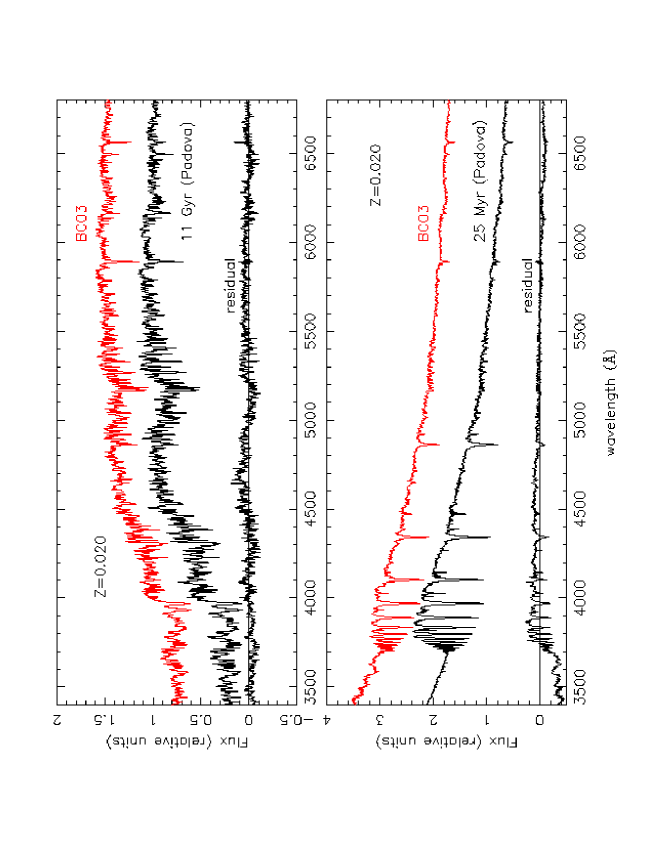
Recently, Bruzual & Charlot (2003) presented 3 Å resolution models covering from 3200 Å to 9500 Å (galaxev code results), a spectral range similar to our models. These predictions are based on the STELIB library Le Borgne et al. (2003), which contains 249 stellar spectra at several metallicities (), and spectral types from O to M9. However, the coverage in spectral type is not uniform at all metallicities. In particular, there is a significant lack of massive stars with 8000 25000 and 3.5. Figure 15 compares our and galaxev models at solar metallicity for two ages, 11 Gyr and 25 Myr. There is excellent agreement between both models at old ages in terms of continuum shape and line strengths. However, at younger ages, both models differ in the line strengths. The Balmer lines are stronger in our models, and the Balmer discontinuity is larger in our models.
6 Comparison with LMC and SMC clusters
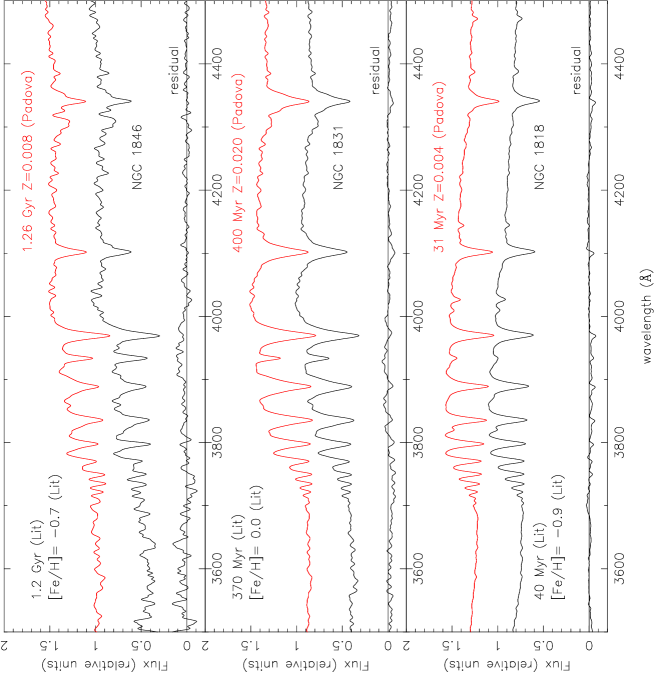
In this section, we compare the continuum shape and strength of the stellar lines of our models with observations of stellar clusters in the Magellanic Clouds (LMC and SMC). Leonardi & Rose (2003) have obtained very good quality optical spectra of clusters in the LMC and SMC covering a large range in metallicity (from [Fe/H]=+0.01 to -1.97) and ages (from 40 Myr to 15.5 Gyr). The observations have an average spectral resolution of 3.2 Å and cover the range Å. These data have been kindly provided by Dr. Rose. Figure 16 compares the spectra of three of these clusters (NGC 1846, NGC 1831 and NGC 1818) with our models. Models and observations are flux normalized at 4010 Å. The models are also downgraded to the spectral resolution of the observations and shown with a 0.5 flux bias for the sake of clarity. The age and metallicity reported for these clusters in the literature are labeled in the plot, as well as the values from our models. The agreement between observations and synthetic spectra is very good, considering an optimization of the fit was not attempted.
7 Limitations of the models in the Red Supergiant Phase
In this section we discuss some of the limitations of the models that are directly related with the limitations imposed by the stellar evolution models. One of the larger uncertainties in the stellar models is in the red supergiant (RSG) phase, due to the uncertainties that exist associated with the mass-loss rates and mixing (Yi 2003). These limitations have been previously noted by the poor match of the NIR colors predicted by starburst models with the integrated light of the observed stellar populations Origlia et al. (1999). More recently, Massey & Olsen (2003) have found that the Padova and Geneva models are not able to produce RSGs as cool and luminous as what is actually observed. The stellar tracks of M 20 M produce RSGs of 6000-5000 K, but no RSGs stars in the LMC and SMC with T 4500 K are observed.
Even though at blue wavelengths RSGs may contribute less to the integrated light of a stellar population than in the red range, we have found a very important effect at some especific ages, e.g. 5 Myr (Geneva models) and 8 Myr (Padova) at solar metallicity. There is a strong broad feature around the CaIIK line (at 3933 Å) that is produced when RSGs of Teff= 6000-5000 K contribute significantly to the continuum (Figure 17). This peculiar feature is another clear indication that evolutionary tracks produce RSGs that are much hotter than those observed.


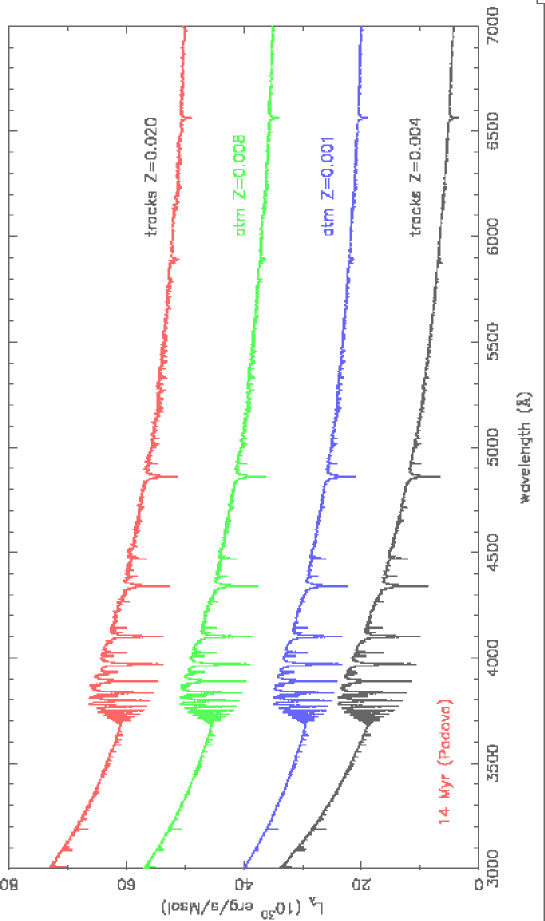
At older ages (10 Myr), high-metallicity stellar models are able to produce RSG stars with T 4000 K. However, low-metallicity stellar models also fail to reproduce the NIR colors observed in blue compact dwarf galaxies (e.g. Vázquez & Leitherer, 2004) and stellar clusters in LMC and SMC that are in the RSG phase (e.g. Mayya, 1997; Origlia et al., 1999). These results suggest clearly that isochrones are not adequate at low metallicity and at ages between 10-30 Myr. For this reason, we have computed a set of evolutionary models that follow the stellar tracks at solar metallicity but where the stellar atmospheres have 1/10 and 1/2 solar metallicity. Even though this exercise can not solve the problem inherent in the stellar tracks, it can provide a set of models that predicts some stellar characteristics that are more similar to those observed in stellar populations at low metallicity in the RSG phase. Figure 18 compares the spectra obtained with the Padova models that follow the isochrones at solar metallicity with the atmospheres at solar, half and 1/10 solar metallicity, and models obtained with the Z=0.004 stellar tracks. The main effect is seen in the slope of the spectra, almost identical in all the models that follow the solar tracks, but flatter, therefore redder, than the spectrum that follows the tracks at Z=0.004. The variation of the equivalent widths of the metallic stellar lines, such as CaIIK and G band, is small at the RSG phase, and it is only important in stellar populations older than 1 Gyr (Figure 18).
8 Summary and Conclusions
We have computed evolutionary synthesis models that predict high-resolution spectra of a stellar population in the 3000-7000 Å range. These models predict the indexes of metallic lines and the absorption-line profiles of the hydrogen Balmer series and helium lines as a function of age (1 Myr to 17 Gyr) and metallicity (Z= 0.040, 0.020, 0.008, 0.004 and 0.001) for an instantaneous burst. The models are generated using the isochrone synthesis method. These isochrones were built based on the Geneva and Padova evolutionary stellar tracks. A new stellar library based on stellar atmospheres models is used to compute the near-UV and optical continuum. The library, composed of 1650 spectra, incorporates the lastest improvements in stellar atmospheres: non-LTE line-blanketed models for hot stars (T 27500 K) and PHOENIX LTE line-blanketed models for cool stars (3000 T 4500 K). Together with Kurucz models (for stars with 4750 T 27000 K), these atmospheres are used to generate high-spectral resolution spectra with a sampling of 0.3 Å. The full set of evolutionary models and the stellar library spectra are available for retrieval at the websites http://www.iaa.csic.es/rosa and http://www.iaa.csic.es/mcs/Sed@, or on request from the authors.
The results of the synthetic models with the Padova and Geneva isochrones are compared. The models obtain optimal results, or at least results as good as those of galaxev or Vazdekis (1999) for old ages. At such ages, the Padova isochrones work better but only in the sense that they are more complete than Geneva in evolutionary phases. They are better than previous work for young ages due to the larger atmospheres coverage. Geneva and Padova produce quite similar results. In general, age determinations are dependent on the isochrone assumptions. These models have limitations mainly associated with the limitations and uncertainties in stellar evolution. These limitations can be relevant in the RSG phase, and in particular at low-metallicity.
Although the coverage is optimal, it is not correct to use any model for clusters with total masses below ten times the Lowest Luminosity Limit established by Cerviño & Luridiana (2004); see also Cerviño & Valls-Gabaud (2003); Cerviño et al. (2003). This limit corresponds to the situation where the integrated light of the cluster equals to the luminosity of a single star in the model, and corresponds typically to cluster masses around M⊙, but varies with wavelength and age (see Cerviño & Luridiana, 2004, for more details). The monochromatic Lowest Luminosity Limit and the intrinsic dispersion in the monochromatic flux due to incomplete sampling ( or ; see Cerviño et al. (2002) for details) are included in the output of Sed@ and in the tables in the web server.
Acknowledgments
We thank James Rose who kindly sent us the spectra of stellar clusters in the Magellanic Clouds, and Enrique Pérez and Alejandro Vazdekis for very useful comments that improved the presentation of the paper. RGD, and MC acknowledge support by the Spanish Ministry of Science and Technology (MCyT) through grant AYA-2001-3939-C03-01 and AYA-2001-2147-C02-01. PHH was supported in part by the Pôle Scientifique de Modélisation Numérique at ENS-Lyon. Some of the calculations presented here were performed at the Höchstleistungs Rechenzentrum Nord (HLRN), at the National Energy Research Supercomputer Center (NERSC), supported by the U.S. DOE, and at the San Diego Supercomputer Center (SDSC), supported by the NSF. We thank all these institutions for a generous allocation of computer time.
References
- Allard et al. (2001) Allard, F., Hauschildt, P.H., Alexander, D.R., Tamanai, A., & Schweitzer, A. 2001, ApJ, 556, 357
- Aretxaga et al. (2001) Aretxaga, I., Terlevich, E., Terlevich, R., Cotter, G., & Díaz, A.I. 2001, MNRAS, 325, 636
- Balogh et al. (1999) Balogh, M.L., Morris, S.L., Yee, H.K.C., Carlberg, R.G., & Ellingson, E. 1999, ApJ, 527, 54
- Bertelli et al. (1994) Bertelli, G., Bressan, A., Bertelli, G., Chiosi, C., Fagotto, F., & Nasi, E. 1994, A&AS, 106, 275
- Bica & Alloin (1986) Bica, E., & Alloin, D. 1986, A&A, 166, 83
- Brinchmann et al. (2004) Brinchmann, J., Charlot, S., White, S.D.M., Tremonti, C., Kauffmann, G., Heckman, T., & Brinkmann, J. 2004, MNRAS, 351, 1151
- Bruzual (1983) Bruzual, A.G. 1983, ApJ, 273, 105
- Bruzual (2002) Bruzual, A.G. 2002, IAUS, 207, 616
- Bruzual & Charlot (2003) Bruzual, G., & Charlot, S. 2003, MNRAS, 344, 1000
- Burstein et al. (1984) Brurstein, D., Faber, S.M., Gaskell, C.M., Krumm, N. 1984, ApJ, 287, 586
- Buzzoni (1989) Buzzoni, A. 1989, ApJS, 71, 817
- Buzzoni (1995) Buzzoni, A. 1995, ApJS, 98, 69
- Buzzoni (2002a) Buzzoni, A. 2002a, AJ, 123, 1188
- Buzzoni (2002b) Buzzoni, A. 2002b, in New Quests of Stellar Astrophysics, eds. M. Chavez et al., (Kluwer: Dordrecht) 189
- Buzzoni, Mantegazza, & Gariboldi (1994) Buzzoni, A., Mantegazza, L., & Gariboldi, G. 1994, AJ, 107, 513
- Cerviño et al. (2001) Cerviño, M., Gómez-Flechoso, M.A., Castander, F.J., Schaerer, D., Mollá, M., Knödlseder, J., & Luridiana, V. 2001, A&A, 376, 422
- Cerviño & Luridiana (2004) Cerviño, M., & Luridiana, V. 2004, A&A, 413, 145
- Cerviño, Luridiana, & Castander (2000) Cerviño, M., Luridiana, V., & Castander, F.J. 2000, A&A, 360, L5
- Cerviño et al. (2003) Cerviño, M., Luridiana, V., Pérez, E., Vílchez, J.M., & Valls-Gabaud, D. 2003, A&A, 407, 177
- Cerviño et al. (2000) Cerviño, M., Knödlseder, J., Schaerer, D., von Ballmoos, P., & Meynet, G. 2000, A&A, 363, 970
- Cerviño & Mas-Hesse (1994) Cerviño, M., & Mas-Hesse, J.M. 1994, A&A, 284, 749
- Cerviño, Mas-Hesse, & Kunth (2002) Cerviño, M., Mas-Hesse, J.M., & Kunth, D. 2002, A&A, 392, 19
- Cerviño & Valls-Gabaud (2003) Cerviño, M., & Valls-Gabaud, D. 2003, MNRAS, 338, 481
- Cerviño et al. (2002) Cerviño, M., Valls-Gabaud, D., Luridiana, V., & Mas-Hesse, J.M. 2002, A&A, 381, 51
- Charbonnel et al. (1996) Charbonnel, C., Meynet, G., Maeder, A., & Schaerer, D. 1996, A&AS, 115, 339
- Charbonnel et al. (1993) Charbonnel, C., Meynet, G., Maeder, A., Schaeller, G., & Schaerer, D. 1993, A&AS, 101, 415
- Charlot & Bruzual (1991) Charlot, S., & Bruzual, G. 1991, ApJ, 367, 126
- Cid Fernandes et al. (2004) Cid Fernandes, R., González Delgado, R.M., Schmitt, H., Storchi-Bergmann, T., Martins, L.P., Pérez, E., Heckman, T., Leitherer, C., & Schaerer, D. 2004, ApJ, 605, 105
- Cid Fernandes et al. (2001) Cid Fernandes, R., Heckman, T., Schmitt, H., González Delgado, R.M., & Storchi-Bergmann, T. 2001, ApJ, 558, 81
- Fioc & Rocca-Volmerange (1997) Fioc, M., & Rocca-Volmerange, B. 1997, A&A, 326, 950
- Gilfanov, Grimm, & Sunyaev (2004) Gilfanov, M., Grimm, H.-J., & Sunyaev, R. 2004, MNRAS, 351, 1365
- Girardi et al. (2002) Girardi, L., Bertelli, G., Bressan, A., Chiosi, C., Groenewegen, M.A.T., Marigo, P., Salasnich, B., & Weiss, A. 2002, A&A, 391, 195
- Girardi & Bica (1993) Girardi, L., & Bica, E. 1993, A&A, 274, 279
- Girardi et al. (2000) Girardi, L., Bressan, A., Bertelli, G., & Chiosi, C. 2000, A&AS, 141, 371
- González Delgado et al. (2004) González Delgado, R.M., Cid Fernandes, R., Pérez, E., Martins, L.P., Storchi-Bergmann, T., Schmitt, H., Heckman, T., & Leitherer, C. 2004, ApJ, 605, 127
- González Delgado, Heckman, & Leitherer (2001) González Delgado, R.M., Heckman, T., & Leitherer, C. 2001, ApJ, 546, 845
- González Delgado & Leitherer (1999) González Delgado, R.M., & Leitherer, C. 1999, ApJS, 125, 479 (GL99)
- González Delgado, Leitherer, & Heckman (1999) González Delgado, R.M., Leitherer, C., & Heckman, T. 1999, ApJS, 125, 489
- Gorgas et al. (1999) Gorgas, J., Cardiel, N., Pedraz, S., & González, J.J. 1999, A&AS, 139, 29
- Gorgas et al. (1993) Gorgas, J., Faber, S.M., Burstein, D., González, J.J., Courteau, S., Prosser, C. 1993, ApJS, 86, 153
- Gray & Corbally (1994) Gray, R.O., & Corbally, C.J. 1994, AJ, 107, 742
- Hauschildt & Baron (1999) Hauschildt, P. H., & Baron, E. 1999, Journal of Computational and Applied Mathematics, 102, 41
- Hillier & Miller (1998) Hillier, D.J., & Miller, D.L. 1998, ApJ, 496, 407
- Hubeny (1988) Hubeny, I. 1988, Compt. Phys. Commun., 52, 103
- Hubeny, Lanz, & Jeffery (1995) Hubeny, I., Lanz, T., & Jeffery, C.S. 1995, SYNSPEC-A Users Guide
- Jamet et al. (2004) Jamet, L., Pérez, E., Cerviño, M., Stasińsk, G., González Delgado, R.M., & Vílchez, J.M. 2004, A&A, 426, 399
- Jiménez et al (2004) Jiménez, R., MacDonald, J., Dunlop, J.S., Padoan, P., & Peacock, J.A. 2004, MNRAS, 349, 240
- Jones (1997) Jones, L.A. 1997, Ph.D. thesis, Univ. North Carolina, Chapel Hill
- Kauffmann et al. (2003a) Kauffmann, G., Heckman, T., et al. 2003a, MNRAS, 341, 33
- Kauffmann et al. (2003b) Kauffmann, G., Heckman, T., et al. 2003b, MNRAS, 341, 54
- Kauffmann et al. (2003c) Kauffmann, G., Heckman, T., et al. 2003c, MNRAS, 346, 1055
- Kurucz (1991) Kurucz, R.L. 1991, in Stellar Atmospheres: Beyond Classical Limits, eds. L. Crivellari, I. Hubeny, & D.G. Hummer (Dordrecht:Kluwer), 441
- Kurucz (1993) Kurucz, R.L. 1993, Kurucz CD-ROM 13, ATLAS9 Stellar Atmosphere Programs and 2 km/s Grid (Cambridge:SAO)
- Lançon et al. (2001) Lançon, A., Goldader, J.D., Leitherer, C., & González Delgado, R.M. 2001, ApJ, 552, 150
- Lanz & Hubeny (2003) Lanz, T., & Hubeny, I. 2003, ApJ, 146, 417
- Le Borgne et al. (2003) Le Borgne, J.-F., Bruzual, G., et al. 2003, A&A, 402, 433
- Lejeune, Buser, & Cuisiner (1997) Lejeune, T., Buser, R., & Cuisinier, F. 1997, A&A, 125, 229
- Leitherer, Fritze- v.Alvensleben, & Huchra (1996) Leitherer, C., Fritze- v.Alvensleben, U., & Huchra, J. 1996, ASP. Conf. Series, 98
- Leitherer et al. (1999) Leitherer, C., Schaerer, D., et al. 1999, ApJS, 123, 3
- Leonardi & Rose (2003) Leonardi, A.J., & Rose, J. A. 2003, AJ, 126, 1811
- Marigo & Girardi (2001) Marigo, P. & Girardi, L. 2001, A&A, 377, 132
- Martins et al. (2004) Martins, L. González Delgado, R.M., Leitherer, C., Cerviño, M., Hauschildt, P.H., & Hubeny, I. 2004, MNRAS, submitted
- Massey & Olsen (2003) Massey, P., Olsen, K.A.G. 2003, AJ, 125, 2867
- Mayya (1997) Mayya, Y. D. 1997, ApJ, 482, L149
- Meynet et al. (1994) Meynet, G., Maeder, A., Schaeller, G., Schaerer, D., & Charbonnel, C. 1994, A&A, 103, 97
- Origlia et al. (1999) Origlia, L., Goldader, J.D., Leitherer, C., Schaerer, D., & Oliva, E. 1999, ApJ, 514, 96
- Pauldrach, Hoffmann, & Lennon (2001) Pauldrach, A.W.A, Hoffmann, T.L., & Lennon, M. 2001, A&A, 375, 161
- Pettini et al. (2000) Pettini, M., Steidel, C.C., Adelberger, K.L., Dickinson, M., & Givalisco, M. 2000, ApJ, 528, 96
- Renzini & Buzzoni (1986) Renzini, A., & Buzzoni, A. 1986, Spectral Evolution of Galaxies. eds. Chiosi C., Renzini A., Reidel, Dordrecht, 195
- Rose (1984) Rose, J.A. 1984, AJ, 89, 1238
- Rose (1985) Rose, J.A. 1985, AJ, 90, 1927
- Rose (1994) Rose, J.A. 1994, AJ, 107, 206
- Rose, Stetson, & Tripicco (1987) Rose, J.A., Stetson, P.B., & Tripicco, M.J. 1987, AJ, 94, 1202
- Salpeter (1955) Salpeter, E.E. 1955, ApJ, 121, 161
- Schaerer et al. (1993a) Schaerer, D., Charbonnel, C., Meynet, G., Maeder, A., & Schaller, G. 1993a, A&AS, 102, 339
- Schaerer et al. (1993b) Schaerer, D., Meynet, G., Maeder, A., & Schaller, G. 1993b, A&AS, 98, 523
- Schaller et al. (1992) Schaller, G., Schaerer, D., Meynet, G., & Maeder, A. 1992, A&AS, 96, 269
- Schulz et al. (2002) Schulz, J., Fritze- v.Alvensleben, U., Moller, C.S., & Fricke, K.J. 2002, A&A, 392, 1
- Smith, Norris, & Crowther, P.A. (2002) Smith, L. J., Norris, R.P.F., & Crowther, P.A. 2002, MNRAS, 337, 1309
- Steidel et al. (1996) Steidel, C.C., Giovalisco, M., Pettini, M., Dickinson, M., & Adelberger, K. 1996, ApJ, 462, L17
- Tadhunter et al. (2004) Tadhunter, C., Robinson, T.G., González Delgado, R.M., Wills, K., & Morganti, R. 2004, MNRAS, in press (astro-ph/0410108)
- Tinsley (1968) Tinsley, B.M. 1968, ApJ, 151, 547
- Tinsley & Gunn (1976) Tinsley, B.M., & Gunn J.E. 1976, ApJ, 203, 52
- Vazdekis (1999) Vazdekis, A. 1999, ApJ, 513, 224
- Vazdekis (2001) Vazdekis, A. 2001, ApJSS, 513, 276, 839
- Vazdekis & Arimoto (1999) Vazdekis, A., & Arimoto, N. 1999, ApJ, 525, 144
- Vázquez & Leitherer (2004) Vázquez, G., & Leitherer, C. (in preparation)
- Walborn et al. (1995) Walborn, N.R., Lennon, D.J., Haser, S.M., Kudritzki, R-P., & Voels, S.A. 1995, PASP, 107, 104
- Worthey et al. (1994) Worthey, G., Faber, S.M., González, J.J., Burstein, D. 1994, ApJS, 94, 687
- Worthey & Ottaviani (1997) Worthey, G., & Ottaviani, D.L. 1997, ApJS, 111, 377
- Yi (2003) Yi, S.K. 2003, ApJ, 582, 202