Neutral Hydrogen Gas in Interacting Galaxies:
The NGC 1511 galaxy group††thanks: The observations were obtained
with the Australia Telescope which is funded by the Commonwealth of
Australia for operations as a National Facility managed by CSIRO.
Abstract
We present H i line and 20-cm radio continuum observations of the NGC 1511 galaxy group obtained with the Australia Telescope Compact Array. The data reveal an extended, rather disturbed H i distribution for the peculiar starburst galaxy NGC 1511 and a narrow bridge to its small companion galaxy, NGC 1511B, which has been severely distorted by the interaction/collision between the two galaxies. No stellar counterpart to the gaseous bridge has been detected. In addition, we find that the peculiar optical ridge to the east of NGC 1511 is probably the stellar remnant of a galaxy completed disrupted by interactions with NGC 1511. The slightly more distant neighbour, NGC 1511A, shows a regular H i velocity field and no obvious signs of interactions.
Radio continuum emission from NGC 1511 reveals three prominent sources on top of a more diffuse, extended distribution. We derive an overall star formation rate of 7 M⊙ yr-1. The most enhanced star formation is found in the south-eastern part of the disk, coincident with several bright H ii regions, and closest to the peculiar optical ridge. No continuum emission was detected in the companions, but NGC 1511B appears to show an H ii region at its faint western edge, closest to NGC 1511. The group displays a prime example of interaction-induced star formation activity.
keywords:
galaxies: individual (NGC 1511, NGC 1511A, NGC 1511B) — galaxies: interacting1 Introduction
Neutral hydrogen gas (H i) is the best tracer for galaxy-galaxy interactions. Since the H i envelope of a galaxy is generally more extended than its stellar disk (Broeils & van Woerden 1994; Salpeter & Hoffman 1996) it is more easily disrupted by tidal forces from neighboring galaxies. Galaxy pairs and groups often show very complex extended H i distributions, incl. H i tails and bridges, even if the corresponding optical images show little disturbance. For examples see Irwin (1994), Smith, Struck & Pogge (1997), Yun et al. (1994), Koribalski & Dickey (2004), and the H i Rogues Gallery (Hibbard et al. 2001). Here we use H i line observations to investigate the interaction history and dynamics of the NGC 1511 galaxy group.
The starburst galaxy NGC 1511 is the most prominent member of a compact galaxy triplet at a distance of 17.5 Mpc (Ho = 75 km s-1 Mpc-1). Its companions, NGC 1511B and NGC 1511A, lie at projected distances of 73 (37 kpc) and 107 (54 kpc), respectively. Table 1 lists some properties for all three galaxies. The stellar disk of NGC 1511 (see, e.g., Eskridge et al. 2000, Sandage & Bedke 1994) contains several bright hotspots, a prominent dust lane and various peculiar extensions. Faint loops and plumes are seen to the northeast of the disk while the hotspots are located in a peculiar hook at the south-eastern end of the disk which is best seen in infrared images (Eskridge et al. 2000, Jarret et al. 2003). In addition, deep optical images reveal an extended vertical ridge 15 east of the south-eastern end of the disk, the nature of which we will explore here. Optical short exposures of NGC 1511 show a remarkable resemblance to the peculiar starburst galaxy NGC 1808 (Koribalski et al. 1993). The optical diameter of NGC 1511 ( or 17.5 kpc 6.1 kpc) is about twice that of the neighboring galaxies NGC 1511A and B. While NGC 1511A appears slightly inclined and symmetric, NGC 1511B is an extremely thin, edge-on galaxy with a faint extension to the west. There is a hint of an H ii region at the western most end. The pecularities of both NGC 1511 and NGC 1511B suggest they are interacting. Koribalski (1996) briefly commented on the post interaction/merger nature of NGC 1511. The H i distribution of the triplet is also briefly discussed by Nordgren et al. (1997). The star formation history of NGC 1511 can be used to estimate the interaction time scale. Sekiguchi & Wolstencroft (1993) find that NGC 1511 has an H ii region like emission spectrum with high excitation (see also Kewley et al. 2000), suggesting on-going star formation mixed with a burst yrs ago. Thornley et al. (2000) find indications of massive star formation (50 M⊙) on a short timescale of yr using mid-infrared spectroscopy. Elfhag et al. (1996) observed the center of NGC 1511 with the SEST and find a CO intensity of = 11.5 K km s-1 (adjusted to our adopted distance). This corresponds to a nuclear H2 mass of M⊙ if we adopt the standard conversion factor of H2 cm-2 (K km s-1)-1 (Strong et al. 1988). Radio continuum, X-ray, and UV data were obtained by Dahlem et al. (2001, 2003), while Lehnert & Heckman (1995) presented an H image. These data confirm the starburst character of NGC 1511.
| NGC 1511 | NGC 1511A | NGC 1511B | Ref. | |
| center position: | ||||
| (J2000) | (1) | |||
| (J2000) | –67°38′07″ | –67°48′28″ | –67°36′42″ | |
| type | SAa pec | SB0 | SBd? | (1) |
| optical diameter | (1) | |||
| inclination | (6) | |||
| position angle | 125° | 110° | 98° | (1,2) |
| [ km s-1] | (1,3,6) | |||
| [ km s-1] | — | (1) | ||
| [ km s-1] | (2) | |||
| [ km s-1] | — | — | (4) | |
| [Jy km s-1] | 73.6 | 20.6 | — | (3) |
| S60μm [Jy] | 23.67 | 0.44 | — | (5) |
| S100μm [Jy] | 37.99 | 2.16 | — | (5) |
| B magnitude | 12.11 | 14.23 | 15.12 | (1) |
| 0.265 | 0.257 | 0.236 | (7) | |
| [109 L⊙] | 4.9 | 0.7 | 0.3 | |
| [1040 erg s-1] | 1.1 | — | — | (8) |
The paper is organized as follows: in Section 2 we summarize the observations and data reduction. In Section 3 we present the 20-cm radio continuum results and derive star formation rates for NGC 1511. The H i morphology and kinematics of all members of the NGC 1511 galaxy group are described in Section 4. The overall gas dynamics are discussed in Section 5, and Section 6 contains our conclusions.
2 Observations and Data Reduction
H i line and 20-cm radio continuum observations of the NGC 1511 galaxy group were obtained with the Australia Telescope Compact Array (ATCA) in March and August 1995 using the 1.5A and 375 arrays. For a summary of the observations see Table 2.
Data reduction was carried out with the miriad software package using standard procedures. The data were split into a narrow band radio continuum and an H i line data set using a first order fit to the line-free channels. The H i channel maps were made using ‘natural’ (na) and ‘robust’ (r=0) weighting of the uv-data in the velocity range from 1050 to 1550 km s-1 using steps of 10 km s-1. The resulting synthesized beams are (na) and (r=0); the measured r.m.s. noise is 1.7 and 1.8 mJy beam-1, respectively. The H i data cubes were corrected for primary beam attenuation. One Jy beam-1 km s-1 corresponds to an H i column density of atoms cm-2 (na) and atoms cm-2 (r=0).
Radio continuum maps were made using ‘uniform’ weighting of the uv-data. After CLEANing they were restored with a synthesized beam of 6″, resulting in an r.m.s. of 0.5 mJy beam-1. A low-resolution image was created using ‘natural weighting’; only the shortest 10 baselines were used. The beam size here is , with an r.m.s. of 0.8 mJy beam-1.
| ATCA configuration | 1.5A | 375 |
|---|---|---|
| primary beam | 33′ | |
| pointing position | ||
| in (J2000) | –67° 47′ 00″ | |
| total observing time | 712 min. | 647 min. |
| center frequency | 1414 MHz | |
| total bandwidth | 8 MHz | |
| number of channels | 512 | |
| velocity resolution | 6.6 km s-1 | |
| (after Hanning smoothing) | ||
| Calibrator flux densities: | ||
| primary | 1934–638 (14.88 Jy) | |
| secondary | 0355–669 (0.97 Jy) | |
3 Radio Continuum Results
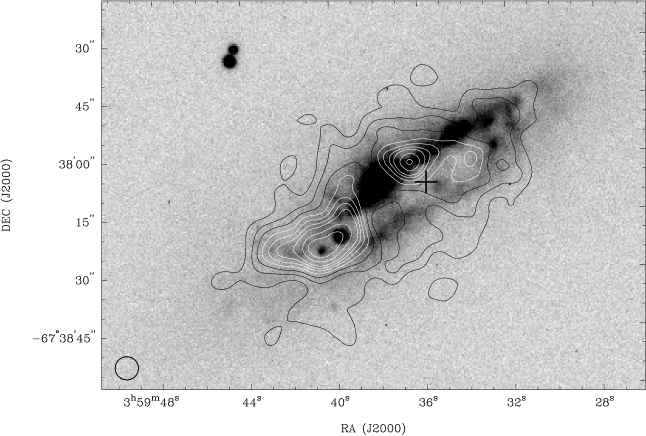
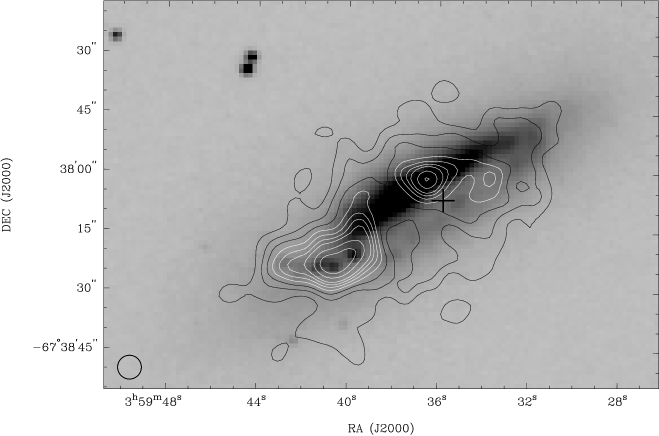
Since the overall, extended radio continuum emission of NGC 1511 was analysed by Dahlem et al. (2001), we concentrate here on the central region. Fig. 1 shows a high-resolution 20-cm radio continuum image of NGC 1511 overlaid onto B- and H-band images from Eskridge et al. (2000). We identify three maxima in at (J2000) = 407, –67° 38′ 238 (SE complex), 365, –67° 38′ 020 (middle source) and 337, –67° 38′ 011 (faint western source) with approximate peak flux densities of 53, 27 and 13 mJy beam-1, respectively. The SE complex corresponds to the peculiar hook which is best seen in the H-band image (Eskridge et al. 2000) and the 2MASS JHKs-image (Jarret et al. 2003). At the same location, the B-band image shows a chain of bright hotspots. These are young H ii regions (see Lehnert & Heckman 1995) consistent with increased star formation in that part of the disk of NGC 1511. The middle source, which lies 6″ northeast of the galaxy center as given in Table 1, and the faint western source also appear to coincide with hotspots in the H image. No radio continuum emission was detected from the companions, NGC 1511A and NGC 1511B, with 5 upper limits to their flux densities of 4 mJy. We detect several background sources in the observed field; the two brightest are SUMSS J035734–674941 (30 mJy) and SUMSS J035949–680052 (68 mJy).
 |
 |
To estimate the star formation rate (SFR) of NGC 1511 from the 20-cm radio continuum flux density, (Jy), we use SFR ( yr-1) = derived from Condon (1992) and Haarsma et al. (2000), where is the distance in Mpc. For NGC 1511 we measure a primary beam corrected 20-cm radio continuum flux density of 167 mJy (using the low-resolution map) and hence a star formation rate of 7 M⊙ yr-1. There are indications of a faint extended halo, but our data are not sufficient to study this emission. For comparison, Dahlem et al. (2001) measure a total 20-cm radio continuum flux density of mJy. For NGC 1511A and B we derive upper limits of SFR 0.2 M⊙ yr-1.
The star formation rate of a galaxy can also be estimated from its far-infrared luminosity, , using SFR ( yr-1) = 0.17 (Kennicutt 1998), with in units of L⊙. Using the IRAS 60m and 100m flux densities given by Sanders et al. (1995) (S60μm = 25.7 Jy, S100μm = 41.3 Jy, for comparison see Table 1) we derive a FIR luminosity of L⊙ for NGC 1511 which results in SFR = 2.2 M⊙ yr-1. NGC 1511A has an infrared luminosity of L⊙ and SFR = 0.02 – 0.07 M⊙ yr-1. No IRAS flux densities are available for NGC 1511B.
Following Helou, Soifer & Rowan-Robinson (1985) we calculated the parameter which is the logarithmic ratio of FIR to radio flux density. For NGC 1511 we find = 2.34, consistent with the mean value of 2.3 for normal spiral galaxies (Condon 1992).
4 H i Results
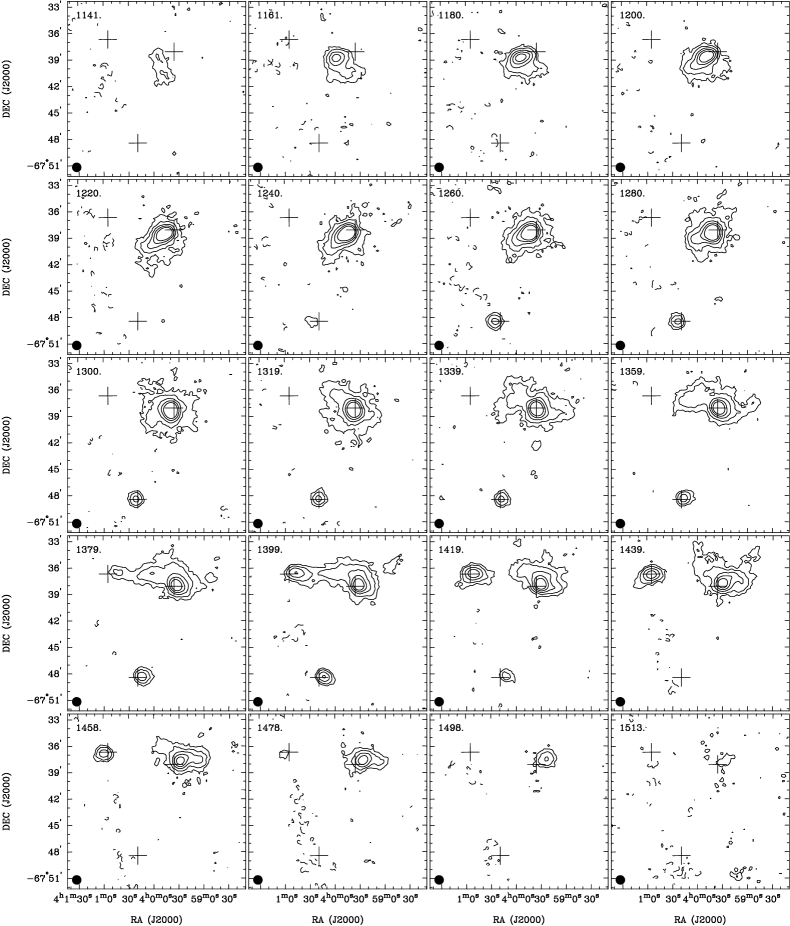
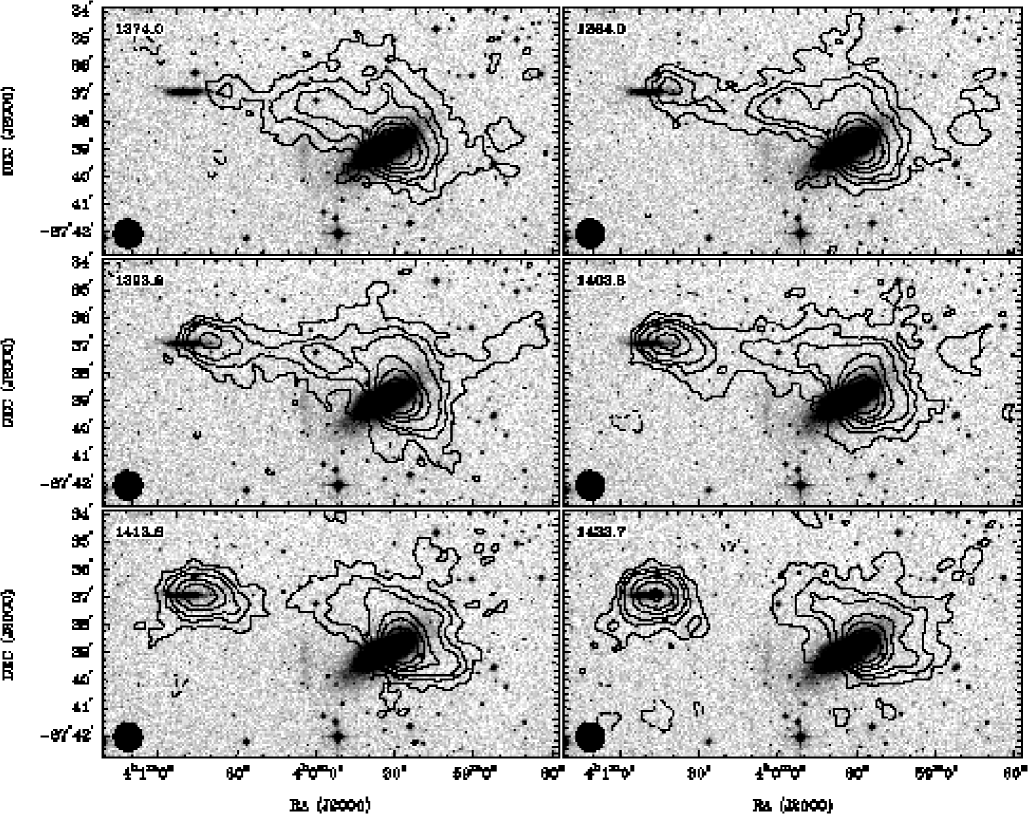
The H i channel maps of the NGC 1511 group are shown in Fig. 2. All three galaxies are clearly detected, covering a velocity range of 1130 to 1510 km s-1. In addition, we detect a thin H i bridge between NGC 1511 and NGC 1511B, indicating tidal interactions or a direct collision of the two galaxies. No bridge is detected towards NGC 1511A. The individual H i spectra are displayed in Fig. 3. Most noticeable is the rather narrow H i spectrum (1370 – 1480 km s-1) of the disturbed, edge-on galaxy NGC 1511B, in contrast to the broad spectra of NGC 1511 and NGC 1511A. We estimate the systemic velocity of NGC 1511B to be 1425 km s-1, close to the H velocity (see Table 1). Note that Nordgren et al. (1997) find the H i spectrum of NGC 1511B peaks at 1429 km s-1, in agreement with our value. Because they claim to see faint H i emission at lower velocities, they estimate = 1304 km s-1. The H i bridge, which appears to connect the north-western edge of NGC 1511 to the western edge of NGC 1511B covers a velocity range from 1320 to 1430 km s-1. Both the H i and the stellar disk of NGC 1511B are affected by the interaction. It is likely that the gas in the H i bridge was stripped from NGC 1511B by a direct collision with the outer disk of NGC 1511.
 |
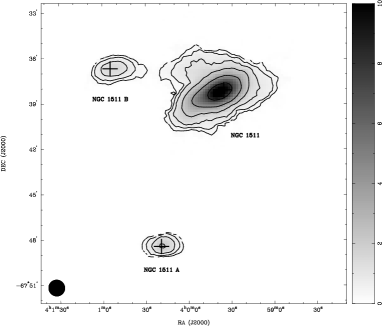
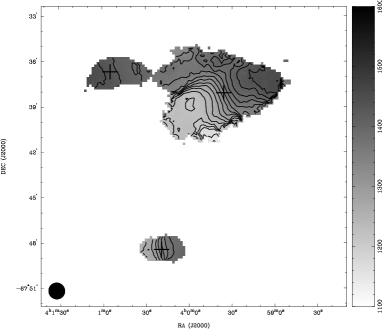
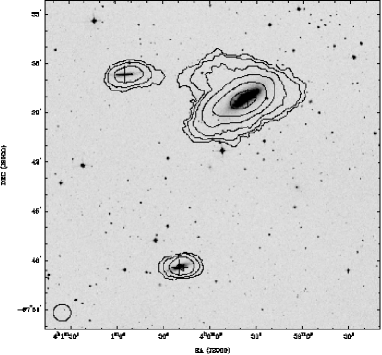
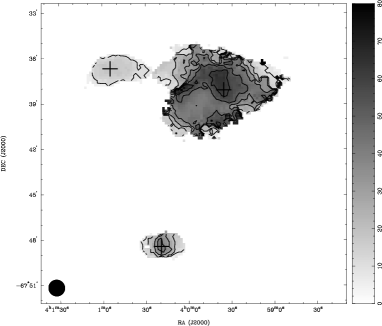
The H i distribution, the mean H i velocity field and the H i velocity dispersion of the NGC 1511 group are shown in Fig. 4. For a summary of the H i properties see Table 3.
 |
 |
|---|---|
 |
 |
We measure a total primary-beam corrected H i flux density of = 74 Jy km s-1 for the NGC 1511 group resulting in an H i mass of = M⊙. For NGC 1511 alone we measure = 66.4 Jy km s-1 which corresponds to an H i mass of M⊙, while the two small companions, NGC 1511A and NGC 1511B, have H i masses of 2.0 and M⊙, respectively. For a summary see Table 3. The HIPASS Bright Galaxy Catalog (Koribalski et al. 2004) gives the following H i properties for NGC 1511 (HIPASS J0359–67): a systemic velocity of = km s-1, 50% and 20% velocity widths of 267 km s-1 and 323 km s-1, respectively, and = Jy km s-1, i.e. = 4.8 ( 0.3) M⊙. The H i flux density given in HICAT (FHI = 74.2 km s-1, Meyer et al. 2004) was measured over a larger area () and is consistent with our H i measurement of the whole group. This agreement indicates that very little (if any) diffuse H i emission has been filtered out by the interferometric observation, i.e. the NGC 1511 group does not contain large amounts of un-detected H i gas. This is perhaps not surprising as the main interaction appears to occur between NGC 1511 and NGC 1511B and those scales are well covered by the ATCA observations.
Previous H i measurements of NGC 1511, obtained with the 64-m Parkes telescope, include = Jy km s-1 (Reif et al. 1982), 85.3 Jy km s-1 (Bajaja & Martin 1985), and 73.6 Jy km s-1 (Mathewson & Ford 1996).
| Object | velocity range | ||
|---|---|---|---|
| (km s-1) | (Jy km s-1) | ( M⊙) | |
| group | 1130–1510 | 74 | 53.5 |
| NGC 1511 | 1130–1510 | 66.4 | 48.0 |
| NGC 1511A | 1240–1410 | 2.8 | 2.0 |
| NGC 1511B | 1370–1480 | 5.1 | 3.7 |
5 Discussion
5.1 Signatures of Galaxy Interactions
Gaseous, intergalactic emission is detected between NGC 1511 and NGC 1511B in the velocity range from 1320 to 1430 km s-1 (see Figs. 2 and 5). It commences at the north-western side of NGC 1511 and appears to curve around to the western side of NGC 1511B, extending over a distance of at least 37 kpc. The overall bridge area contains up to 6 Jy km s-1, corresponding to an H i mass of M⊙; this gas is currently attributed to either NGC 1511 or NGC 1511B in Table 3 because, with the current data, it is impossible to exactly specify how much H i gas lies between the galaxies. No stellar counterpart to the bridge has been detected in the available optical sky surveys.
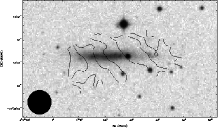
The stellar distribution of NGC 1511B is extremely thin and edge-on. Its main body extends 17 (9 kpc) along the major axis. In addition, we find a faint extension towards the west with a prominent H ii region at its tip which corresponds to the H i maximum in the 1393 km s-1 channel map. The H i and the stellar disk of NGC 1511B seem to be elongated and severely distorted, especially in the direction of NGC 1511. In addition, the H i velocity field of NGC 1511B does not look like that of a normal rotating spiral galaxy. The iso-velocity contours are inclined with respect to the disk major-axis, at an angle of 45°, and are generally irregular (see Fig. 8). The velocity dispersion stays around 17 km s-1 throughout the disk. It seems that the H i gas distribution of NGC 1511B has been distorted and partially stripped off by gravitational forces during the interaction/collision with its massive neighbour, NGC 1511. The dynamical mass estimate given for NGC 1511B (see Table 4) is highly uncertain as the actual rotational velocity of the galaxy is unknown.
Another most interesting feature found near NGC 1511 is a peculiar
vertical ridge (15 in length) only visible in deep optical
images. It is located 3′ east of the centre of NGC 1511 and
corresponds to a distinct region in the H i velocity field of NGC 1511 (see
Fig. 7). While this region is peculiar with respect to
the rotation of NGC 1511, it shows remarkably regular iso-velocity contours
perpendicular to the ridge. We tentatively conclude that what appears like
a peculiar ridge actually is the stellar remnant of a tidally-disrupted
galaxy in the NGC 1511 group.
Bridges between galaxies, either consisting of gas only or with a stellar component, are observed in several galaxy pairs (e.g., Irwin 1994; Smith, Struck & Pogge 1997; Struck & Smith 2003; Koribalski & Dickey 2004). Simulations show two different mechanisms for developing bridges. Toomre & Toomre (1972) first predicted bridges to be formed by tidal forces. This process is successfully modeled by Barnes & Hernquist (1991) and Mihos & Hernquist (1996), considering an impact parameter larger than the disk radius. In this case stars and gas are stripped out in the bridge. Struck (1997) discusses the formation of “splash” bridges which are formed during a close encounter (impact parameter smaller than disk radius). Gas clouds of both galaxies collide and form a gas bridge between them, typically without any stellar counterpart. In this kind of bridge no star formation is initially expected. The H i bridge between NGC 1511 and NGC 1511B seems to be a “splash” bridge, suggesting that NGC 1511B has plunged through the outer disk of NGC 1511 during its closest encounter.
 |
 |
5.2 The kinematics of NGC 1511 and its companions
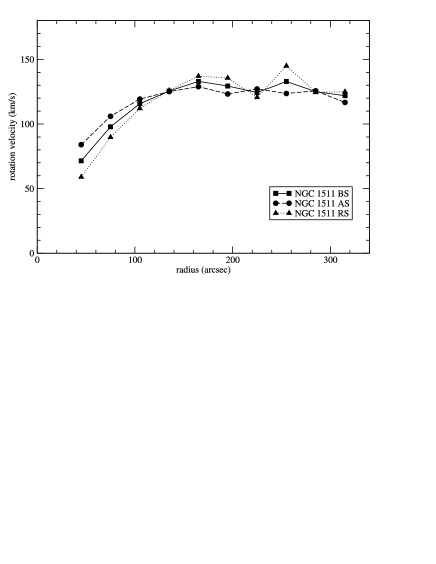
In the inner part of its disk NGC 1511 shows a clear rotation pattern. By fitting all rotational parameters simultaneously for radii from 30″ to 300″ we find the kinematic center at (J2000) = 390 –67° 38′ 100, a systemic velocity of = km s-1 and a position angle of . We note that there is a substantial offset between the optical center of NGC 1511 as given in Table 1, the 2MASS position, and the kinematic center as determined here. Since the fit of the position angle appeared constant with radius, we fixed its value to 300. The inclination angle was difficult to fit, and we used (Table 1). With the two orientation parameters fixed, we derive a rotation curve for the approaching side (AS), the receding side (RS), and for both sides (BS) of NGC 1511 (see Fig. 6). While the approaching side of the galaxy shows a rather flat rotation curve, the receding side appears slightly irregular, possibly showing the effects of interactions which are most evident at the higher H i velocities in the system. Given a maximum H i rotation velocity of 130 km s-1 and an H i extent of 300″ (25 kpc) we derive a dynamical mass of M⊙. Due to the low angular resolution of our H i data compared to the size of the two companion galaxies, we were not able to fit their rotation curves.
In Table 4 we list the systemic velocities, the rotation velocities and the H i radii of all three galaxies in the NGC 1511 group, as well as their dynamical masses and mass-to-light ratios. For NGC 1511A and NGC 1511B we estimate as the central velocity of the H i spectrum and as the half width of each spectrum, corrected for inclination taken from Table 1.
Adding the dynamical masses of the three galaxies together results in
(group) = M⊙.
For comparison, the virial mass (see Heisler, Tremaine & Bahcall 1985) of
the NGC 1511 group is M⊙, a factor 3.7 larger.
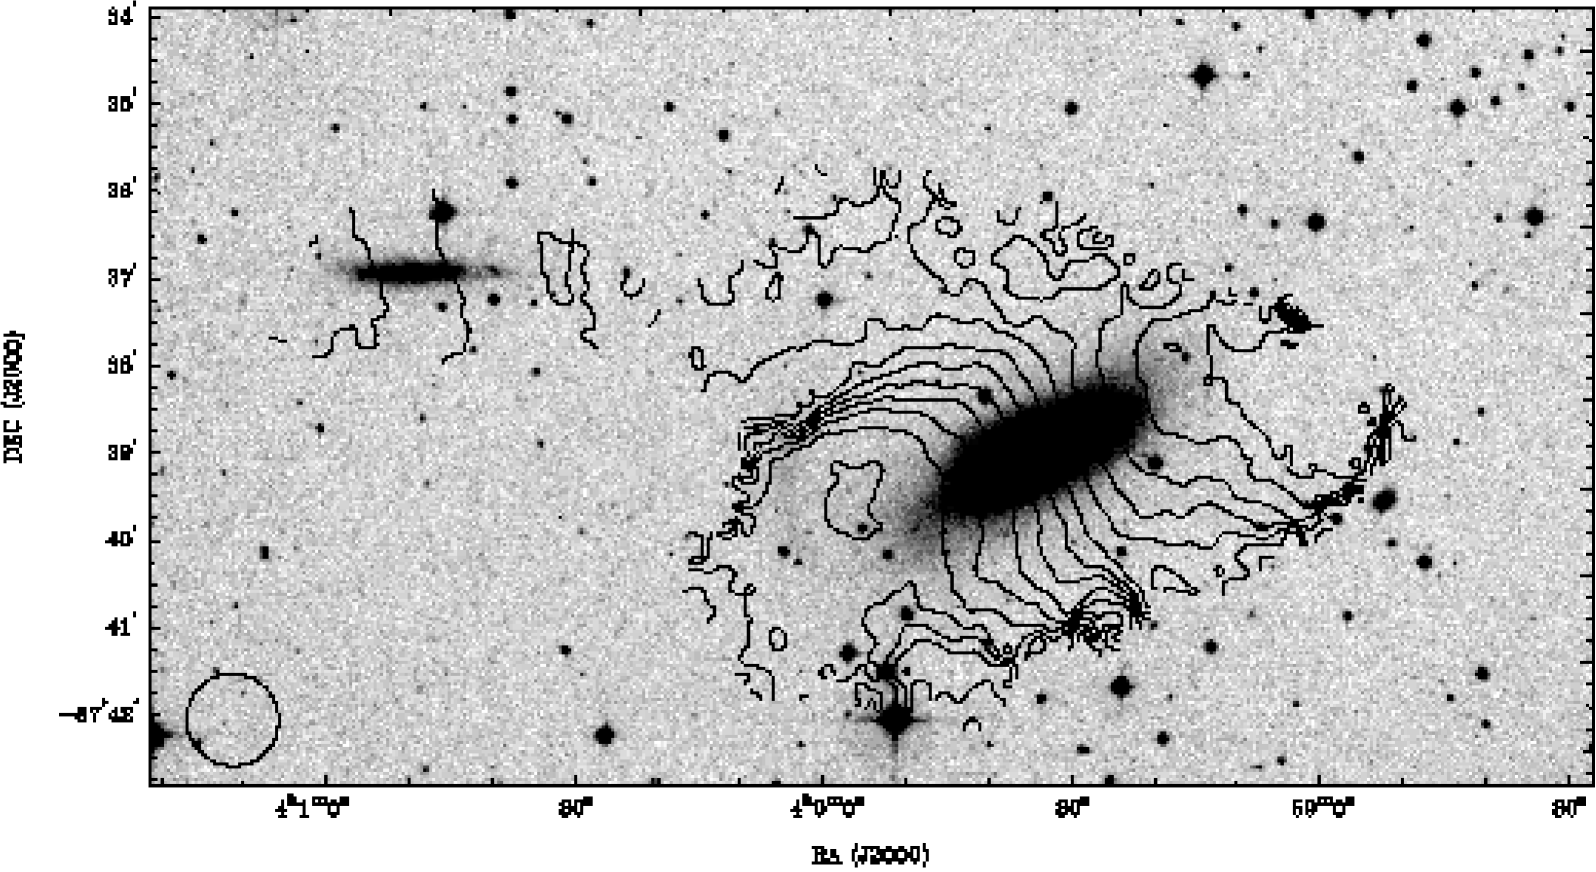
The H i velocity field of NGC 1511 (Fig. 7) shows a
broad distribution with an extension to the south-east towards the peculiar
optical ridge. In that area the optical image of NGC 1511 also shows
peculiarities such as outflows and diffuse extended emission.
| Object | / | / | / | ||||
|---|---|---|---|---|---|---|---|
| (km s-1) | (km s-1) | (kpc) | ( M⊙) | ||||
| NGC 1511 | 1333 | 130 | 25 | 98 | 0.07 | 20 | 1.4 |
| NGC 1511A | 1325 | 88 | 8 | 14 | 0.02 | 20 | 0.4 |
| NGC 1511B | 1425 | 55? | 10 | 7 | 0.07 | 23 | 1.7 |
 |
 |
6 Conclusions
ATCA H i and 20-cm radio continuum observations of the NGC 1511 triplet reveal an H i-rich group with a striking gaseous bridge between the massive galaxy NGC 1511 and its minor companion NGC 1511B as well as substantial star formation in the disk of NGC 1511. While the gas distribution of NGC1511B is strongly affected by the interaction, a second, more distant companion galaxy, NGC 1511A, remains unaffected. There may have been a fourth member of the galaxy group which now appears to be completely disrupted, leaving only the faint stellar remnant and a merging H i distribution. In the following we briefly summarise our results:
-
•
H i emission was detected from all three galaxies in the NGC 1511 triplet. Assuming a distance of 17.5 Mpc for the group we derive H i masses of = M⊙ (NGC 1511), M⊙ (NGC 1511A) and M⊙ (NGC 1511B).
-
•
In addition, we found an H i bridge connecting NGC 1511 and NGC 1511B with an H i mass of up to M⊙. The bridge, which was most likely formed through a close encounter of the two neighboring galaxies, has no apparent optical counterpart. The projected distance between NGC 1511 and NGC 1511B is 37 kpc, indicating an approximate time of 200 Myr since their last collision.
-
•
The H i distribution of NGC 1511B appears to have been severely stretched and displaced by the interaction/collision with NGC 1511. It has a rather narrow H i spectrum (for an edge-on galaxy) and an unusual H i velocity field. In contrast, the more distant companion, NGC 1511A, shows no signs of interaction.
-
•
The peculiar optical ridge found to the east of NGC 1511 may be the stellar remnant of another group member, now completely disrupted by interactions with NGC 1511.
-
•
For the NGC 1511 group we derive a total H i mass of M⊙ (90% of which resides in NGC 1511 itself), a combined dynamical mass of M⊙, and a virial mass of M⊙.
-
•
High resolution ATCA radio continuum data show that most of the emission is occuring in the south-eastern part of the NGC 1511 disk, coincident with a prominent chain of H ii regions. We measure a total 20-cm continuum flux density of 167 mJy for NGC 1511 which corresponds to a star formation rate (SFR) of 7 M⊙ yr-1. Deriving the SFR from the FIR luminosity we determine a value of 2.2 M⊙ yr-1, resulting in a parameter of 2.34. For the companions, NGC 1511A and NGC 1511B, we derive upper limits of SFR = 0.2 M⊙ yr-1.
Acknowledgments
-
•
We acknowledge use of the SuperCOSMOS Sky Survey.
-
•
This research has made extensive use of the NASA/IPAC Extragalactic Database (NED) which is operated by the Jet Propulsion Laboratory, Caltech, under contract with the National Aeronautics and Space Administration.
-
•
The Digitized Sky Survey was produced by the Space Telescope Science Institute (STScI) and is based on photographic data from the UK Schmidt Telescope, the Royal Observatory Edinburgh, the UK Science and Engineering Research Council, and the Anglo-Australian Observatory.
-
•
We thank the referee for some excellent comments.
References
- [1985] Bajaja E., Martin C. 1985, AJ 90, 1783
- [1991] Barnes J.E., Hernquist L. 1991, ApJ 370, L65
- [1994] Broeils A.H., van Woerden H. 1994, A&AS 107, 129
- [1992] Condon J.J. 1992, ARA&A 30, 575
- [2001] Dahlem M., Lazendic J.S., Haynes R.F., Ehle M., Lisenfeld U. 2001, A&A 374, 42
- [2003] Dahlem M., Ehle M., Jansen F., Heckman T.M., Weaver K.A., Strickland D.K. 2003, A&A 403, 547
- [1996] Elfhag T., Booth R.S., Höglund B., Johansson L.E.B., Sandqvist Aa. 1996, A&AS 115, 439
- [2000] Eskridge P.B. et al. 2000, ApJS 143, 73
- [2000] Haarsma D.B., Partridge R.B., Windhorst R.A., Richards E.A. 2000, ApJ 544, 641
- [1985] Heisler J., Tremaine S., Bahcall J.N. 1985, ApJ 298, 8
- [1985] Helou G., Soifer B.T., Rowan-Robinson M. 1985, ApJ 298, L7
- [2001] Hibbard J.E., van Gorkom J.H., Rupen M.P, Schiminovich D. 2001, in ‘Gas and Galaxy Evolution’, ASP Conf. Series Vol. 240, eds. J.E. Hibbard, M.P. Rupen, J.H. van Gorkom, p. 659
- [1988] Huchtmeier W.K., Richter O.G. 1989, A General Catalog of H i Observations of Galaxies (Springer Verlag)
- [2001] Huchtmeier W.K., Karachentsev I.D., & Karachentseva V.E. 2001, A&A 377, 801
- [1994] Irwin, J.A. 1994, ApJ 429, 618
- [2003] Jarrett T.H., Chester, T., Cutri, R., Schneider, S., Huchra, J.P. 2003, AJ 125, 525
- [1998] Kennicutt R.C. 1998, ARA&A 36, 189
- [2000] Kewley L.J. et al. 2000, ApJ 530, 704
- [1993] Koribalski B., Dahlem, M., Mebold, U., Brinks, E. 1993, A&A 268, 14
- [1996] Koribalski B. 1996, in “Barred Galaxies”, IAU Coll. 117, eds. Buta R., Crocker D.A., Elmegreen B.G., ASP Conf. Series Vol. 91, San Francisco, p. 172
- [2004] Koribalski B. et al. 2004, AJ 128, 16
- [2004] Koribalski B., Dickey, J.M. 2004, MNRAS 348, 1255
- [1982] Lauberts A. 1982, ESO/Uppsala survey of the ESO(B) atlas
- [1995] Lehnert M.D., Heckman T.M. 1995, ApJS 97, 89
- [1996] Mathewson D.S., Ford V.L. 1996, ApJS 107, 97
- [2004] Meyer, M.J., et al. 2004, MNRAS 350, 1195
- [1990] Moshir M., et al. 1990, IRAS Faint Source Catalogue, version 2.0
- [1997] Nordgren T.E., Chengalur J.N., Salpeter E.E., Terzian Y. 1997, AJ 114, 913
- [1996] Mihos J.C., Hernquist L. 1996, ApJ 464, 641
- [1982] Reif K., Mebold U., Goss W.M., van Woerden H., Siegman B. 1982, A&A 50, 451
- [1996] Salpeter E.E., Hoffman G.L. 1996, ApJ 465, 595
- [1994] Sandage A., Bedke J. 1994, The Carnegie Atlas of Galaxies
- [1995] Sanders D.B., Egami E., Lipari S., Mirabel I.F., Soifer B.T. 1995, AJ 110, 1993
- [1998] Schlegel D.J., Finkbeiner D.P., Davis M. 1998, ApJ 500, 525
- [1993] Sekiguchi K., Wolstencroft R. 1993, MNRAS 263, 349
- [1997] Smith B.J., Struck C., Pogge R.W. 1997, ApJ 483, 766
- [1988] Strong A.W. et al. 1988, A&A 207, 1
- [1997] Struck C. 1997, ApJS 113, 269
- [2003] Struck C., Smith B.J. 2003, ApJ 589, 157
- [2000] Thornley M.S., Schreiber N.M.F., Lutz D., Genzel R., Spoon H.W.W. Kunze D., Sternberg A. 2000, ApJ 539, 641
- [1972] Toomre A., Toomre J. 1972, ApJ 178, 623
- [1991] de Vaucouleurs G., de Vaucouleurs A., Corwin Jr. H.G., Buta R.J., Paturel G., Fouqué P. 1991, “Third Reference Catalogue of Bright Galaxies” (New York: Springer Verlag), [RC3]
- [1994] Yun M.S., Ho P.T.P., Lo K.Y. 1994, Nature 372, 530