PHYSICAL IMPLICATIONS OF INTEGRAL/SPI GAMMA-RAY LINE MEASUREMENTS OF THE 2003 OCTOBER 28 SOLAR FLARE
The very powerful X-class solar flare of 2003 October 28 was detected with the INTEGRAL spectrometer as an intense -ray flash of about 15 minutes. Despite the non-standard incidence of the solar -rays, time-resolved spectra including several nuclear -ray lines were obtained. Such a measurement with a high-energy-resolution instrument can provide valuable information of the isotopic abundances of the ambient solar material, as well as the composition, directionality and energy spectra of the accelerated nuclei. First results on the measured -ray line ratios and time history of the neutron-capture line are presented.
1 Introduction
Although not devoted to solar physics, the INTEGRAL observatory can provide valuable measurements of the high-energy emission produced in the most powerful solar flares. In particular, the spectrometer SPI can allow fine spectroscopic analyses of the nuclear -ray line emission. These lines are produced by the interactions of flare-accelerated particles with the ambient solar material and their intensities can be used to determine isotopic abundances in the solar atmosphere . In addition, measurements of the shape and redshift of some deexcitation lines can provide complementary information on the directionality and spectra of the accelerated ions .
Very high solar activity was observed in late October and early November 2003, with several flares of class X originating from the same active region of the Sun. In this paper, we briefly review the data obtained with SPI for the X17.2 flare of October 28 . We then present a preliminary analysis of the measured -ray line fluence ratios and of the time history of the 2.22 MeV neutron-capture line.
2 Observations
The -ray emission from the 2003 Oct. 28 flare was detected with SPI as an intense flash of 15 minutes starting at 11:02 UT. The satellite was then observing the supernova remnant IC443, with the Sun at 122∘ from the instrument line-of-sight. Background-subtracted spectra were obtained by using both single and multiple events from the 19 Ge detectors. Four deexcitation -ray lines produced by the interactions of flare-accelerated protons and -particles with the solar atmosphere were detected: at 4.44 MeV from ambient 12C*, and 6.13, 6.92 and 7.12 MeV from ambient 16O*. In addition, we measured a strong line emission at 2.22 MeV from radiative capture of secondary neutrons by photospheric H. The relative fluences of these lines are given in Table 1. They were obtained from preliminary simulations of -ray transmission through the satellite material, for the configuration of INTEGRAL during the flare.
| Line Energy (MeV) | Relative Fluence |
|---|---|
| 2.22 | 10.71.7 |
| 4.44 | 0.920.14 |
| 6.13 | 1.000.17 |
| 6.92 | 0.330.13 |
| 7.12 | 0.200.12 |
3 Line fluence ratios
Calculations of -ray line emission were performed assuming a thick target interaction model and a power-law source spectrum for the accelerated particles . We considered both photospheric and coronal compositions for the ambient medium. For the production of the neutron-capture 2.22 MeV line, we used the code developed by Hua et al . Whereas the emission of the 12C and 16O narrow lines is only due to accelerated proton and -particle interactions, neutron production also depends on the fast heavier nuclei. We assumed for these particles an impulsive-flare average composition obtained from measurements of solar energetic particle events , but allowed the / abundance ratio to vary between 0.02 and 0.5. The cross sections for the production of the 12C and 16O lines are based on Kozlovsky et al .
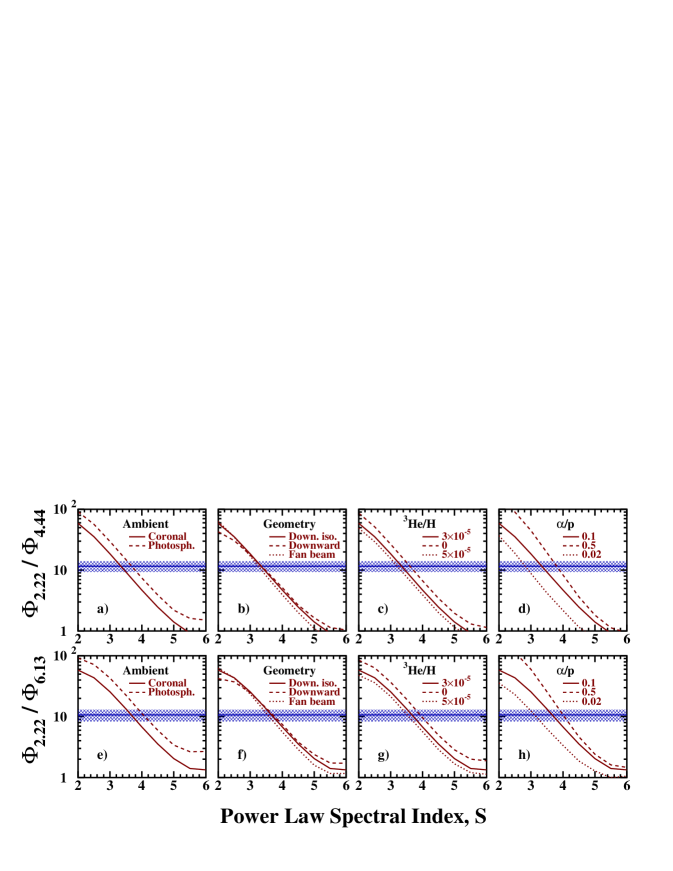
The neutron capture-to-deexcitation line fluence ratios strongly depend on the accelerated particle spectral index , because, on average, the neutrons are produced at higher energies than the 12C and 16O lines (see Fig. 1). But these ratios also depend on the composition of the accelerated particles and the ambient material, as well as on the angular distribution of the interacting ions. We used the calculations shown in Fig. 1 to take into account these uncertainties and obtained from the comparaison with SPI data: =3.150.55, 3.650.55 and 4.0750.475, for /=0.02, 0.1 and 0.5, respectively.
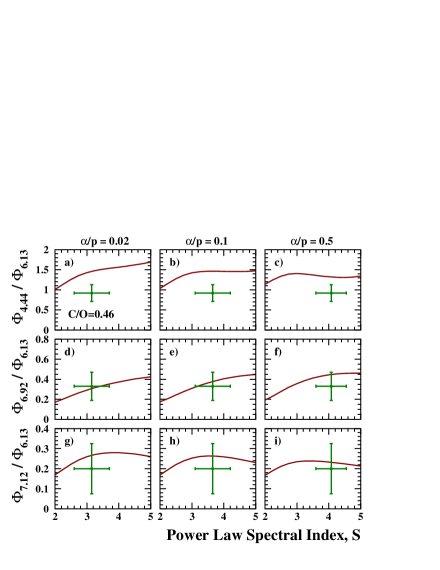
In Fig. 2, we compare calculated 12C and 16O line ratios for these 3 values of / with the SPI data for the corresponding values of . We assumed that the -ray production region is of coronal composition, with C/O=0.46 . We see that the calculated 16O line ratios are in good agreement with the SPI data, given the large uncertainties due to the relatively low statistics obtained for the 7 MeV lines. But we also see that the calculated 4.44-to-6.13 MeV line ratios overestimate the observed value, for all the / ratios. We have further compared our calculations with data obtained for other solar flares with SMM, CGRO/OSSE and RHESSI and found the theoretical 12C-to-16O line ratios to overestimate the average of the measured flux ratios by a factor of 1.5 . This discrepancy suggests that the 12C and/or 16O abundances at the -ray production sites could be different from their generally-assumed coronal values.
4 Time dependence of the 2.22 MeV line emission
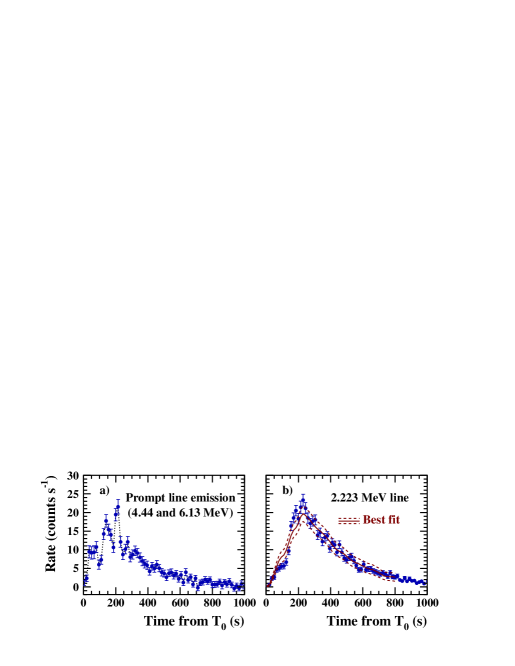
Time history measurements of the 2.22 MeV line can provide a unique determination of the photospheric 3He/H ratio, because neutron capture on 3He via the 3He(,)3H reaction can significantly shorten the delay of the radiative-capture line emission. But as recently emphasized by Murphy et al. , the time history of this line is also strongly dependent on the angular distribution of the interacting flare-accelerated particles. Following these authors, we calculated the 2.22 MeV line production by using a detailed magnetic loop model , for which this angular distribution is parameterized by the level of MHD pitch-angle scattering (PAS) occuring in the coronal portion of the loop. We assumed the neutron-production time history to be identical to the one of the prompt deexcitation -ray line emission, for which good quality data were obtained with SPI (Fig. 3a).
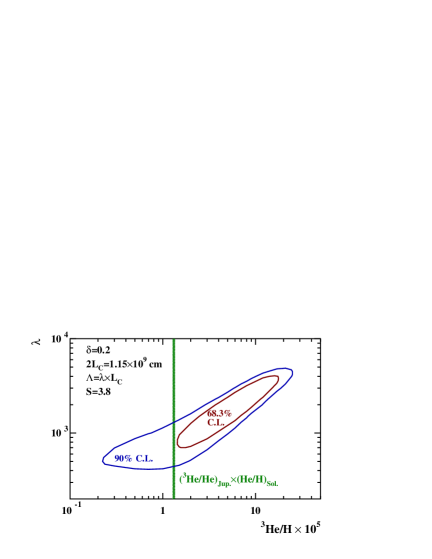
Fig. 3b shows the best fit to the measured count rate of the 2.22 MeV line and Fig. 4 the regions of 1 and 90% confidence levels for the two free parameters. These results are in good agreement with those previously obtained with RHESSI . However, the derived 3He/H ratio is still not well constrained. But the 4.44 and 6.13 MeV line shapes measured with SPI will allow an independent determination of , which should significantly reduce the uncertainty on the photospheric 3He abundance (Fig. 4).
Acknowledgments
This work is based on observations with INTEGRAL, an ESA project with instruments and science data centre funded by ESA member states (especially the PI countries: Denmark, France, Germany, Italy, Switzerland, Spain), Czech Republic, Poland, Russia and the USA. We acknowledge A. Bykov for permission to use the data prior to their public release.
References
References
- [1] G. Vedrenne et al., A&A 411, L63 (2003).
- [2] R. Ramaty, N. Mandzhavidze and B. Kozlovsky in AIP Conf. Proc. 374, High Energy Solar Physics, ed. R. Ramaty et al., (New York: AIP, 1996), 172.
- [3] D. Smith et al., ApJ 595, L81 (2003).
- [4] M. Gros et al. in Proc. of the 5th INTEGRAL Workshop, The INTEGRAL Universe, ESA Publication SP-552, 669 (2004).
- [5] K. Lodders, ApJ 591, 1220 (2003).
- [6] D. V. Reames, Space Sc. Rev. 90, 413 (1999).
- [7] X.-M. Hua et al., ApJS 140, 563 (2002).
- [8] B. Kozlovsky, R. J. Murphy and R. Ramaty, ApJS 141, 523 (2002).
- [9] V. Tatischeff et al., in preparation.
- [10] R. J. Murphy et al., ApJ 595, L93 (2003).