On the nature of EXO 0423.40840
Abstract
We present a Chandra observation of the candidate BL Lac object EXO 0423.40840. The X-ray emission from EXO 0423.40840 is clearly extended, and is associated with an optical early-type galaxy, MCG-01-12-005, at the centre of cluster ClG 0422-09. We do not detect a point source which can be associated with a BL Lac, but we found a small radio source in the centre of MCG-01-12-005. The cluster gas temperature mapped by the Chandra observation drops continuously from 80 kpc towards the centre, and is locally single phase. We measure a metallicity profile which declines outwards with a value 0.8 in the centre, dropping to 0.35 at larger radius, which we interpret as a superposition of cluster gas and a dense interstellar medium (ISM) in the central galaxy. Although the temperature profile suggests that conduction is not efficient, the ISM and intra-cluster medium seem not to have mixed. The entropy profile declines continuously towards the centre, in agreement with recent results on groups and clusters. The radio source appears to have had some effect in terms of gas heating, as seen in the small scale (10 kpc) entropy core, and the asymmetric hard emission on the same scale.
keywords:
galaxies: individual: MCG-01-12-005 and EXO 0423.40840 — X-ray: galaxies: interstellar medium — radio: galaxies — galaxies: active: BL Lacertae — galaxies:clusters:intergalactic medium:individual: EXO 0422, ClG0422-091 Introduction
EXO 0423.40840 was discovered as part of an EXOSAT high galactic latitude survey (Giommi et al. 1991). The source was associated with the = 15.9 mag galaxy MCG-01-12-005, a radio source (with 6 cm flux density 44 mJy) with no optical emission lines. It was classified as a candidate BL Lacertae object on the basis of its X-ray luminosity (above erg s-1) and its position in the diagram, and is included as a BL Lac object in the Véron-Cetty & Véron (2003) catalogue. Observations with CANGAROO give an upper limit for the -ray flux above 2 TeV of less than photons cm-2 s-1 (Roberts et al. 1998) but the results are not conclusive on the nature of the source. Kirhakos & Steiner (1990) determined a redshift of 0.0392 for the source they designate IRAS 04235-0840B and identify with the HEAO source 1H 0422-086, which they classify as a type 2 Seyfert, and associate with EXO 0423.40840.
MCG-01-12-005 is an early type galaxy close to the centre of galaxy cluster ClG 0422-09, at . White, Jones & Forman (1997) described it as a cooling-flow cluster and give a temperature of 2.9 keV (from Edge & Stewart 1991). ASCA data analysed by Ikebe et al. (2002) implied a temperature of k keV from the relation, and a 0.1-2.4 keV luminosity of (5.3 erg s-1. The Galactic absorption for EXO 0423.40840 is 6.22 cm-2 (Dickey & Lockman 1990), and the reported in X-ray analysis of the galaxy cluster is 6.4 cm-2 (e.g Ikebe et al. 2002).
In this paper we present Chandra observations of EXO 0423.40840 which give us new insights into the nature of this source. Throughout this paper, we adopt a redshift for EXO 0423.40840 of and a cosmology with = 70 km s-1 Mpc-1, and =0.7. The angular diameter distance to this source is 159 Mpc, and its luminosity distance is 172 Mpc. At the redshift of the source, 1 arcsec corresponds to 773 pc.
2 Observations and preparation
2.1 Chandra data
EXO 0423.40840 was observed with Chandra in December 2002 (Observation ID 03970) as part of a small sample of BL Lac objects with relatively weak cores, which included PKS 0521356 (Birkinshaw, Worrall, Hardcastle 2002), with the primary objective of studying the interaction between the jet and the group or cluster X-ray medium. Since the BL Lac core of EXO 0423.40840 was expected to produce a high X-ray count rate, the observation was performed in faint mode and with a small window with the back-illuminated chip S3 on the Advanced CCD Imaging Spectrometer (ACIS). This window was 128 pixels (of 0.4920.492 arcsec2 each) wide, and 1024 pixels long. We processed the level 1 event data using ciao v3.0.2 and calibration database (CALDB) 2.26. We removed bad pixels using the supplied bad pixel file, and retained events of grade 0,2,3,4, and 6. We verified that there are no periods of statistically higher background by generating light curves in different energy bands, and the useful exposure time is 14280 s. The online aspect calculator111http://cxc.harvard.edu/ciao/threads/arcsec_correc
tion/ shows that no aspect correction was necessary for these data, therefore the X-ray, radio and optical frames should align to the Chandra aspect uncertainty arcsec.
2.1.1 Spatial analysis
The analysis of the diffuse emission started with our use of wavdetect to identify possible point sources in the field. The algorithm was used with a source detection threshold222For detail see http://cxc.harvard.edu/ciao/download/doc/
detect_html_manual/vtp_ref.html#par:wav_sigthresh set to 10-9 (the minimum value for the algorithm to give an accurate enough detection), and only found a single point source at RA = , Dec = (J2000).
The characterisation of the diffuse emission is affected by the half-chip observation, which induces border effects to the north-east and south-west. We corrected these effects via the exposure map, generated using the aspect histogram and the instrument map. When appropriate, the counts image was converted into a flux image by dividing it by the exposure map.
2.1.2 Spectral analysis
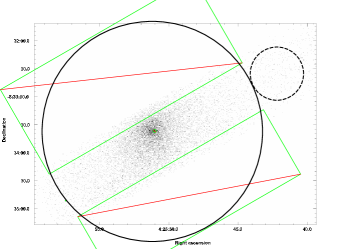
For spectral analysis, we accounted for the position-dependent redistribution matrix file (RMF) and the auxiliary response file (ARF) for the source, which were computed from Chandra calibration database 2.26. This release takes into account a correction for the degradation of the low-energy quantum efficiency. We extracted spectra in successive circular annuli, excluding the point source and small scale structures (see Sec. 5). The background for all annuli was chosen to be the same, and was extracted in a circle of radius 28.5 arcsec (see Fig. 1) centred at RA = , Dec = (J2000). For the spectral analysis we excluded the regions close to the chip boundary. If not otherwise specified, spectra were fitted with absorbed plasma models in XSPEC v11.3. We tried fits using the APEC (Smith et al. 2001) and mekal (Mewe, Gronenschild, van den Oord 1985; Liedahl, Osterheld, Goldstein 1995) codes; the latter gave better fits. We scaled abundances to the standard solar values from Grevesse & Sauval (1998).
2.2 Radio data
A-array VLA data for EXO 0423.40840 at 1.4, 4.9, and 8.6 GHz were extracted from the National Radio Astronomy Observatory (NRAO) archive, and processed into maps through the normal processes of calibration and CLEANing. At 1.4 and 4.9 GHz it was possible to self-calibrate the data to improve the final maps, but the high noise and short observation at 8.6 GHz made this impossible.
All three maps easily detect a bright extended radio source near the centre of the X-ray emission. At 1.4 GHz the radio map has a synthesized beam of arcsec, and does not well define the structure of the radio source. However, at this lowest frequency we also find a diffuse source located near RA = , Dec = which may (or may not) be associated with EXO 0423.40840. Unfortunately, this structure lies off the field of the Chandra X-ray observation.
The 4.9-GHz image of EXO 0423.40840 (Fig. 2) shows the radio emission to be from a small double source. At this resolution ( arcsec) the two components are well separated, but it is unclear based on the radio data whether one of the components is a core and the other is a one-sided jet or both components are lobes symmetrically disposed about the core.
The 8.4-GHz image has arcsec full-width-half-maximum (FWHM) but a high noise level, so that we cannot currently distinguish which component has the flatter spectrum, or whether there is a core present between the two components. Further high-resolution, higher-sensitivity radio data are needed to resolve this issue.
3 X-ray morphology
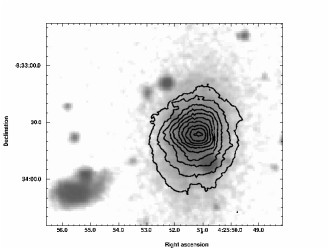
EXO 0423.40840 shows clear diffuse X-ray emission (see Fig. 1). The X-ray peak is at RA = , Dec = (J2000) which is close (less than 5 arcsec) to the NASA/IPAC Extragalactic Database (NED) position of galaxy MCG-01-12-005, and coincident with the point source detected by wavdetect333At the time of writing NED associates EXO 0423.40840 with galaxy pair MCG-01-12-006, and gives coordinates for EXO 0423.40840 of RA = , Dec = (J2000). The Chandra data show this to be an error, since no X-ray emission is associated with MCG-01-12-006. SIMBAD correctly associates EXO 0423.40840 with galaxy MCG-01-12-005.. The centre of the cluster of galaxies ClG 0422-09 is at J2000 coordinates RA = , Dec = , less than 2 arcsec from the Chandra X-ray peak. The Chandra image suggests that the bulk of the X-ray emission from EXO 0423.40840 is not due to the expected BL Lac object, but is diffuse in nature and originates from the intergalactic medium (IGM) of galaxy MCG-01-12-005, and intracluster medium (ICM) of galaxy cluster ClG 0422-09.
The optical emission of MCG-01-12-005 from the Digital Sky Survey (DSS; Fig. 1) is elongated in the N-S direction, while the X-ray emission in the central regions displays a slight elongation in the E-W direction. The X-ray contours become more circular at larger distance from the centre.
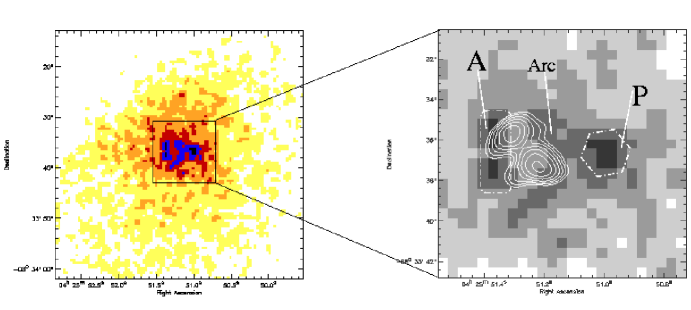
A more extended structure lies east of the X-ray peak and causes the elongation of the central region of the X-ray contours. We applied a Gaussian filter of FWHM 0.98 arcsec to the (0.4-7.0 keV) image, to enhance the extended structure (see Fig. 2). Two X-ray enhancements to the east of the X-ray peak, labelled with , seem to be connected to the compact source (labelled with ). However this structure is barely significant. The other extended structure (marked as in the insert of Fig. 2) is significant at 11 above the surrounding area. In this Figure we also show the radio contours from the 4.9 GHz map. We observe that the radio emission is located in a region of lower X-ray surface brightness than its immediate surroundings. We note that the optical centre of the galaxy and the southern peak of the radio emission at 4.9 GHz coincide, suggesting that this is a likely location for the X-ray centre of the object. Unfortunately, the radio data are not sufficient to define the location of the core emission.
To avoid difficulties arising from the uncertain location of the X-ray centre, we excluded structure and the compact source () for our analysis of the large scale structure. We will discuss the structure at the centre in a separate section. We replaced these two structures with their local surrounding mean counts and calculated the centroid of the resulting X-ray emission, which was found to be at RA = , Dec = (J2000). For any extended source analysis in the following, this will be fixed as the centre of the Chandra data.
4 Cluster emission
4.1 Surface-brightness profile
We extracted a surface-brightness profile by integrating photons in concentric 1-arcsec wide annuli (masked by the rectangular regions in 1) out to 118 arcsec and in the 0.4-2.0 keV energy range. We subtracted a local background represented by the (masked) annular region between 120 and 130 arcsec. The inner 3 arcsec of the profile display some fine-scale structure (see Fig. 3), presumably from errors in the interpolation over structures and as discussed above. The excess emission represented by bins 2 and 3 has little effect on the parameters of fits to the overall structure of the cluster, but it increases the total . We thus excluded these two bins when fitting. We binned the surface-brightness profile to have a signal-to-noise (S/N) of at least 3 above the background in each bin. We then initially fitted the profile with a 1D -model:
| (1) |
where and are the core radius and the index, and is the central surface brightness. The model in equation 1 is not a good representation of the data, providing best-fitting parameters of counts s-1 arcmin-2, , arcsec ([10.7] kpc) for a reduced , = 1.64 = 147.9/90 d.o.f. (the rises to 1.95 if bins 2 and 3 are taken into account, but and do not change within the errors).
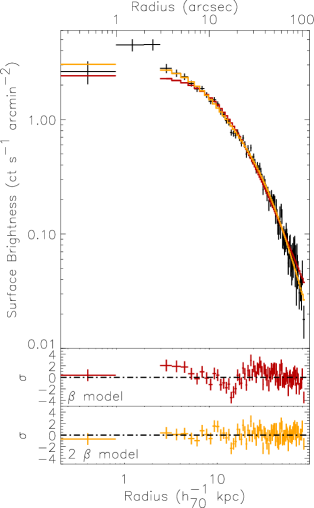
The fit improved when we fitted the profile with a sum of two models,
| (2) |
where and are defined as in Eq. 1. We required the parameters of both models to be the same in order to have a smooth power law shape for the density profile444We also tried fits with two separate parameters, but the -test indicates no significant improvement in the fits when the second is allowed to vary independently from the first. at large radii. This model gives an excellent fit of = 1.03 = 90.2/88 d.o.f., with counts s-1 arcmin -2, arcsec ([8.3] kpc), counts s-1 arcmin -2, arcsec ([29.7] kpc), and . For comparison, the analysis of ROSAT data by Reiprich & Böhringer (2002) found a value of and -1 kpc. The values are in good agreement if the two- model is considered. In Fig. 3 we show the data points and both the single and double best-fit models. The lower two windows show the residuals. We derive the gas density distribution in combination with the spectral analysis.
4.2 Global spectrum
We extracted the global spectrum of the source by selecting a circular region of radius 118 arcsec (see Fig. 1). To limit spurious effects produced by the boundary of the exposed part of the chip, we excluded two rectangles of size arcsec2 centred on RA = , Dec = , and RA = , Dec = (J2000), respectively with the same orientation as the CCD (position angle = 30∘). The compact source was also excluded. We took background from the usual circle (Sec. 2.1.2; Fig. 1).
The source has a 0.4-7.0 keV count rate of 1.27 cts s-1 in this region. We binned the spectrum to 60 counts per bin prior to background subtraction. The global spectrum (see Fig. 4) shows strong emission at the energy corresponding to the Fe L complex. Other spectral features are also detected, although some of them are instrumental (e.g. the region 1.9-2.1 keV near the Ir edge) and are excluded when fitting. We fitted the global spectrum between 0.4 and 7.0 keV with thermal models in XSPEC (version 11.3.0), leaving the fractional abundance relative to solar free to vary, and initially adopting a Galactic absorption of cm-2 (Dickey & Lockman 1990).
A single mekal model gives a bad fit with d.o.f., a temperature of about 2.8 keV and a metallicity of 1.4 solar, with large residuals at low energy. A much improved, though still unacceptable fit, with d.o.f., is obtained if the absorption is allowed to vary. The resulting = (1.19 cm -2 is roughly double the expected Galactic absorption.
An alternative explanation for the poor fit at low energy might be thought to be systematic errors in the used (version 2.26) calibration of the quantum efficiency degradation of the ACIS-S3 chip. To test this we repeated the fit but used only data above 1 keV. The resulting fit (Table 1, column 3) is statistically indistinguishable from a fit using the full energy range, and so we concluded that the high is not an artifact of the data processing.
Fitting a two-mekal model with as a free parameter in the 0.4-7.0 keV range gives d.o.f. The -test indicates that the two-temperature model is a better representation of the data at 99.9% significance (see Fig. 4). The best-fitting results are listed in Table 1. The 0.2-10.0 keV total unabsorbed luminosity is 3.7 erg s-1. A model composed of a mekal plus a power law gives a better fit (/d.o.f.=222.2/145) than the single temperature representation, but does not improve on the two-temperature model (see Table 1) and the spectral index is not well determined. We thus do not discuss this model any further.
| Parameter | 1T | 1T | 1T | 2T | 1T+1PL | 1T+1CF |
|---|---|---|---|---|---|---|
| (0.4-7.0 keV) | (0.4-7.0 keV) | (1.0-7.0 keV) | (0.4-7.0 keV) | (0.4-7.0 keV) | (0.4-7.0 keV) | |
| ( cm | 0.62 (fixed) | 1.19 | 1.20 | 1.42 | 1.27 | 1.27 |
| kT1 (keV) | 2.83 | 2.36 | 2.50 | 2.47 | 2.00 | 2.61 |
| 1.42 | 0.72 | 0.90 | 0.91 | 0.60 | 0.88 | |
| () | 6.12 | 8.49 | 7.77 | 7.80 | 7.72 | 7.09 |
| kT2 (keV) | — | — | — | 0.38 | — | — |
| () | — | — | — | 0.33 | — | — |
| (keV) | — | — | — | — | 1.54() | — |
| () | — | — | — | — | 0.31 | — |
| k (keV) | — | — | — | — | — | 0.08 |
| — | — | — | — | — | 10.0 | |
| /d.o.f. | 322.0/148 | 234.0/147 | 153.5/107 | 211.3/145 | 222.2/145 | 216.3/145 |
Abundances are from Grevesse and Sauval (1998). In the two-temperature mekal model the abundances of the two thermal components were tied. is the normalisation given by XSPEC, as ∗ , where is the angular size distance to the source (cm), is the electron density (cm-3), and is the hydrogen density (cm-3). Errors are quoted at 90% confidence for one interesting parameter. The energy range used for fitting is listed for each fit.

The results on the global spectrum suggest the following:
-
1.
the gas spectrum is consistent with a two-temperature model. Spectral fitting to ASCA data (see e.g. Ikebe et al. 1999, Makishima et al. 2001) suggested that a two-temperature model can mimic a multi-temperature gas as well as a cooling flow (CF), and the contribution of the cD galaxy has to be taken into account. We thus fitted the global spectrum with a model composed of a mekal plus mkcflow (Mushotzky & Szymkowiak 1988). The high temperature of the CF model was fixed to be the same as the mekal model temperature. The metallicities were forced to be the same and the absorbing column density left free. The best-fit has d.o.f. The high temperature is k keV, the low temperature is poorly constrained, with a best-fit value of k keV (and upper limit of 0.45 keV), the metallicity , and the = (1.27 cm-2, all in agreement, at 90% confidence, with the two-temperature model described above, though a worse fit. The mass deposition rate is 10 M⊙ yr-1.
-
2.
the absorption is higher than Galactic by more than a factor of 2. As shown later (Sec. 4.3.1) the excess absorption encompasses the whole field of view and not only the cool central part of the cluster, suggesting that this excess absorption is of Galactic rather than intrinsic origin. No CO map in the direction of our source is good enough to establish if molecular gas contributes the needed column. However, there is a good correlation between Galactic HI and the infra-red (IR) emitting dust (see Boulanger et al. 1996). Pointecouteau et al. (2004) found a remarkable agreement between their X-ray fitted profile, and the total profile derived from this correlation. To test if this interpretation is applicable to EXO 0423.40840, we looked at the Infra-Red Astronomical Satellite (IRAS) map at 100 m, in the direction of the source (Schlegel, Finkbeiner, & Davis 1998). The map shows bright clumpy emission, with strong gradients. The IRAS map is at far larger spatial scales than the Chandra field of view, but the 100 m flux in the vicinity of the field is MJy sr-1. The IR - relation of Boulanger et al. (1996) then predicts HI cm-2. This is in good agreement with our best-fit results from the global Chandra spectrum, suggesting the absorption excess is, indeed, from molecular gas.
4.3 Temperature and abundance profiles
In order to perform spatially resolved spectroscopy, we selected concentric annular regions out to 118 arcsec, masked by the rectangles seen in Fig. 1. The first bin is of radius 5 arcsec, just outside the bright structures in the centre. Possible variations of the spectral modelling within this region are discussed in Section 5, but they do not affect our conclusions here.
4.3.1 Projected quantities
We obtained a projected temperature profile by fitting each annulus with a mekal model. We used the same background as for the global spectrum. All spectra were binned to 15 counts per bin prior to background subtraction, and fitted between 0.4 and 7.0 keV.
In order to test if is constant within the area of the X-ray detection, we fitted each annulus with a mekal model with , temperature and abundances as free parameters. We found that all the column densities are consistent with the value found in the global analysis (within 1 errors). To strengthen this result, we fitted the spectrum in each annulus by excluding data below 1 keV. (This also tests for possible spatial variation of the quantum efficiency degradation at low energy.) These fits are consistent with those in the full energy range. We thus confirm that is a factor of two higher than the value predicted by the HI measurements at all radii, and that it is constant over a scale arcsec (90 kpc), with a global value of cm-2. In the following the column density is fixed to this value.
We next fitted the spectra again in each annulus, between 0.4 and 7.0 keV, with an absorbed mekal model with fixed. A single-temperature model is an acceptable representation of the data in each annulus. However, to test possible contamination from a non-thermal source in the inner bin, we added a second component, represented by a power law, when fitting the first bin. The additional second component is not required (we also added a second thermal model, and the conclusion is similar).
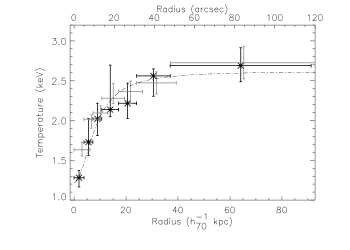
The projected radial temperature and metallicity profiles are shown in Fig. 5 by the grey data points (crosses). Displayed errors are 1 for one interesting parameter. There is a clear temperature drop towards the centre, with a minimum projected k keV. The temperature rises almost monotonically with radius to reach a maximum of 2.8 keV in the outermost bin, which is in agreement with the global temperature found with ROSAT (White et al. 1997). This suggests that the Chandra data are giving us a fine-scale measurement of the cool gas in the core region.
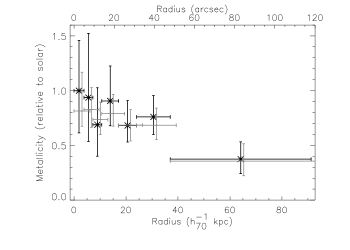
The projected metallicity profile drops continuously from a value of 0.8 in the centre to =0.35 in the outermost region.
4.3.2 Correcting for projection effects
We accounted for projection effects in the profiles of Fig. 5 by using the projct model in XSPEC, and assuming spherical symmetry. The volumes of each shell are calculated by the model once the inner and outer boundaries of each annulus are added to the FITS headers of each spectrum. Since the cluster emission extends well beyond our outermost annulus, the emitting volume associated with the outermost annulus will be too small. The effect is to underestimate the brightness of the next annulus in.
We fitted an absorbed, single-temperature mekal model in which the temperature and metallicity were left as free parameters at each radius. The column density was fixed to the global value as before. The best-fitting model gives = 802.6/791 d.o.f.
The asterisks in Fig. 5 show the deprojected temperature and abundance profiles of the cluster. When projection effects are taken into account, the temperature in the central bin is significantly cooler than its respective projected value, since the hot gas from the outer regions seen in projection is accounted for. For the outer annuli the projected and deprojected temperatures agree within the errors.
The metallicity declines outwards and within the errors is also consistent with a constant value of 0.8 within 40 arcsec and then drops to in the outermost bin.
From the deprojected emission measure it is possible to calculate the ion and electron density directly from XSPEC. Under the assumption that the density is constant within each annulus, the ion density is simply:
| (3) |
where is the normalisation from the deprojected mekal model fitting, is the angular diameter distance and is the volume of the shell.
The electron density is then obtained from the relation (see e.g. Worrall & Birkinshaw 2004)
| (4) |
where is the mass fraction in hydrogen, for normal cosmic (solar) abundances.
The derivation of the electron density directly from XSPEC is a suitable alternative option to the classical method of inverting the surface brightness profile into a density profile. The latter method requires us to estimate the emissivity function at each radius, and this is a strong function of the assumed temperature for a cluster at keV, even if energies below 2.0 keV are used when generating the surface-brightness profile. We will see that the two methods are, in fact, in agreement. In the top panel of Fig. 6 we show the electron density derived from the best-fit normalisation, assuming that the density is constant within each annulus. Since the cluster extends well beyond our outermost annulus, we overestimate the electron density in the last bin. To correct for this effect we note that:
- 1.
-
2.
the ROSAT data provide the best measures of the cluster at larger scale, and the best-fitting found by Reiprich & Böhringer (2002) is in excellent agreement with our value. This suggests that the extrapolation of our best-fitting -model is a reasonable representation of the outer shells of the gas emission.
For these reasons, we corrected the density in the last annulus to equal the -model-derived density at its distance from the centre (83 arcsec). We added a 20% systematic error to this bin. The corrected density is 50% lower than the original value, as shown in Fig. 6 by the dashed point. A similar argument applies to the proton density profile. We used the corrected values to calculate the entropy and pressure profiles below.
We also note that the first data point is higher than (but consistent with) the -model profile (continuous line). This arises from the exclusion of the excess emission in the central 5 arcsec when fitting the model (second and third bin in Fig. 3), while this excess was not excluded when we extracted the central spectral annulus (but note that the compact source and the extended structure described in Sec. 3 were masked).


4.4 Entropy and pressure profiles
The middle panel of Fig. 6 shows the profile of (Lloyd-Davies et al. 2000), which is related to the entropy per unit mass in the gas, derived from the temperature and density profiles obtained from the spectral fits.
It is useful to fit the temperature profile with an analytical function. Here we use (Allen et al. 2001)
| (5) |
where our best-fit has keV, keV, and arcsec, close to the value of from the radial profile fit. The exponent, =2, was fixed to the best-fitting value found by Allen et al. (2001). We then calculated the entropy profile using the best-fitting temperature model and the isothermal -model-derived electron density profile. This is shown in Fig. 6 by the dashed line. The dot-dashed line shows the S behaviour found in analytical and semi-analytical models (Tozzi & Norman, 2001; Voit et al. 2002), and which is also found in numerical simulations without complex gas physics (e.g Borgani et al. 2001). The normalisation is arbitrary.
A simple power-law fit of the form to this entropy profile yields a slope ( is in arcsec). The effect of adding a constant () is to increase the slope. The full details of the power law plus constant fit are , and . An -test indicates that there is less than 1 per cent chance that the simple power law is a better fit.
It is now common to find the entropy profile scaled by , the radius within which the mean cluster density is 200 times the mean density of the Universe. If we use the equation in Evrard, Metzler & Navarro (1996), and the external temperature of the cluster (2.9 keV), we obtain Mpc for EXO 0423.40840. This implies that our outermost annulus corresponds to , which is too small to allow useful comparisons with previous work on clusters with similar temperatures. Pratt & Arnaud (2004) found for a small sample of clusters with keV. Although this is calculated in the range (0.05-0.5) , it looks consistent with the result we find here for EXO 0423.40840.
The bottom of Fig. 6 shows the pressure profile, where we compare the results when we use the XSPEC proton density profile (data points) and the isothermal -model density profile (continuous line).
5 The central region
In previous sections we have described the small-scale structure in the central 4 arcsec of EXO 0423.40840 (see Fig. 2). In the surface-brightness profile (Sec. 4.1) we found excess emission above a -model, despite the fact that the compact source detected with wavdetect, and the more elongated emission labelled as in Fig. 2 were masked before extracting the radial profile. We also noted that the centre of the galaxy (and the cluster) displays a lower X-ray surface brightness than the immediate surroundings. In this section we explore the nature of the compact source and the extended structure, and investigate the relation between the central gas and the radio source.
We extracted a spectrum of source from a circular region of radius 1.35 arcsec centred on RA= , Dec = (J2000). The local background was estimated in the surrounding annular region within radii 1.35 and 2.95 arcsec. There are only 38 net counts in this region. Adopting C-statistics we found that a power law of spectral index 2.5 is a reasonable description of the data (the column density was fixed to the global value). With this model the unabsorbed 0.2-10 keV flux of the source is 3.9 ergs s-1 cm-2. A thermal model also describes the data well, but the temperature is not constrained. With the data available, we can not state if the source is a clump of thermal gas within the cluster or a background (foreground) quasar, although the non-thermal interpretation seems more plausible from the spectral analysis. Given the positional offset between this source and the radio emission, it is unlikely that this is the BL Lac object we were looking for. We mask this source for the following analysis.
We also extracted a spectrum of structure . We have even fewer photons but the spectrum shows a clear thermal signature, and a temperature consistent with the temperature that we found for nearby gas when this structure was excluded (Sec. 4.3). Since the surface-brightness profile displays excess emission between 1 and 4 arcsec from the centre, even after excluding structure , we suggest that is of the same nature as the excess surface brightness, and its brightness may be due to projection effects or the particular geometry of the source.
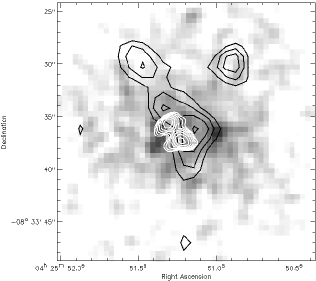
To investigate the spectral signature of the excess surface brightness, we extracted the surface brightness profile of EXO 0423.40840 between 0 and 15 arcsec in smaller radial annuli than in Sec. 4.1, and in two energy bands: a soft band (S) at 0.4-2.0 keV, and a hard band (H) at 2.5-6.5 keV. At larger scale the profile was binned in 5 arcsec wide annuli. We then obtained an hardness ratio (HR) profile by calculating (Fig. 7). The average value of the HR is -0.77, reflecting the soft spectrum of the gas. Points at radius arcsec are consistent (within the statistical errors) with this average value. We generated S and H images and smoothed them with a Gaussian filter of =2 pixels (0.98 arcsec). In the bottom of Fig. 7 we show the soft image in grey scale. The black contours are obtained from the Gauss filtered hard image and the white contours are from the radio map at 4.9 GHz. The hard emission is detected above the background at . We observe that the hard emission is centred in the region of low surface brightness soft X-ray emission coincident with the optical centre of the galaxy, and that it is oriented in the same direction as the radio source but is more extended. The peaks of the hard X-ray and radio emission are not coincident, but this is likely to be a consequence of the smoothing, and is not significant. The peak to the north-west (black contours) is probably an unrelated source.

What is the physical relationship between the radio source and the surrounding ICM? First of all, there are two peaks in the 4.9 GHz radio map. We label as the southern component at RA = , Dec = , and as the northern component at RA = , Dec = . The 8.46 GHz map shows a peak of flux density 0.8 mJy between component and , while components and are resolved and show steeper spectra. More sensitive radio observations would be needed to decide whether the core of the source lies in or , or in the weak component that appears to lie between them. If we make the assumption that the source is in equipartition between radiating particles and magnetic field, we find an equipartition magnetic field of 7.4 nT and a pressure of 1.5 Pa for both components (we assumed a spectral slope of 2.2, minimum electron Lorentz factor of 100, maximum electron Lorentz factor of 105, and filling factor equal to 1). From the pressure profile discussed in Sec. 4.4 the pressure of the external medium at the distance of each of the radio components from the optical centre is Pa, which is only a factor of from the internal minimum pressure of the source, suggesting that the source is close to pressure balance.
6 Discussion
We summarise below the results from our study of EXO 0423.40840 using the high resolution of Chandra.
-
1.
The X-ray emission from EXO 0423.40840 is extended, without the strong point-like component expected for a BL Lac object. EXO 0423.40840 is in fact associated with a cluster of galaxies, and an early type galaxy which dominates the central optical light;
-
2.
we found absorption in excess of Galactic. This is not intrinsic to the source but of Galactic origin, as shown by the agreement between our X-ray measure and an independent measure which uses the -IR emission relation;
-
3.
we find that the gas is locally isothermal, with a temperature decreasing towards the centre, as found for cooling-flow clusters, and with a temperature of keV at kpc; however, a CF model gives a mass deposition rate of only 10 yr-1;
-
4.
the metallicity profile declines outwards and it is consistent with an almost constant at kpc, and then drops to 0.37;
-
5.
the gas entropy profile behaves as , close to the relation predicted by analytical models of shock heating in spherical collapse, but shows a small core reflecting possible entropy modification in the centre;
-
6.
the central radio source has a minimum pressure that is a factor of 2 below the external medium. Hard X-ray emission from the cluster centre has the same orientation as the radio source, but is more spatially extended.
6.1 ICM or IGM?
The current Chandra observation gives us a precise look into the core of an intermediate temperature galaxy cluster. The radial temperature profile is reminiscent of cooling core clusters, harbouring denser gas in the centre. Are we observing a classical cooling flow? Arguments against the classical cooling-flow models have been extensively discussed since the advent of XMM-Newton (e.g. Tamura et al. 2001; Peterson et al. 2003; Böhringer et al. 2002). In our case, fitting a cooling-flow model to the global spectrum does not give a better fit than a two-phase model, but the temperature profile does suggest a cooling flow.
Another interesting possibility is that we are observing the interstellar medium (ISM) of the early type galaxy. Indeed our Chandra observation maps X-rays only within the optical envelope of the galaxy. A clear indication in favour of this interpretation is given by the metallicity profile. We are not able to map individual elements with the current data, but the fitted metallicity should be dominated by the iron abundance. The EXO 0423.40840 metallicity profile clearly shows a decline from the centre outwards, which can also be seen as a break at kpc, with an average global relative abundance of within this radius and =0.37 outside. Work based on ASCA data found that clusters harbouring cD galaxies display a significant increase in metal abundance towards the centre (e.g. Fukuzawa et al. 2000; Matsushita et al. 1998). Similar results were found with BeppoSax data (e.g. De Grandi & Molendi 2001), and suggest that this is due to metal enrichment by SN type Ia in the cDs (e.g. Finoguenov & Ponman 1999, Matsushita et al. 2002, 2003). The optical galaxy that we associate with EXO 0423.40840, MCG-01-12-005, is not well studied and it is not catalogued as a cD galaxy. However, this interpretation is still plausible, since prior to the advent of Chandra it was almost impossible to map in such detail the inner regions of galaxy clusters, and objects without the striking optical properties of cD galaxies are just starting to be discussed.
An acceptable estimate of the galaxy X-ray temperature is given by the first bin of the temperature profile (k 1.3 keV). We find a corresponding X-ray luminosity of erg s-1, once projection is taken into account, and after extrapolating to 40 kpc (when the cluster emission dominates). Although the temperature is rather high, the values we find are in agreement with the relation of O’Sullivan et al. (2003) for early type galaxies, adding another piece of support to the ISM interpretation for the X-ray emission within 40 kpc of this object. While the temperature increases rapidly after the first bin, and at 40 kpc it is already keV which is too high for the atmosphere of a galaxy, we note that the metallicity and temperature profiles could change independently with different radial functions because of the different physics associated with the transport of heavy ions outwards and thermal energy inwards.
We also note that the gas is consistent with a two-phase metallicity, with a value close to solar within 35 arcsec and close to a common value for galaxy clusters beyond 35 arcsec. This suggests that little mixing between the ISM and ICM has occurred.
6.2 The impact of the radio source
We can use the comparison between the radio source and the ambient medium properties to map the formation history of the core of EXO 0423.40840. We find that the gas entropy declines continuously towards the centre, in agreement with recent results on galaxy groups and clusters (e.g. Ponman, Sanderson & Finoguenov 2003; Pratt & Arnaud 2003; Khosroshahi, Jones & Ponman 2004, Pratt & Arnaud 2004), typically of the same temperature as EXO 0423.40840. Moreover, the large-scale radial dependence of the entropy we measure is in agreement with both analytical models of spherical collapse, and numerical simulations based solely on gravitational collapse (Tozzi & Norman, 2001, Borgani et al. 2001, Voit et al. 2002). It does seem that there is or there has been some modification of the core entropy of this cluster (galaxy). This is seen in the radial dependence of the entropy, where a simple power-law fit gives a shallower slope than expected from pure shock heating, and where a power law plus constant model is clearly a better fit. However there is no flat isentropic core (entropy plateau).
The deviation of other classical scaling laws, such as the relation (e.g. Arnaud & Evrard 1999), from the prediction of purely gravitational models has suggested that some extra heating has occurred. It has been proposed that sources at the centres of clusters (such as AGN or radio galaxies) could cause this heating (e.g. Valageas & Silk 1999; Wu, Fabian & Nulsen 2000; Churazov et al. 2002; Ruszkowski & Begelman 2002). The small core in the entropy distribution of this object would suggest that entropy has been modified in some way, and the central radio source, although weak, may be a plausible candidate for this modification (e.g. Roychowdhury et al. 2004).
An alternative observational indication is given by the comparison between the radio and X-ray luminosity in the cooling region, which should be similar, once a reasonable factor for the conversion between power and radio emission is assumed. The radio source at the centre of EXO 0423.40840 is particularly small. The radio luminosity is of order erg s-1, while the X-ray luminosity of the soft thermal component within 35 arcsec is erg s-1. If only 0.1% of the total power output goes into the radio emission, then the rest of the power can heat the gas. However, this is a rather low efficiency for conversion of the source power into radio emission, and also a high efficiency for heating. From this evidence, it is unlikely that the radio source is supplying sufficient heat to stop any cooling flow.
6.3 The age of the radio source
Since we do not have an independent measure of the magnetic field, we assumed equipartition, yielding the result that the minimum internal pressure of the source is about a factor of 2 lower that the external pressure. The minimum pressure is a lower limit, thus we are facing two possibilities for the small size of the source: the radio source is old and is dying, or the radio source is young.
In the first case, the source was bigger and more powerful in the past. It may have heated the external medium which is now hotter than at the origin, as can be inferred from the relative distribution of hard and soft emission in the core of EXO 0423.40840 (Fig. 7). It is also possible that the source inflated bubbles of rising gas, carrying energy and pressure, as observed for example in M87 (e.g Ghizzardi et al. 2004). However, radio sources are short-lived (10 yr) and when they are starved of fuel they lose power. If this is the scenario we are observing, the radio source should be relatively old, and is in its fading phase. Hints in favour of this picture are the small size of the radio source, the distribution of the hard emission in the central 5 arcsec (Fig. 7), the small entropy core, and the relatively large external pressure at the location of the radio galaxy. We cannot constrain the spatial distribution of the hard emission, which is strongly limited by the statistics. It is unlikely that the hard emission is non-thermal, since high energy electrons cannot live longer than their parent population. Thus it is possible that what we are observing is the signature of gas heating.
The second possibility is that the source is young. The engine has just turned on and the source is expanding. This would explain i) the low surface brightness of the gas at the location of the radio source, and ii) the high surface brightness just outside it. This can be interpreted as an expanding source which is pushing the ambient gas away. If the source is young then it may not have had time to affect the entropy of the gas, which could explain the relatively small heating signatures in the entropy profile.
7 Conclusions
The Chandra observation of EXO 0423.40840 shows that a BL Lac object is absent and we observe an extended, cluster-scale source, which was previously discussed by Edge & Stewart (1991). The central X-ray emission is likely to be due to the ISM of the early-type galaxy at the centre of the cluster, and only at kpc does the ICM dominate over the ISM. The central X-ray emission was little affected by heating in the way observed for other low-temperature clusters. If the source is relatively young, our results represent indirect support for models where AGN activity in the central galaxy may be cause of the breakdown of self-similarity.
Acknowledgements
We are very grateful to G.W. Pratt for many helpful discussions. We thank M.J. Hardcastle for helping in the initial phase of the work. We thank an anonymous referee for a thorough referee’s report which enabled us to improve the manuscript. E.B. and D.M.W. thank PPARC for support. This research has made use of the SIMBAD database, operated at CDS, Strasbourg, France, and the NASA/IPAC Extragalactic Database (NED) which is operated by the Jet Propulsion Laboratory, California Institute of Technology, under contract with the National Aeronautics and Space Administration. The National Radio Astronomy Observatory is a facility of the National Science Foundation operated under cooperative agreement by Associated Universities, Inc.
References
- [Allen et al.(2001)Allen, Schmidt & Fabian] Allen, S.W., Schmidt, R., Fabian, A.C., 2001, MNRAS, 328, L37
- [Arnaud & Evrard1999] Arnaud, M., Evrard, A.E., 1999, MNRAS, 305, 631
- [Birkinshaw et al.(2002)Birkinshaw, Worrall & Hardcastle] Birkinshaw, M., Worrall, D. M., Hardcastle, M. J., 2002, MNRAS, 335, 142
- [Böhringer et al.(2002)] Böhringer, H., Matsushita, K., Churazov, E., Ikebe, Y., Chen, Y., 2002, A&A, 382, 804
- [Borgani et al.(2001)] Borgani S., Governato, F., Wadsley, J., Menci, N., Tozzi, P., Lake, G., Quinn, T., Stadel, J., 2001, ApJ, 559, L71
- [Boulanger et al.(1996)] Boulanger, F., Abergel, A., Bernard, J.-P., Burton, W. B., Desert, F.-X., Hartmann, D., Lagache, G., Puget, J.-L., 1996, A&A, 312, 256
- [Churazov et al.(2002)] Churazov, E., Sunyaev, R., Forman, W., Böhringer, H., 2002, MNRAS, 332, 729
- [De Grandi & Molendi(2001)] De Grandi, S., Molendi, S., 2001, ApJ, 551, 153
- [Dickey & Lockman(1990)] Dickey, J. M., Lockman, F. J., 1990, ARA&A. 28, 215
- [Edge & Stewart(1991)] Edge, A. C., Stewart, G. C., 1991, MNRAS, 252, 414
- [Evrard et al.(1996)Evrard, Metzler & Navarro] Evrard, A.E., Metzler, C.A., Navarro, J.F., 1996, ApJ, 469, 494
- [Finoguenov & Ponman(1999)] Finoguenov, A., Ponman, T. J., 1999, MNRAS, 305, 325
- [Fukuzawa et al.(2000)] Fukuzawa, Y., Makishima, K., Tamura, T., et al., 2000, MNRAS, 313, 21
- [Ghizzardi et al.(2004)] Ghizzardi, S., Molendi, S., Pizzolato, F., De Grandi, S., 2004, ApJ, 609, 638
- [Giommi et al.(1991)] Giommi, P., Tagliaferri, G., Beuermann, K. et al., 1991, ApJ, 378, 77
- [Grevesse & Sauval(1998)] Grevesse, N., Sauval, A.J., 1998, Space Science Reviews, 85, 116
- [Ikebe et al.(1999)] Ikebe, Y.,Makishima, K., Fukuzawa, Y.,Tamura, T., Xu, H., Ohashi, T., Matsushita, K., 1999, ApJ, 525, 58
- [Ikebe et al.(2002)] Ikebe, Y., Reiprich, T. H., Böhringer, H., Tanaka, Y., Kitayama, T., 2002, A&A, 383, 773
- [Khosroshahi et al.(2004)Khosroshahi, Jones & Ponman] Khosroshahi, H.G., Jones, L.R., Ponman, T.J., 2004, MNRAS, 349, 1240
- [Kirhakos & Steiner(1990)] Kirhakos, S.D., Steiner, J.E., 1990, AJ, 99, 1722
- [] Liedahl, D. A., Osterheld, A. L., Goldstein, W. H., 1995, ApJ, 438, 115
- [Lloyd-Davies et al.(2000)Lloyd-Davies, Ponman, & Cannon] Lloyd-Davies, E.J., Ponman, T.J., Cannon, D.B., 2000, MNRAS, 315, 689
- [Makishima et al.(2001)] Makishima, K., Ezawa, H., Fukuzawa, Y., et al., 2001, PASJ, 53, 401
- [Matsushita et al.(1998)] Matsushita, K., Makishima, K., Ikebe, Y., et al., 1998, ApJ, 499, L13
- [Matsushita et al.(2002)] Matsushita, K., Belsole, E., Finoguenov, A., Böhringer, H., 2002, A&A, 386, 77
- [Mewe et al.(1985)Mewe, Gronenschild & van den Oord] Mewe, R., Gronenschild, E.H.B.M., van den Oord, G.H.J., 1985, A&AS, 62, 197
- [Mushotzky & Szymkowiak(1988)] Mushotzky, R. F., Szymkowiak, A. E., 1988, in “Cooling flows in clusters and galaxies”; Proceedings of the NATO Advanced Research Workshop, Cambridge, England, June 22-26, 1987 (A89-27526 10-90). Dordrecht, Netherlands, Kluwer Academic Publishers, 1988, p. 53-62.
- [O’Sullivan et al.(2003] O’Sullivan, E., Ponman, T. J., Collins, R. S., 2003, MNRAS, 340, 1375
- [Peterson et al.(2003)] Peterson, J.R., Kahn, S.M., Paerels, F.B.S., et al., 2003, ApJ, 590, 207
- [Ponman et al.(2003)Ponman, Sanderson & Finoguenov] Ponman, T.J., Sanderson, A.J., & Finoguenov, A., 2003, MNRAS, 343, 331
- [Pratt & Arnaud(2003)] Pratt, G.W. , Arnaud, M., 2003, A&A, 408, 1
- [Pratt & Arnaud(2004)] Pratt, G.W. , Arnaud, M., 2004, A&A, in press, preprint astro-ph/0406366
- [Pointecouteau et al.(2004)] Pointecouteau, E., Arnaud, M., Kaastra, J., de Plaa, J., 2004, A&A, in press, astro-ph/0403596
- [Reiprich & Böhringer(2002)] Reiprich, T.H., Böhringer, H., 2002, ApJ, 567, 719
- [Roberts et al.(1998)] Roberts, M.D., et al., 1998, A&A, 337, 25
- [Roychowdhury et al.(2004)] Roychowdhury, S., Ruszkowski, M., Nath, M. M., Begelman, M.C., 2004, astro-ph/0401161
- [Ruszkowski & Begelman(2002)] Ruszkowski, M., & Begelman, M. C., 2002, ApJ, 581, 223
- [Schlegel et al.(1998)Schlegel, Finkbeiner & Davis] Schlegel, D.J., Finkbeiner, D.P., Davis, M., 1998, ApJ, 500, 525
- [] Smith, R. K., Brickhouse, N. S., Liedahl, D. A., Raymond, J. C., 2001, ApJ, 556, 91
- [Tamura et al.(2001)] Tamura, T., Kaastra, J.S., Peterson, J.R., et al., 2001, A&A, 365, L87
- [Tozzi & Norman(2001)] Tozzi, P., Norman, C., 2001, ApJ, 546, 63
- [Valgeas & Silk(1999)] Valageas, P., Silk, J., 1999, A&A, 350, 725
- [Véron-Cetty & Véron(2003)] Véron-Cetty, M.-P., Véron, P., 2003, A&A, 412, 399
- [Voit et al.(2002)] Voit, G.M., Bryan, G.L., Balogh, M.L., Bower, R.G., 2002, ApJ, 576, 601
- [White et al.(1997)White, Jones & Forman] White, D.A., Jones, C., Forman, W., 1997, MNRAS 292, 419
- [Worral & Birkinshaw(2004)] Worrall, D. M., Birkinshaw, M., 2004, in “Physics of Active Galactic Nuclei at all Scales”. eds. D. Alloin, R. Johnson, P. Lira, in press
- [Wu et al.(2000)Wu, Fabian & Nulsen] Wu K.K., Fabian, A.C., Nulsen, P.E.J., 2000, MNRAS, 318, 889