2004 \jvol43 \ARinfo1056-8700/97/0610-00
Deep Extragalactic X-ray Surveys
Abstract
Deep surveys of the cosmic X-ray background are reviewed in the context of observational progress enabled by the Chandra X-ray Observatory and the X-ray Multi-Mirror Mission-Newton. The sources found by deep surveys are described along with their redshift and luminosity distributions, and the effectiveness of such surveys at selecting active galactic nuclei (AGN) is assessed. Some key results from deep surveys are highlighted including (1) measurements of AGN evolution and the growth of supermassive black holes, (2) constraints on the demography and physics of high-redshift AGN, (3) the X-ray AGN content of infrared and submillimeter galaxies, and (4) X-ray emission from distant starburst and normal galaxies. We also describe some outstanding problems and future prospects for deep extragalactic X-ray surveys.
keywords:
Active galaxies – Extragalactic surveys – Galaxies – Observational cosmology – Starburst galaxies – X-ray astronomy1 Introduction to Deep Extragalactic X-ray Surveys
Deep extragalactic surveys have been successful tools in unraveling the formation and evolution of cosmic building blocks, including galaxies, groups and clusters of galaxies, large-scale structures, and supermassive black holes (SMBH). Deep surveys act as particularly effective “time machines” because fainter objects of a given type generally lie at greater distances and therefore earlier epochs. Furthermore, deep surveys are often able to probe intrinsically less luminous and more typical objects than wide-field, shallower surveys. Finally, the fluxes of all detected objects, both faint and bright, can be summed and compared with the extragalactic background light, which provides an integral census of the emission in the corresponding wavelength range. The numerous multiwavelength deep surveys centered around the Hubble Deep Fields (e.g., Ferguson, Dickinson & Williams 2000), for example, have demonstrated these characteristics impressively.
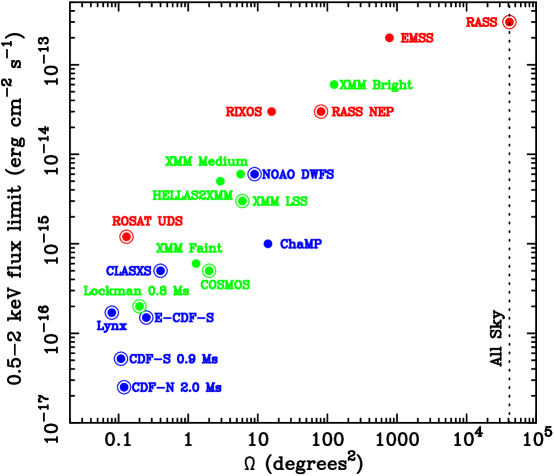
This review concentrates on deep extragalactic X-ray surveys in the 0.1–10 keV band accessible to imaging telescopes. Two powerful, currently active X-ray missions, NASA’s Chandra X-ray Observatory (Chandra; Weisskopf et al. 2000) and ESA’s X-ray Multi-Mirror Mission-Newton (XMM-Newton; Jansen et al. 2001), have executed a number of deep extragalactic X-ray observing programs, which comprise by far the most sensitive X-ray surveys ever performed. Building on previous pioneering work with the Einstein, ROSAT, ASCA, and BeppoSAX missions, these surveys resolve the majority of the 0.1–10 keV background. A substantial amount of multiwavelength follow-up work on the detected X-ray sources has also been completed. It is therefore timely to review the status and scientific results of deep extragalactic X-ray surveys. In this review, we focus on surveys reaching flux limits of at least erg cm-2 s-1 (0.5–2 keV) or erg cm-2 s-1 (2–10 keV), corresponding to Chandra or XMM-Newton exposures of ks (see Figure 1 and Table 1). The equally important wider-field, shallower X-ray surveys are not covered extensively here, although they are mentioned when they especially complement deep surveys; for example, when we are discussing the evolution of active galactic nuclei (AGN) and the growth of the SMBH that primarily power them. Some other in-depth reviews of deep extragalactic X-ray surveys and the cosmic X-ray background (CXRB) are Fabian & Barcons (1992), Hasinger & Zamorani (2000), Gilli (2004), and Brandt et al. (2005). Rosati, Borgani & Norman (2002a) have recently reviewed X-ray galaxy cluster surveys including some of the key results from deep Chandra and XMM-Newton surveys; we shall not repeat this material in detail here.
In the remainder of this section, we briefly review the history of X-ray deep-field research and describe the deepest Chandra and XMM-Newton surveys. We also discuss the observed X-ray number counts and the fraction of the 0.1–10 keV background resolved. In Section 2 we focus on the basic source types found, the observed AGN redshift and luminosity distributions, and the completeness of AGN X-ray selection. Section 3 reviews some key recent results from extragalactic X-ray surveys in targeted areas of scientific interest, and Section 4 briefly examines some outstanding problems and future prospects.
Throughout this review we shall adopt the WMAP concordance cosmology with km s-1 Mpc-1, , and (Spergel et al. 2003), unless otherwise noted.
1.1 Brief Historical Summary of X-ray Deep-Field Research
The CXRB was discovered by Giacconi et al. (1962) in a rocket flight originally designed to detect X-ray emission from the Moon; the CXRB was the first cosmic background discovered. The data showed a strong Galactic X-ray source (Sco X-1) and diffuse emission of approximately constant intensity from all directions observed during the flight. The first all-sky X-ray surveys with Uhuru and Ariel V in the 1970’s revealed a high degree of CXRB isotropy leading researchers to conclude that the CXRB must be mainly extragalactic. If it were comprised of discrete sources, such as AGN (e.g., Setti & Woltjer 1973), the number of sources contributing to the CXRB had to be very large: sr-1 (Schwartz 1980). On the other hand, high-quality data from HEAO-1 showed that the shape of the 3–50 keV CXRB could be well fit by an isothermal bremsstrahlung model corresponding to an optically thin, hot plasma with keV (Marshall et al. 1980). This was taken by some to suggest an origin of the CXRB in a hot intergalactic medium, until this possibility was ruled out by Compton-distortion constraints on the spectrum of the cosmic microwave background (see Section 5.1 of Fabian & Barcons 1992 and references therein).
When sensitive, high angular resolution imaging X-ray observations with Wolter telescopes became possible, the discrete nature of the CXRB became increasingly clear. Pointed observations of previously known AGN soon showed that, as a class, they are luminous X-ray emitters (e.g., Tananbaum et al. 1979). Deep Einstein observations resolved % of the 1–3 keV CXRB into discrete sources at fluxes down to erg cm-2 s-1, a large fraction of which were identified as AGN (Giacconi et al. 1979). Deep 0.5–2 keV surveys with ROSAT to limiting fluxes of erg cm-2 s-1 were for the first time able to resolve the majority (%) of the soft CXRB into discrete sources (e.g., Hasinger et al. 1993, 1998). Extensive optical follow-up spectroscopy identified the bulk of these sources as AGN (e.g., McHardy et al. 1998; Schmidt et al. 1998; Zamorani et al. 1999; Lehmann et al. 2001), demonstrating that at least the 0.5–2 keV CXRB is predominantly due to accretion onto SMBH, integrated over cosmic time. The deep ROSAT surveys detected an AGN sky density (–870 deg-2) larger than at any other wavelength and found evidence for luminosity-dependent density evolution of AGN (Miyaji, Hasinger & Schmidt 2000), contrary to the pure luminosity evolution that had been proposed for both optically and X-ray selected AGN (e.g., Boyle et al. 1993).
Deep surveys above 2–3 keV had to wait considerably longer than those at lower energies owing to technological challenges. ASCA performed a number of medium-to-deep sky surveys to limiting 2–10 keV fluxes of – erg cm-2 s-1 (e.g., Georgantopoulos et al. 1997; Ueda et al. 1998; Cagnoni, della Ceca & Maccacaro 1998; Ishisaki et al. 2001). These surveys reached AGN sky densities of 10–100 sources deg-2. At higher densities these surveys were heavily confused due to the limited angular resolution of ASCA. An analysis of the spatial fluctuations in deep ASCA images probed the 2–10 keV source counts down to a flux limit of erg cm-2 s-1, resolving % of the 2–10 keV CXRB (Gendreau, Barcons & Fabian 1998). Surveys in the 5–10 keV band were pioneered using BeppoSAX, which was well suited for such work because of its relatively large throughput at high energies and its significantly sharper point spread function at high energy compared with ASCA. These observations resolved 20–30% of the 5–10 keV CXRB (e.g., Comastri et al. 2001).
The above X-ray observations were interpreted in the context of CXRB population synthesis models based on unified AGN schemes (e.g., Madau, Ghisellini & Fabian 1994; Comastri et al. 1995; Gilli, Salvati & Hasinger 2001). These explain the CXRB spectrum using a mixture of obscured and unobscured AGN, folded with the corresponding luminosity function and its cosmological evolution. According to these models, most AGN spectra are heavily absorbed, and about 85% of the radiation produced by SMBH accretion is obscured by dust and gas (e.g., Fabian & Iwasawa 1999). These models predicted a significant number of heavily obscured AGN in deep hard X-ray fields, which had already been partly found in the ASCA and BeppoSAX surveys. They also predicted a substantial contribution from high-luminosity, obscured X-ray sources (e.g., type 2 quasars), which at that time had only scarcely been detected. However, these models were far from unique and contained a number of implicit assumptions. For instance, evolution of obscuration over cosmic time and the dependence of obscuration on intrinsic source luminosity were largely free parameters. Nevertheless, these models provided a working framework and predictions for deeper surveys, which could be tested with Chandra and XMM-Newton.
1.2 Current Deep Surveys with Chandra and XMM-Newton
The superb Wolter telescopes and charge-coupled device (CCD) detectors on Chandra and XMM-Newton provide deep-survey researchers with the following:
-
1.
Sensitive imaging spectroscopy from –10 keV, with up to 50–250 times (depending upon the energy band considered) the sensitivity of previous X-ray missions.
-
2.
X-ray source positions with accuracies of 0.3–1′′ (Chandra) and 1–3′′ (XMM-Newton). These high-quality positions are essential for matching to faint multiwavelength counterparts in deep surveys, thereby allowing efficient follow-up studies.
-
3.
Large source samples (100–600 sources or more, per survey) allowing reliable statistical inferences to be drawn about faint extragalactic X-ray source populations.
The deep-survey capabilities of Chandra and XMM-Newton are complementary in several important respects. Due to its sub-arcsecond imaging which provides a small source detection cell, Chandra can achieve the highest possible 0.5–8 keV sensitivity with long exposures. The Chandra 0.5–8 keV background count rate is only count Ms-1 pixel-1, and the faintest Chandra sources detected have count rates of count every 2–4 days. Even the deepest Chandra observations performed to date do not suffer from significant source confusion (Alexander et al. 2003b), in contrast to the case for XMM-Newton, where confusion becomes significant for –200 ks exposures. XMM-Newton has a substantially larger photon collecting area than Chandra, allowing efficient X-ray spectroscopy at fluxes above its confusion limit. The field of view for XMM-Newton is also times that of Chandra.
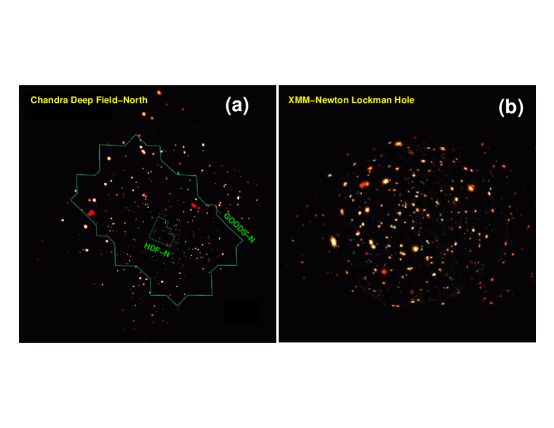
Table 1 lists the current deep Chandra and XMM-Newton surveys; these 21 surveys have a total exposure exceeding 80 days. The most sensitive surveys performed by Chandra and XMM-Newton, the 2.0 Ms Chandra Deep Field-North (CDF-N) and the 770 ks XMM-Newton Lockman Hole field, are shown in Figure 2. The surveys in Table 1 have generally been performed in regions of sky where (1) the extensive requisite multiwavelength supporting data already exist and/or some interesting astronomical object is present (e.g., Abell 370, 3C 295, or the SSA22 “protocluster”), and (2) there is little Galactic foreground X-ray absorption (e.g., Lockman 2004). At the flux levels probed by these surveys, even moderate-luminosity AGN, similar to Seyfert 1 galaxies in the local universe, can be detected to . The surveys in Table 1 span a significant range of solid-angle coverage; however, they are all “pencil-beam” surveys in that even the widest cover only of the sky (about nine times the solid angle of the full Moon).
1.3 Deep-Survey Number Counts and the Fraction of the Cosmic X-ray Background Resolved
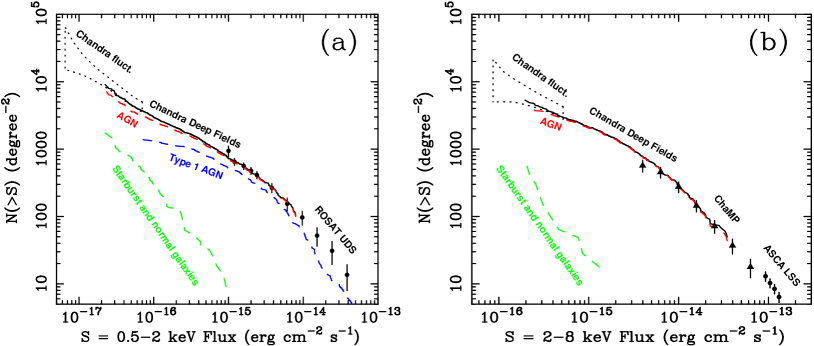
Based on deep surveys with Chandra and XMM-Newton, number-count relations have now been determined down to 0.5–2, 2–8, and 5–10 keV fluxes of about , , and erg cm-2 s-1, respectively (e.g., Brandt et al. 2001b; Hasinger et al. 2001; Cowie et al. 2002; Rosati et al. 2002b; Moretti et al. 2003; Bauer et al. 2004). Figure 3 shows the integral number counts in the 0.5–2 and 2–8 keV bands. At bright fluxes the integral counts have power-law slopes in the range , depending on the sample selection (compare, e.g., the discussions about bright-end slopes in Hasinger et al. 1998 and Moretti et al. 2003). Toward fainter 0.5–2 and 2–8 keV fluxes, the integral counts show significant cosmological flattening with faint-end slopes of –0.6 and break fluxes of – and – erg cm-2 s-1, respectively. In the 5–10 keV band a flattening has not yet been detected; the faint-end number counts continue rising steeply (–1.4) indicating that a significant fraction of the 5–10 keV CXRB remains unresolved (e.g., Rosati et al. 2002b).
There is some evidence for field-to-field variations of the number counts. Such variations are expected at some level due to “cosmic variance” associated with large-scale structures that have been detected in the X-ray sky (e.g., Barger et al. 2003a; Gilli et al. 2003, 2005; Yang et al. 2003). For example, though the CDF-N and Chandra Deep Field-South (CDF-S) number counts agree in the 0.5–2 keV band and at bright 2–8 keV fluxes, there is up to disagreement for 2–8 keV fluxes below erg cm-2 s-1 (Cowie et al. 2002; Rosati et al. 2002b; Bauer et al. 2004). The number counts for the shallower Lockman Hole (Hasinger et al. 2001) and Lynx (Stern et al. 2002a) fields agree with those for the Chandra Deep Fields to within statistical errors, whereas those for the SSA13 (Mushotzky et al. 2000) field appear to be % higher in the 2–8 keV band (see Tozzi et al. 2001). An extensive comparison of field-to-field number counts by Kim et al. (2004) finds little evidence for cosmic variance at 0.5–2 keV (2–8 keV) flux levels of – erg cm-2 s-1 (– erg cm-2 s-1) in –125 ks Chandra observations.
The deepest ROSAT surveys resolved % of the 0.5–2 keV CXRB into discrete sources, the major uncertainty in the resolved fraction being the absolute flux level of the CXRB (at low energies it is challenging to separate the CXRB from Galactic emission; see McCammon & Sanders 1990). Deep Chandra and XMM-Newton surveys have now increased this resolved fraction to % (e.g., Moretti et al. 2003; Bauer et al. 2004; Worsley et al. 2004). Above 2 keV the situation is complicated by the fact that the HEAO-1 background spectrum (Marshall et al. 1980), used as a reference for many years, has a lower normalization than several earlier and later background measurements (see, e.g., Moretti et al. 2003). Recent determinations of the background spectrum with RXTE (Revnivtsev et al. 2003) and XMM-Newton (De Luca & Molendi 2004) strengthen the consensus for a 30% higher normalization, indicating that many past resolved fractions above 2 keV must be scaled down correspondingly. Additionally, X-ray telescopes typically have a large sensitivity gradient across the broad 2–10 keV band. A recent investigation by Worsley et al. (2004), dividing the CDF-N, CDF-S, and XMM-Newton Lockman Hole field into finer energy bins, concludes that the resolved fraction drops from –90% at 2–6 keV to –70% at 6–10 keV. This is consistent with expectations from the 5–10 keV number counts (see above). In the critical 10–100 keV band, where most of the CXRB energy density resides, only a few percent of the background has been resolved (e.g., Krivonos et al. 2005).
Multiwavelength identification studies indicate that most (%) of the X-ray sources found in deep Chandra and XMM-Newton surveys are AGN (see Section 2.1 for further discussion). The observed AGN sky density in the deepest X-ray surveys, the Chandra Deep Fields, is a remarkable deg-2 (e.g., Bauer et al. 2004). This exceptional effectiveness at finding AGN arises largely because X-ray selection (1) has reduced absorption bias, (2) has minimal dilution by host-galaxy starlight, and (3) allows concentration of intensive optical spectroscopic follow-up upon high-probability AGN with faint optical counterparts (i.e., it is possible to probe further down the luminosity function); see Section 2.4 and Mushotzky (2004) for further details on the effectiveness of AGN X-ray selection. The AGN sky density from the Chandra Deep Fields exceeds that found at any other wavelength and is 10–20 times higher than that found in the deepest optical spectroscopic surveys (e.g., Wolf et al. 2003; Hunt et al. 2004); only ultradeep optical variability studies (e.g., Sarajedini, Gilliland & Kasm 2003) may be generating comparable AGN sky densities.
2 Properties of the Sources Found and Missed by Deep Extragalactic X-ray Surveys
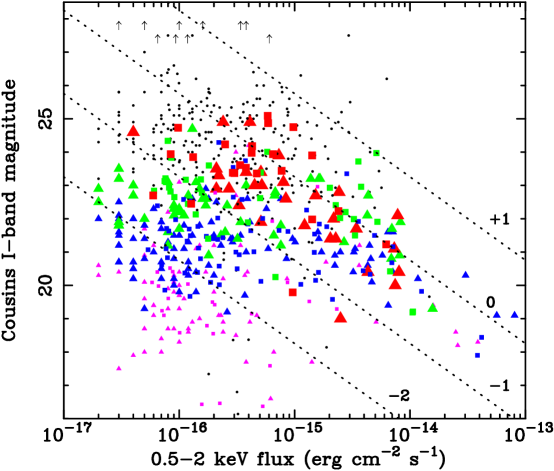
A broad diversity of source types is found in deep Chandra and XMM-Newton surveys. This is apparent in even basic flux-flux plots such as that shown in Figure 4; at the faintest X-ray flux levels in the Chandra Deep Fields, the extragalactic sources range in optical flux by a factor of .
2.1 Source Classification Challenges
Classification of deep X-ray survey sources is challenging for several reasons. First, many of the X-ray detected AGN are simply too faint for straightforward optical spectroscopic identification even with 8–10 m class telescopes (note the multitude of small dots in Figure 4). Intensive optical identification programs on deep Chandra and XMM-Newton fields typically have 50–70% redshift completeness at best (e.g., Barger et al. 2003a; Szokoly et al. 2004), and some of the obtained spectra that do yield redshifts are of insufficient signal-to-noise for reliable optical classification work. Furthermore, many of the X-ray sources have modest optical luminosities, often due to obscuration. Thus starlight from their host galaxies can make a substantial diluting contribution to the flux measured in a ground-based spectroscopic aperture, plausibly “overwhelming” subtle nuclear spectral features from an obscured or low-luminosity AGN (e.g., Moran, Filippenko, & Chornock 2002). Finally, another challenge is an apparent “schism” between optical (type 1 vs. type 2) and X-ray (unobscured vs. obscured) schemes of classification; not all X-ray obscured AGN have type 2 optical spectra, and not all AGN with type 1 optical spectra are X-ray unobscured (e.g., Matt 2002).
2.2 Basic Source Types
Most of the X-ray sources found in deep surveys are AGN. Considering X-ray, optical, and multiwavelength information, the types of AGN found include the following:
-
1.
Unobscured AGN. Blue, broad-line AGN are found that do not show signs of obscuration at either X-ray or optical/UV wavelengths. They cover a broad range of redshift (–5), and they comprise a significant fraction of the brightest X-ray sources (e.g., Barger et al. 2003a; Szokoly et al. 2004). At they also comprise a substantial fraction of all X-ray sources with spectroscopic identifications, certainly in part because these objects are the most straightforward to identify spectroscopically.
-
2.
Obscured AGN with clear optical/UV AGN signatures. Some objects showing X-ray evidence for obscuration have clear AGN signatures in their rest-frame optical/UV spectra. Notably, such AGN can have both type 1 and type 2 optical/UV classifications (e.g., Matt 2002). Most of these objects have .
-
3.
Optically faint X-ray sources. These sources have –25 and usually cannot be identified spectroscopically (see Figure 4). Many, however, appear to be luminous, obscured AGN at –4 when their X-ray properties, optical photometric properties (including photometric redshifts), and multiwavelength properties are considered (e.g., Alexander et al. 2001; Barger et al. 2003a; Fiore et al. 2003; Treister et al. 2004; Zheng et al. 2004; Mainieri et al. 2005). Thus, many of these objects likely represent an extension of the previous class to higher redshifts and fainter optical magnitudes. Some have no optical detections at all, even in deep images, and are termed extreme X-ray/optical ratio sources (EXOs); most of these are detected in near-infrared images (Koekemoer et al. 2004; Mignoli et al. 2004). EXOs usually can be plausibly explained as –5 obscured AGN in dusty or evolved hosts, although a minority may lie at where the intergalactic medium absorbs essentially all of the observed-frame optical emission.
-
4.
X-ray bright, optically normal galaxies (XBONGs). XBONGs are early-type galaxies at –1 that have X-ray luminosities (– erg s-1), X-ray spectral shapes, and X-ray-to-optical flux ratios suggesting AGN activity of moderate strength (e.g., Comastri et al. 2005). However, AGN emission lines and non-stellar continua are not apparent in optical spectra. Some XBONGs have X-ray spectra suggesting the presence of obscuration whereas others do not (e.g., Severgnini et al. 2003). The nature of XBONGs remains somewhat mysterious. Many and perhaps most may just be normal Seyfert galaxies where dilution by host-galaxy light hinders optical detection of the AGN (e.g., Moran et al. 2002; Severgnini et al. 2003), but some have high-quality follow-up observations and appear to be truly remarkable objects (e.g., Comastri et al. 2002). These “true” XBONGs may be (1) AGN with inner radiatively inefficient accretion flows (Yuan & Narayan 2004), (2) AGN that suffer from heavy obscuration covering a large solid angle ( sr), so that optical emission-line and ionizing photons cannot escape the nuclear region (e.g., Matt 2002), or, in some cases, (3) BL Lac-like objects (e.g., Brusa et al. 2003). XBONGs appear related to “optically dull galaxies” (e.g., Elvis et al. 1981) and “elusive AGN” (e.g., Maiolino et al. 2003) studied in the local universe.
Morphological studies show that the AGN from deep X-ray surveys are generally hosted by galaxies with significant bulge components, and they do not show evidence for enhanced merging or interaction activity relative to normal field galaxies (e.g., Grogin et al. 2005). Many of the non broad-line AGN have the rest-frame colors of evolved, bulge-dominated galaxies, and there is little evolution of these colors from –2 (e.g., Barger et al. 2003a; Szokoly et al. 2004). Most AGN from deep surveys are “radio quiet” in the sense that the ratio, , of their rest-frame 5 GHz and 4400 Å flux densities is (e.g., Bauer et al. 2002b).
In addition to AGN, several other types of objects are found in deep extragalactic X-ray surveys. These include the following:
-
1.
Starburst and normal galaxies. At the faintest measured X-ray flux levels (0.5–2 keV fluxes below erg cm-2 s-1; see Figure 3), a significant and rising (up to 30–40%) fraction of the detected sources appears to be starburst and normal galaxies at –1.5 (e.g., Hornschemeier et al. 2003; Bauer et al. 2004). These galaxies are discussed in more detail in Section 3.4.
-
2.
Groups and clusters of galaxies. Groups and low-luminosity clusters of galaxies at –1 are detected as extended, soft X-ray sources in deep surveys (e.g., Bauer et al. 2002a; Giacconi et al. 2002; Rosati et al. 2002a). Their X-ray luminosities (– erg s-1), basic X-ray spectral properties ( keV), and sizes appear broadly consistent with those of nearby groups and low-luminosity clusters. The surface density of extended X-ray sources is –260 deg-2 at a limiting 0.5–2 keV flux of erg cm-2 s-1; no strong evolution in the X-ray luminosity function of clusters is needed to explain this value.
-
3.
Galactic stars. Some stars are detected in the high Galactic latitude fields targeted by deep surveys. These are typically of type G, K, and M, and their X-ray emission is attributed to magnetic reconnection flares. The observed X-ray emission constrains the decay of late-type stellar magnetic activity on timescales of –11 Gyr (e.g., Feigelson et al. 2004). One of the stars detected in the Lynx field has notably hard X-ray emission, and Stern et al. (2002a) propose this is a binary system where accretion powers the X-ray emission.
Figure 5 shows the source classifications in the Hubble Deep Field-North (HDF-N) and the Hubble Ultradeep Field (UDF). These lie near the centers of the CDF-N (see Figure 2a) and CDF-S, respectively, and thus have the most sensitive X-ray coverage available. Despite the many intensive studies of the HDF-N prior to the acquisition of the Chandra data, several new AGN were identified in the HDF-N based upon their observed X-ray emission (e.g., the three XBONGs; see Brandt et al. 2001a).
Contributions to the total X-ray number counts from a few of the source classes mentioned above are shown in Figure 3. Bauer et al. (2004) provide detailed decompositions of the number counts by source class, luminosity range, and estimated amount of X-ray absorption.
2.3 AGN Redshift and Luminosity Distributions
Most spectroscopically identified AGN in deep X-ray surveys have –2, although a significant minority have –5. This is partly due to spectroscopic incompleteness bias for faint AGN at , as is apparent by noting the systematic progression of symbol colors and sizes in Figures 4 and 6. The observed redshift distribution is concentrated at significantly lower redshifts than those predicted by pre-Chandra population-synthesis models of the CXRB (see Section 1.1). Application of photometric and other redshift estimation techniques to optically faint X-ray sources partially mitigates this discrepancy, as many of these sources are estimated to lie at –4 (see Section 2.2). However, as described further in Section 3.1, there remains a low-redshift enhancement of AGN relative to expectations from pre-Chandra population-synthesis models. About 60% of the 2–8 keV CXRB arises at .
The observed redshift distributions from deep X-ray surveys also show significant “spikes” in narrow redshift ranges from –2.5 (e.g., Barger et al. 2003a; Gilli et al. 2003, 2005); spikes at corresponding redshifts are also seen for sources selected at other wavelengths. These are associated with X-ray source clustering in large-scale sheet-like structures with sizes of –10 Mpc. These structures are likely a cause of the apparent cosmic variance mentioned in Section 1.3, and further studies of AGN clustering in deep X-ray surveys should determine if AGN fueling depends significantly upon large-scale environment.
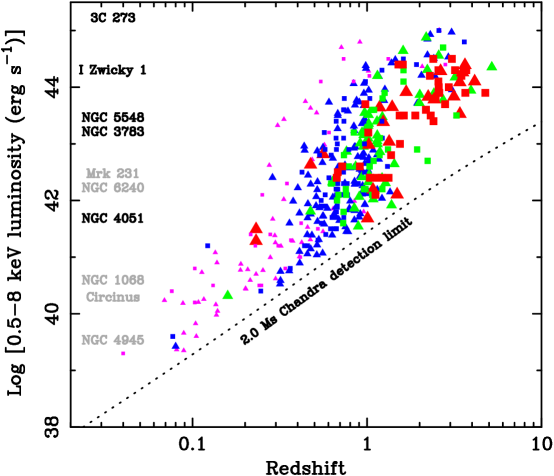
The sources creating most of the 0.1–10 keV CXRB have X-ray luminosities of to a few times erg s-1 (see Figure 6), comparable to those of local Seyfert 1 galaxies (e.g., NGC 3783, NGC 4051, and NGC 5548) and lower luminosity quasars (e.g., I Zwicky 1). The fraction of AGN showing evidence for significant X-ray obscuration drops with increasing luminosity from % at erg s-1 to % at erg s-1 (e.g., Ueda et al. 2003; Szokoly et al. 2004). A number of X-ray obscured quasars have been found in deep surveys (e.g., Norman et al. 2002; Stern et al. 2002b; Barger et al. 2003a; Szokoly et al. 2004). These generally have X-ray luminosities of – erg s-1, just above those of powerful Seyfert galaxies. Some are optically faint or have limited rest-frame spectral coverage (e.g., low-order Balmer lines that can penetrate several magnitudes of extinction are not covered) so that a type 2 optical classification is difficult to prove rigorously. Obscured quasars create % of the 0.1–10 keV CXRB.
2.4 AGN Selection Completeness
Are there significant numbers of luminous AGN that are not found even in the deepest X-ray surveys? This could be the case if there is a population of AGN that is luminous at non-X-ray wavelengths but is X-ray weak, perhaps due to an intrinsic inability to produce X-rays. For example, such AGN could lack accretion-disk coronae, the structures putatively responsible for creating much of the emission above –1 keV. Such intrinsically X-ray weak AGN appear to be rare, in line with the dogma that X-ray emission is a universal property of AGN, although some may exist (e.g., Brandt, Laor & Wills 2000; Risaliti et al. 2003; Brandt, Schneider & Vignali 2004a; Leighly, Halpern & Jenkins 2004).
Alternatively, strong X-ray absorption could render a luminous AGN X-ray weak, even if it were intrinsically producing X-rays at a nominal level. Such absorption is seen in “Compton-thick” AGN, which comprise % or more of AGN in the local universe (e.g., Risaliti, Maiolino & Salvati 1999; Comastri 2004). Compton-thick AGN are absorbed by column densities of cm-2, so that the optical depth to electron scattering is (for comparison, the column density through a person’s chest is cm-2). Within such thick absorption, direct line-of-sight X-rays are effectively destroyed via the combination of Compton scattering and photoelectric absorption, even at high energies of 10–200 keV. Compton-thick AGN are thus only visible via indirect X-rays that are –150 times weaker (e.g., Comastri 2004); these reach an observer via a less-obscured path by “reflecting” off neutral material and “scattering” off diffuse ionized material.111In some “translucent” cases, where the column density is only a few times cm-2, direct “transmission” X-rays from a Compton-thick AGN may become visible above rest-frame energies of keV.
Some well-known, nearby Compton-thick AGN are shown in Figure 6 along the left-hand side of the plot. They are plotted at the level of their observable X-ray luminosities; their absorption-corrected luminosities would be –150 times higher. Note that NGC 1068, NGC 4945, and the Circinus Galaxy would become undetectable in the 2.0 Ms CDF-N if placed at –0.5, whereas NGC 6240 and Mrk 231 would become undetectable at . It thus appears likely that many Compton-thick AGN remain undetected in even the deepest X-ray surveys to date. Only a small number of Compton-thick AGN have been isolated among the currently detected X-ray sources in deep surveys. However, since Compton-thick AGN have a diversity of complex X-ray spectral shapes and are expected to be X-ray faint, additional ones could be residing among the currently detected sources with limited photon statistics. More refined searches for Compton-thick AGN among the detected X-ray sources are underway, utilizing characteristic X-ray signatures (e.g., strong iron K lines) and new multiwavelength data [e.g., Spitzer Space Telescope (Spitzer) measurements of re-radiated infrared “waste heat”].
If there is indeed a large population of luminous AGN that has eluded detection in the deepest X-ray surveys, this population also appears to have mostly eluded AGN searches at other wavelengths. There are only a few secure AGN in the Chandra Deep Fields, for example, that have not been detected in X-rays (see Section 4 of Bauer et al. 2004). These include an optically selected, narrow-line AGN at (Hunt et al. 2004), a radio-bright ( mJy at 1.4 GHz) wide-angle-tail source at –2 (e.g., Snellen & Best 2001), and perhaps a couple of AGN selected optically in the COMBO-17 survey (Wolf et al. 2003).222Although the wide-angle-tail radio source is not included in the CDF-N X-ray source catalogs of Alexander et al. (2003b), manual analysis of the Chandra data at the AGN position indicates a likely detection. Sarajedini, Gilliland & Kasm (2003) also reported some galaxies with optically variable nuclei in the HDF-N that have not been detected in X-rays. Although some of these may be nuclear supernovae or statistical outliers, some are plausibly low-luminosity AGN with X-ray fluxes that lie below the current X-ray sensitivity limit.
Another way to assess AGN selection completeness in deep X-ray surveys is to consider “book-keeping” arguments: can the observed sources explain the total CXRB intensity, and can all the observed accretion account for the local density of SMBH? The answer to the first question is “no” according to the 5–10 keV number counts and source-stacking analyses, as described in Section 1.3. Worsley et al. (2004) propose that the sky density of obscured, X-ray undetected AGN may be –3000 deg-2 or higher. The answer to the second question is plausibly “yes” but with some uncertainty; this is discussed further in Section 3.1.
3 Some Key Results from Deep Extragalactic X-ray Surveys
3.1 X-ray Measurements of AGN Evolution and the Growth of Supermassive Black Holes
Optical studies of AGN evolution have historically focused on luminous quasars (e.g., Hewett & Foltz 1994; Osmer 2004). These have been known to evolve positively with redshift since (Schmidt 1968), having a comoving space density at that is times higher than at . Pure luminosity evolution (PLE) models provide acceptable fits to large optically selected samples such as luminous AGN from a combination of the recent 2dF and 6dF surveys out to (Croom et al. 2004). At , the space density of luminous quasars selected in wide-field optical multicolor and emission-line surveys shows a strong decline with redshift (e.g., Schmidt, Schneider & Gunn 1995; Fan et al. 2001). Deep optical AGN surveys, such as COMBO-17, have recently discovered significant numbers of moderate-luminosity AGN (with ) at –4 (Wolf et al. 2003). Like luminous quasars, the moderate-luminosity AGN found in these surveys also appear to peak in comoving space density around . Although a careful merging of the COMBO-17 data with a large sample of higher luminosity AGN has yet to be published, there are hints that the comoving space density of moderate-luminosity AGN peaks at smaller redshift (L. Wisotzki, pers. comm.).
As described in Sections 1.3 and 2.3, deep X-ray surveys efficiently select AGN significantly less luminous than those found in optical surveys out to high redshift. Deep plus wide X-ray surveys can therefore cover an extremely broad range of luminosity. Contrary to the PLE model for optically selected luminous quasars, the moderate-luminosity AGN selected in the 0.5–2 keV and 2–10 keV bands require luminosity-dependent density evolution (LDDE; e.g., Miyaji, Hasinger & Schmidt 2000; Cowie et al. 2003; Fiore et al. 2003; Steffen et al. 2003; Ueda et al. 2003; Barger et al. 2005; Hasinger 2005; Hasinger, Miyaji & Schmidt 2005). Figure 7 shows the X-ray luminosity function based on AGN selected in the 0.5–2 keV band from deep Chandra and XMM-Newton surveys as well as deep plus wide ROSAT surveys (Hasinger, Miyaji & Schmidt 2005). Strong positive evolution from –2 is only seen at high luminosities; lower luminosity AGN evolve more mildly. The evolutionary behavior measured in the 2–10 keV band is similar. These results are robust to incompleteness of the spectroscopic follow up, although clearly they are still dependent upon the completeness of AGN X-ray selection (see Section 2.4). At a basic level, LDDE is not unexpected as simple PLE and pure density evolution (PDE) models have physical difficulties (see, e.g., Weedman 1986 and Peterson 1997). Simple PLE models tend to overpredict the number of M⊙ black holes in the local universe, whereas simple PDE models tend to overpredict the local space density of quasars and the CXRB intensity.
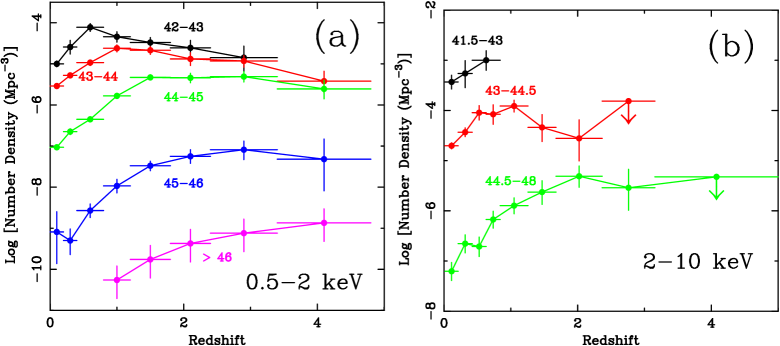
Figure 8 shows estimates of the comoving space density of AGN in different X-ray luminosity ranges as a function of redshift. Figure 8a has been constructed for the 0.5–2 keV band using the Hasinger, Miyaji & Schmidt (2005) sample. Figure 8b is for the 2–10 keV band, utilizing a combination of Chandra, ASCA, and HEAO-1 surveys with 247 AGN in total (Ueda et al. 2003). These plots illustrate that (1) the AGN peak space density moves to smaller redshift with decreasing luminosity, and (2) the rate of evolution from the local universe to the peak redshift is slower for less-luminous AGN. It appears that SMBH generally grow in an “anti-hierarchical” fashion: while the – SMBH in rare, luminous AGN could grow efficiently at –3, the – SMBH in more-common, less-luminous AGN had to wait longer to grow (). In the 0.5–2 keV band the sensitivity and statistics are good enough to detect a clear decline of the luminous AGN space density toward higher redshifts (also see Silverman et al. 2005); such a high-redshift decline is also hinted at in some 2–10 keV band analyses (Fiore et al. 2003; Steffen et al. 2003).
The AGN luminosity function can be used to predict the masses of remnant SMBH in galactic centers. This is done using the ingenious Sołtan (1982) continuity argument, adopting an AGN mass-to-energy conversion efficiency and bolometric correction factor. The local mass density of SMBH in dormant quasar remnants originally predicted by Sołtan (1982) was Mpc-3, where is the mass-to-energy conversion efficiency of the accretion process divided by 0.1. For a Schwarzschild black hole, is expected to be 0.054 or larger, depending upon the accretion-disk torque at the marginally stable orbit around the black hole (e.g., Agol & Krolik 2000). For a rapidly rotating Kerr black hole, can be as high as . More recent determinations of from optical quasar luminosity functions are around Mpc-3 (e.g., Chokshi & Turner 1992; Yu & Tremaine 2002). Estimates from the CXRB spectrum, including obscured accretion power, originally obtained even larger values: 6–9 (Fabian & Iwasawa 1999) or 8–17 (Elvis, Risaliti & Zamorani 2002) in the above units. However, these were derived assuming that the evolution of moderate-luminosity AGN is the same as that of quasars (i.e., that moderate-luminosity peak in number density at ), and they need to be revised downward by a factor of in light of the currently observed evolution of CXRB sources (Fabian 2004). Values derived from the infrared band (Haehnelt & Kauffmann 2001) or multiwavelength observations (Barger et al. 2001b) are high (8–9 in the above units). Arguably the most reliable determination comes from an integration of the Ueda et al. (2003) hard X-ray luminosity function that includes a revised bolometric correction (which ignores infrared emission to avoid the double counting of luminosity) and a plausible correction for missed Compton-thick AGN: Mpc-3 (Marconi et al. 2004).
The SMBH masses measured in local galaxies are correlated with the velocity dispersions and luminosities of their host bulges (e.g., Kormendy & Gebhardt 2001; Ferrarese & Ford 2005; and references therein). Using these correlations with velocity dispersion functions or luminosity functions for local galaxies, the total SMBH density in galactic bulges can be estimated. Scaled to the same assumption for the Hubble constant (see Section 1), several recent papers arrive at different values of , mainly depending on assumptions about the SMBH-galaxy correlations. For example, Yu & Tremaine (2002) derive Mpc-3, whereas Marconi et al. (2004) derive Mpc-3. These values are plausibly consistent with the current best estimates of accreted mass density for . Marconi et al. (2004) and Shankar et al. (2004) also demonstrate that the observed accretion can plausibly explain the measured distribution function of local SMBH masses.
3.2 X-ray Constraints on the Demography and Physics of High-Redshift AGN
Deep X-ray surveys can find AGN that are –30 times less luminous than the quasars found in wide-field optical surveys (see Figure 6). Such moderate-luminosity AGN are much more numerous and thus more representative of the AGN population than the rare, highly luminous quasars. Furthermore, unlike the rest-frame ultraviolet light sampled in ground-based surveys of AGN, X-ray surveys suffer from progressively less absorption bias as higher redshifts are surveyed. At , hard –50 keV rest-frame X-rays are observed.
Optical spectroscopic follow-up of moderate-luminosity X-ray detected AGN at is challenging, as such objects are expected to have -band magnitudes of –27 (provided they are not at , where they largely disappear from the bandpass because of intergalactic absorption). Nevertheless, significant constraints on the sky density of such objects have been set via large-telescope spectroscopy and Lyman-break selection (e.g., Alexander et al. 2001; Barger et al. 2003b; Cristiani et al. 2004; Koekemoer et al. 2004; Wang et al. 2004c). The “bottom line” from these demographic studies is that the sky density of AGN is –150 deg-2 at a 0.5–2 keV flux limit of erg cm-2 s-1; for comparison, the Sloan Digital Sky Survey finds a sky density of –5.4 quasars of deg-2 at an -magnitude limit of (e.g., Schneider et al. 2003). Combined demographic constraints from X-ray and wide-field optical surveys indicate that the AGN contribution to reionization at is small. Significantly better source statistics are needed to refine constraints on the faint end of the AGN X-ray luminosity function at , as only six moderate-luminosity, X-ray selected AGN at are presently published. The requisite improvements are expected as follow-up studies of the surveys in Table 1 progress. The current X-ray constraints at are plausibly consistent with the optical luminosity function from COMBO-17 (Wolf et al. 2003).
Once AGN have been identified, broad-band spectral energy distribution analyses and X-ray spectral fitting provide information on their accretion processes and environments. The currently available data suggest that AGN spanning a broad luminosity range are accreting in basically the same mode as AGN in the local universe (e.g., Vignali et al. 2002, 2003; Brandt et al. 2004b). The X-ray power-law photon indices of and low-redshift AGN appear consistent, and their X-ray-to-optical flux ratios also agree after allowing for luminosity effects. The basic consistency observed provides confidence that X-ray surveys should remain an effective way to find AGN at the highest redshifts.
To constrain even lower luminosity AGN populations at , source-stacking analyses have been employed. These search for an average X-ray signal from a set of high-redshift sources whose individual members lie below the single-source X-ray detection limit. The most sensitive source-stacking analyses to date have employed samples of –1700 Lyman break galaxies (e.g., Lehmer et al. 2005; , , and dropouts) and Ly emitters (e.g., Wang et al. 2004b). The resulting average X-ray detections and upper limits are consistent with any X-ray emission from these objects arising from stellar processes; thus no AGN emission has clearly been detected. These average constraints at luminosities below those that can be probed by single-source analyses further limit the contribution that AGN could have made to reionization at and point to stars as the culprit. A complementary average constraint, derived by considering the unresolved component of the 0.5–2 keV CXRB, provides additional evidence that AGN and lower mass black holes did not dominate reionization (Dijkstra, Haiman & Loeb 2004).
3.3 X-ray Constraints on AGN in Infrared and Submillimeter Galaxies
Deep X-ray surveys arguably allow the best assessment of the AGN content of distant infrared and submillimeter galaxies in which much of cosmic star formation took place. AGN are expected to be significant emitters at these observed wavelengths, owing to the reprocessing of their strong shorter wavelength emission by omnipresent dust and gas in their nuclei (e.g., Almaini, Lawrence & Boyle 1999). Overall, however, the current evidence points to a picture where AGN emission is dominated by that from star-formation processes.
In the infrared band, only a minority of 15 m galaxies are identified with X-ray detected AGN; the majority of 15 m/X-ray matches appear to be starburst galaxies (e.g., Alexander et al. 2002; Fadda et al. 2002). AGN nuclear emission contributes –5% or less of the total background in most infrared bands, the rest coming from starburst and normal galaxies (e.g., Silva, Maiolino & Granato 2004). The fractional AGN contribution could be significantly underestimated if there is a large population of infrared-emitting AGN missed by deep X-ray surveys (see Section 2.4). For example, the elusive Compton-thick AGN may dominate the AGN contribution to the infrared background, although inclusion of these probably still leaves AGN as minority contributors to the infrared background. Spitzer should be able to detect the putative Compton-thick AGN missed by deep X-ray surveys (e.g., Rigby et al. 2004; Treister et al. 2004). However, unambiguously separating these from the numerous starburst galaxies detected may prove formidable, especially because many galaxies hosting Compton-thick AGN are also likely to host significant starburst activity.
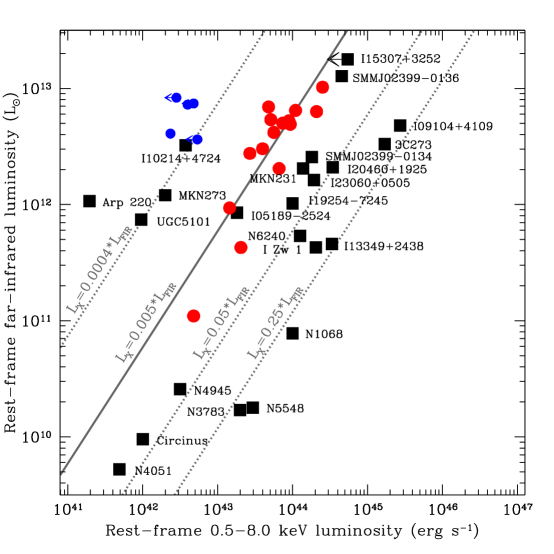
Surveys at submillimeter wavelengths have uncovered a large population of luminous, dust-obscured starburst galaxies at –3 with star-formation rates (SFRs) of the order of M⊙ yr-1 (e.g., Blain et al. 2002; Chapman et al. 2003; and references therein). Optical spectral classification studies of most of these galaxies are difficult due to optical faintness, and thus deep X-ray surveys play a critical role in determining their AGN content. Early comparisons between submillimeter surveys and –150 ks Chandra surveys yielded little (%) source overlap, but in the exceptionally sensitive CDF-N about 85% of submillimeter galaxies (850 m flux densities of 4–12 mJy) with reliable positions are now detected by Chandra (e.g., Barger et al. 2001c; Alexander et al. 2003a, 2005; Borys et al. 2004; and references therein). The majority of these X-ray detected submillimeter galaxies appear to contain moderate-luminosity AGN that are usually obscured (see Figure 9), based upon their X-ray spectral shapes and other properties. Although sample definition and selection effects are complex, the data suggest an AGN fraction in the submillimeter galaxy population of at least 40% (Alexander et al. 2005). Thus the SMBH in submillimeter galaxies are almost continuously growing during the observed phase of intense star formation. Even after correcting for the significant amount of X-ray absorption present, however, AGN are unlikely to contribute more than –20% of the bolometric luminosity of typical submillimeter galaxies.
3.4 X-ray Emission from Distant Starburst and Normal Galaxies
Although the majority of the 0.5–10 keV CXRB has now been resolved, most of the extragalactic X-ray sources throughout the Universe have yet to be detected. These are distant starburst and normal galaxies, where most of the X-ray emission arises from X-ray binaries, ultraluminous X-ray sources, supernova remnants, starburst-driven outflows, and hot gas. Accreting nuclear SMBH (i.e., low-luminosity and heavily obscured AGN) are certainly also present in some cases (e.g., see Section 2.4), although they probably contribute of these galaxies’ X-ray emissions at low energies. Some starburst and normal galaxies at cosmological distances (–1.5) are now being detected at 0.5–2 keV fluxes below erg cm-2 s-1. They constitute a rising fraction of the total number of X-ray sources toward fainter fluxes (up to 30–40%; see Figure 3), and this trend will continue until they become the numerically dominant source population at 0.5–2 keV fluxes of erg cm-2 s-1 (e.g., Hornschemeier et al. 2002, 2003; Miyaji & Griffiths 2002; Ranalli, Comastri & Setti 2003; Bauer et al. 2004). This transition from AGN dominance to galaxy dominance of the X-ray number counts is broadly analogous to that observed in the radio band below a few millijanskys (e.g., Windhorst 2003 and references therein).
Distant starburst and normal galaxies in X-ray deep fields can be identified based upon their X-ray, optical, infrared, and radio properties. In the X-ray band, these galaxies typically have luminosities below erg s-1, spectra with effective power-law photon indices of –2.2, and X-ray-to-optical flux ratios of (see Figure 4). Their observed X-ray luminosity function has a lognormal form, as is also observed for galaxies at infrared and radio wavelengths (Norman et al. 2004). Optically, the distant galaxies detected in X-rays have relatively high [O ii] luminosities and morphologies consistent with those of field galaxies (e.g., Cohen 2003; Hornschemeier et al. 2003). Off-nuclear X-ray sources appear relatively important, as they are observed in % of these galaxies at . These have X-ray luminosities of to a few times erg s-1 and are probably luminous black-hole binaries or groups of X-ray binaries (e.g., Hornschemeier et al. 2004).
The X-ray emission from starburst and normal galaxies can provide an independent measure of their SFRs that is relatively immune to extinction effects (e.g., Bauer et al. 2002b; Cohen 2003; Grimm, Gilfanov & Sunyaev 2003; Ranalli, Comastri & Setti 2003; Persic et al. 2004). X-ray derived SFRs agree respectably with SFRs from optical, infrared, and radio measurements, at least when the X-ray emission from high-mass X-ray binaries dominates or can be isolated. Many of the distant galaxies detected in X-ray deep fields have remarkably high estimated SFRs of –300 yr-1. These galaxies are members of the strongly evolving, dusty starburst population responsible for creating much of the infrared background (e.g., Alexander et al. 2002).
The stellar sources of X-ray emission in galaxies should show substantial evolution with redshift in response to the factor of –100 increase in cosmic SFR out to –3. The high-mass X-ray-binary population is expected to track the cosmic SFR closely, peaking at –3, whereas low-mass X-ray binaries should track it with a lag of a few Gyr due to their longer evolutionary timescales, therefore peaking at –1 (e.g., Ghosh & White 2001). Source-stacking analyses have allowed the average X-ray properties of –4 galaxies to be measured, complementing the individual X-ray detections of galaxies (e.g., Brandt et al. 2001ac; Hornschemeier et al. 2002; Nandra et al. 2002; Seibert, Heckman & Meuer 2002; Georgakakis et al. 2003; Reddy & Steidel 2004; Lehmer et al. 2005). These analyses indicate that the ratio of X-ray to -band luminosity for galaxies rises from –1, such that galaxies at are –5 times as X-ray luminous (per unit -band luminosity) as their local counterparts. Lyman break galaxies at –4 have typical X-ray properties similar to those of the most X-ray luminous local starbursts, and X-ray estimates of SFRs in Lyman break galaxies are in respectable agreement with those derived using rest-frame UV data (after appropriate UV reddening corrections are made).
4 Future Prospects for Deep Extragalactic X-ray Surveys
Follow-up studies for the surveys in Table 1 are ongoing, and both Chandra and XMM-Newton continue to generate torrents of superb data. Thus, rapid progress on deep extragalactic X-ray surveys should continue over the next decade. Some key outstanding problems requiring further work include
-
1.
The detailed cosmic history of SMBH accretion. Have X-ray surveys found the vast majority of actively accreting SMBH, or are they missing substantial numbers of Compton-thick and other X-ray weak AGN? To what degree have the complex X-ray spectra of AGN, combined with limited photon statistics, confused current estimates of obscuration and luminosity? What physical mechanisms are responsible for the observed anti-hierarchical growth of SMBH?
-
2.
The nature of AGN activity in young, forming galaxies. How common are moderate-luminosity, typical AGN in the –10 universe? Are these AGN feeding and growing in the same way as local AGN? What is the connection between SMBH growth and star formation in submillimeter galaxies?
-
3.
X-ray measurements of clustering and large-scale structure. What are the detailed clustering properties of X-ray selected AGN out to high redshift, and is there a dependence of AGN fueling upon large-scale environment? How do X-ray groups and clusters evolve out to high redshift, and what does this say about structure formation? How do X-ray, optical, and radio measures of clustering relate?
-
4.
The X-ray properties of cosmologically distant starburst and normal galaxies. How have the X-ray-source populations in these galaxies evolved over cosmic history? Is the relationship between X-ray-binary production and star formation indeed universal as indicated by the correlation between X-ray luminosity and star-formation rate?
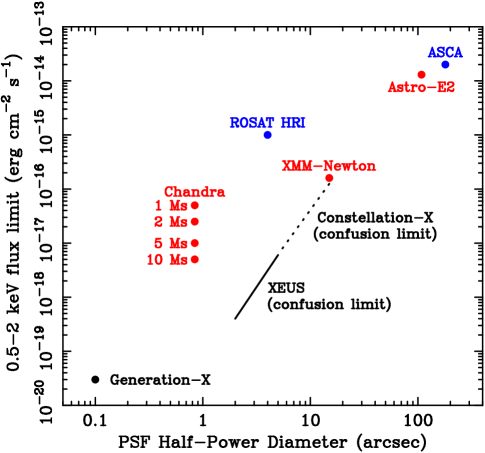
Table 1 and Figure 1 show that the deep X-ray surveys we have reviewed already cover a respectable amount of the depth versus solid angle “discovery space.” However, fully answering the outstanding questions above will likely require improvement along both dimensions of this space. For example, a longer 5–10 Ms Chandra observation could reach 0.5–2 keV flux levels of erg cm-2 s-1 while remaining confusion free and nearly photon limited near the field center. It would search for distant Compton-thick AGN, improve the spectral constraints for and understanding of faint X-ray-source populations, and detect a few hundred new distant starburst and normal galaxies. Such a sensitive X-ray observation will not be possible again for 10–20 years until the launches of missions such as X-ray Evolving Universe Spectroscopy (XEUS) and Generation-X (see Figure 10).
An equally important approach is to survey more solid angle at 0.5–2 keV flux levels of (2–50) erg cm-2 s-1, where currently our understanding of the X-ray universe suffers from limited source statistics and cosmic variance. Several surveys underway specifically target this part of discovery space, such as the Extended Chandra Deep Field-South, the Extended Groth Strip, and COSMOS (see Table 1). These should substantially improve understanding of the X-ray luminosity function at high redshift, the clustering properties of X-ray selected AGN, and the evolution of X-ray groups and clusters.
Finally, a technically challenging but scientifically critical goal is to perform deep extragalactic X-ray surveys at higher energies than those reviewed here. Surveyors of the –100 keV band can look forward to observing directly the obscured AGN and other sources that comprise the bulk of the CXRB. The next decade of research in this field should thus be as exciting as the last.
Acknowledgments
We thank all of our colleagues for educational interactions on deep extragalactic X-ray surveys. Colleagues who specifically helped with the preparation of this review include DM Alexander, FE Bauer, H Brunner, BD Lehmer, V Mainieri, T Miyaji, P Rosati, DP Schneider, AT Steffen, and C Vignali. We acknowledge financial support from NSF CAREER award AST-9983783 and Chandra X-ray Center grants (WNB), and DLR grant 50 OR 0207 (GH).


References
- (1) Agol E, Krolik JH. 2000. Ap. J. 528:161–70
- (2) Alexander DM, Brandt WN, Hornschemeier AE, Garmire GP, Schneider DP, Bauer FE, Griffiths RE. 2001. Astron. J. 122:2156–76
- (3) Alexander DM, Aussel H, Bauer FE, Brandt WN, Hornschemeier AE, et al. 2002. Ap. J. 568:L85–88
- (4) Alexander DM, Bauer FE, Brandt WN, Hornschemeier AE, Vignali C, et al. 2003a. Astron. J. 125:383–97
- (5) Alexander DM, Bauer FE, Brandt WN, Schneider DP, Hornschemeier AE, et al. 2003b. Astron. J. 126:539–74
- (6) Alexander DM, Smail I, Bauer FE, Chapman SC, Blain AW, Brandt WN, Ivison RJ. 2005. Nature 434:738–40
- (7) Almaini O, Lawrence A, Boyle BJ. 1999. MNRAS 305:L59–63
- (8) Barger AJ, Cowie LL, Mushotzky RF, Richards EA. 2001a. Astron. J. 121:662–82
- (9) Barger AJ, Cowie LL, Bautz MW, Brandt WN, Garmire GP, et al. 2001b. Astron. J. 122:2177–89
- (10) Barger AJ, Cowie LL, Steffen AT, Hornschemeier AE, Brandt WN, Garmire GP. 2001c. Ap. J. 560:L23–28
- (11) Barger AJ, Cowie LL, Capak P, Alexander DM, Bauer FE, et al. 2003a. Astron. J. 126:632–65
- (12) Barger AJ, Cowie LL, Capak P, Alexander DM, Bauer FE, et al. 2003b. Ap. J. 584:L61–64
- (13) Barger AJ, Cowie LL, Mushotzky RF, Yang Y, Wang WH, Steffen AT, Capak P. 2005. Astron. J. 129:578–609
- (14) Bauer FE, Alexander DM, Brandt WN, Hornschemeier AE, Miyaji T, et al. 2002a. Astron. J. 123:1163–78
- (15) Bauer FE, Alexander DM, Brandt WN, Hornschemeier AE, Vignali C, Garmire GP, Schneider DP. 2002b. Astron. J. 124:2351–63
- (16) Bauer FE, Alexander DM, Brandt WN, Schneider DP, Treister E, Hornschemeier AE, Garmire GP. 2004. Astron. J. 128:2048–65
- (17) Blain AW, Smail I, Ivison RJ, Kneib JP, Frayer DT. 2002. Phys. Rep. 369:111–76
- (18) Borys C, Scott D, Chapman SC, Halpern M, Pope A, Nandra K. 2004. MNRAS 355:485–503
- (19) Boyle BJ, Griffiths RE, Shanks T, Stewart GC, Georgantopoulos I. 1993. MNRAS 260:49–58
- (20) Brandt WN, Laor A, Wills BJ. 2000. Ap. J. 528:637–49
- (21) Brandt WN, Hornschemeier AE, Alexander DM, Garmire GP, Schneider DP, et al. 2001a. Astron. J. 122:1–20
- (22) Brandt WN, Alexander DM, Hornschemeier AE, Garmire GP, Schneider DP, et al. 2001b. Astron. J. 122:2810–32
- (23) Brandt WN, Hornschemeier AE, Schneider DP, Alexander DM, Bauer FE, Garmire GP, Vignali C. 2001c. Ap. J. 558:L5–9
- (24) Brandt WN, Schneider DP, Vignali C. 2004a. In AGN Physics with the Sloan Digital Sky Survey, ed. GT Richards, PB Hall, pp. 303–12. San Francisco: ASP Press
- (25) Brandt WN, Vignali C, Schneider DP, Alexander DM, Anderson SF, et al. 2004b. Adv. Space Res. 34:2478–85
- (26) Brandt WN, Alexander DM, Bauer FE, Vignali C. 2005. In Physics of Active Galactic Nuclei at All Scales, ed. D Alloin, R Johnson, P Lira, in press (astro-ph/0403646). Berlin: Springer-Verlag
- (27) Brusa M, Comastri A, Mignoli M, Fiore F, Ciliegi P, et al. 2003. Astron. Astrophys. 409:65–78
- (28) Cagnoni I, della Ceca R, Maccacaro T. 1998. Ap. J. 493:54–61
- (29) Chapman SC, Blain AW, Ivison RJ, Smail IR. 2003. Nature 422:695–98
- (30) Chokshi A, Turner EL. 1992. MNRAS 259:421–24
- (31) Cohen JG. 2003. Ap. J. 598:288–300
- (32) Comastri A, Setti G, Zamorani G, Hasinger G. 1995. Astron. Astrophys. 296:1–12
- (33) Comastri A, Fiore F, Vignali C, Matt G, Perola GC, La Franca F. 2001. MNRAS 327:781–87
- (34) Comastri A, Mignoli M, Ciliegi P, Severgnini P., Maiolino R., et al. 2002. Ap. J. 571:771–78
- (35) Comastri A. 2004. In Supermassive Black Holes in the Distant Universe, ed. AJ Barger, pp. 245–72. Dordrecht: Kluwer
- (36) Comastri A, Brusa M, Ciliegi P, Mignoli M, Fiore F, et al. 2005. In New Visions of the X-ray Universe in the XMM-Newton and Chandra Era, ed. F Jansen, in press (astro-ph/0203019). Noordwijk: ESA Press
- (37) Cowie LL, Garmire GP, Bautz MW, Barger AJ, Brandt WN, Hornschemeier AE. 2002. Ap. J. 566:L5–8
- (38) Cowie LL, Barger AJ, Bautz MW, Brandt WN, Garmire GP. 2003. Ap. J. 584:L57–60
- (39) Cristiani S, Alexander DM, Bauer FE, Brandt WN, Chatzichristou ET, et al. 2004. Ap. J. 600:L119–22
- (40) Croom SM, Smith RJ, Boyle BJ, Shanks T, Miller L, Outram PJ, Loaring NS. 2004. MNRAS 349:1397–418
- (41) D’Elia V, Fiore F, Elvis M, Cappi M, Mathur S, et al. 2004. Astron. Astrophys. 422:11–21
- (42) De Luca A, Molendi S. 2004. Astron. Astrophys. 419:837–48
- (43) Dijkstra M, Haiman Z, Loeb A. 2004. Ap. J. 613:646–54
- (44) Elvis M, Schreier EJ, Tonry J, Davis M, Huchra JP. 1981. Ap. J. 246:20–27
- (45) Elvis M, Risaliti G, Zamorani G. 2002. Ap. J. 565:L75–77
- (46) Fabian AC, Barcons X. 1992. Annu. Rev. Astron. Astrophys. 30:429–56
- (47) Fabian AC, Iwasawa K. 1999. MNRAS 303:L34–36
- (48) Fabian AC. 2004. In Coevolution of Black Holes and Galaxies, ed. LC Ho, pp. 447–60. Cambridge: Cambridge University Press
- (49) Fadda D, Flores H, Hasinger G, Franceschini A, Altieri B, et al. 2002. Astron. Astrophys. 383:838–53
- (50) Fan X, Strauss MA, Schneider DP, Gunn JE, Lupton RH, et al. 2001. Astron. J. 121: 54–65
- (51) Feigelson ED, Hornschemeier AE, Micela G, Bauer FE, Alexander DM, et al. 2004. Ap. J. 611:1107–20
- (52) Ferguson HC, Dickinson M, Williams R. 2000. Annu. Rev. Astron. Astrophys. 38:667–715
- (53) Ferrarese L, Ford H. 2005. Space Sci. Rev. in press (astro-ph/0411247)
- (54) Fiore F, Brusa M, Cocchia F, Baldi A, Carangelo N, et al. 2003. Astron. Astrophys. 409:79–90
- (55) Gendreau KC, Barcons X, Fabian AC. 1998. MNRAS 297:41–48
- (56) Georgakakis A, Georgantopoulos I, Stewart GC, Shanks T, Boyle BJ. 2003. MNRAS 344:161–68
- (57) Georgantopoulos I, Stewart GC, Blair AJ, Shanks T, Griffiths RE, et al. 1997. MNRAS 291:203–10
- (58) Ghosh P, White NE. 2001. Ap. J. 559:L97–100
- (59) Giacconi R, Gursky H, Paolini FR, Rossi BB. 1962. Phys. Rev. Lett. 9:439–43
- (60) Giacconi R, Bechtold J, Branduardi G, Forman W, Henry JP, et al. 1979. Ap. J. 234:L1–7
- (61) Giacconi R, Zirm A, Wang JX, Rosati P, Nonino M, et al. 2002. Ap. J. Supp. 139:369–410
- (62) Giavalisco M, Ferguson HC, Koekemoer AM, Dickinson M, Alexander DM, et al. 2004. Ap. J. 600:L93–98
- (63) Gilli R, Salvati M, Hasinger G. 2001. Astron. Astrophys. 366:407–17
- (64) Gilli R, Cimatti A, Daddi E, Hasinger G, Rosati P, et al. 2003. Ap. J. 592:721–27
- (65) Gilli R. 2004. Adv. Space Res. 34:2470–77
- (66) Gilli R, Daddi E, Zamorani G, Tozzi P, Borgani S, et al. 2005. Astron. Astrophys. 430:811–25
- (67) Grimm HJ, Gilfanov M, Sunyaev R. 2003. MNRAS 339:793–809
- (68) Grogin NA, Conselice CJ, Chatzichristou E, Alexander DM, Bauer FE, et al. 2005. Ap. J. submitted
- (69) Haehnelt MG, Kauffmann G. 2001. In Black Holes in Binaries and Galactic Nuclei, ed. L Kaper, EPJ van den Heuvel, PA Woudt, pp. 364–74. Berlin: Springer
- (70) Hasinger G, Burg R, Giacconi R, Hartner G, Schmidt M, Trümper J, Zamorani G. 1993. Astron. Astrophys. 275:1–15
- (71) Hasinger G, Burg R, Giacconi R, Schmidt M, Trümper J, Zamorani G. 1998. Astron. Astrophys. 329:482–94
- (72) Hasinger G, Zamorani G. 2000. In Exploring the Universe: A Festschrift in Honor of Riccardo Giacconi, ed. H Gursky, R Ruffini, L Stella, pp. 119–38. Singapore: World Scientific
- (73) Hasinger G, Altieri B, Arnaud M, Barcons X, Bergeron J, et al. 2001. Astron. Astrophys. 365:L45–50
- (74) Hasinger G. 2004. Nuc. Phys. B (Proc. Supp.) 132:86–96
- (75) Hasinger G. 2005. In Growing Black Holes: Accretion in a Cosmological Context, ed. A Merloni, S Nayakshin, RA Sunyaev, pp. 418–32. Berlin: Springer-Verlag
- (76) Hasinger G, Miyaji T, Schmidt M. 2005. Astron. Astrophys. submitted
- (77) Hewett PC, Foltz CB. 1994. PASP 106:113–30
- (78) Hornschemeier AE, Brandt WN, Alexander DM, Bauer FE, Garmire GP, et al. 2002. Ap. J. 568:82–87
- (79) Hornschemeier AE, Bauer FE, Alexander DM, Brandt WN, Sargent WLW, et al. 2003. Astron. J. 126:575–95
- (80) Hornschemeier AE, Alexander DM, Bauer FE, Brandt WN, Chary R, et al. 2004. Ap. J. 600:L147–50
- (81) Hunt MP, Steidel CC, Adelberger KL, Shapley AE. 2004. Ap. J. 605:625–30
- (82) Ishisaki Y, Ueda Y, Yamashita A, Ohashi T, Lehmann I, Hasinger G. 2001. PASJ 53:445–57
- (83) Jansen F, Lumb D, Altieri B, Clavel J, Ehle M, et al. 2001. Astron. Astrophys. 365:L1–6
- (84) Kim DW, Cameron RA, Drake JJ, Evans NR, Freeman P, et al. 2004. Ap. J. Supp. 150:19–41
- (85) Koekemoer AM, Alexander DM, Bauer FE, Bergeron J, Brandt WN, et al. 2004. Ap. J. 600:L123–26
- (86) Kormendy J, Gebhardt K. 2001. In The 20th Texas Symposium on Relativistic Astrophysics, ed. JC Wheeler, H Martel, pp. 363–82. Woodbury: AIP
- (87) Krivonos R, Vikhlinin A, Churazov E, Lutovinov A, Molkov S, Sunyaev R. 2005. Ap. J. in press (astro-ph/0409093)
- (88) Lamer G, Wagner S, Zamorani G, Mignoli M, Hasinger G, Giedke K, Staubert R. 2003. Astr. Nach. 324:16–19
- (89) Lehmann I, Hasinger G, Schmidt M, Giacconi R, Trümper J, et al. 2001. Astron. Astrophys. 371:833–57
- (90) Lehmer BD, Brandt WN, Alexander DM, Bauer FE, Conselice CJ, et al. 2005. Astron. J. 129:1–8
- (91) Leighly KM, Halpern JP, Jenkins EB. 2004. In AGN Physics with the Sloan Digital Sky Survey, ed. GT Richards, PB Hall, pp. 277–80. San Francisco: ASP Press
- (92) Lockman FJ. 2004. In Soft X-ray Emission from Clusters of Galaxies and Related Phenomena, ed. R Lieu, pp. 111–24. Dordrecht: Kluwer
- (93) Madau P, Ghisellini G, Fabian AC. 1994. MNRAS 270:L17–21
- (94) Mainieri V, Rosati P, Tozzi P, Bergeron J, Gilli R, et al. 2005. Astron. Astrophys. in press (astro-ph/0502542)
- (95) Maiolino R, Comastri A, Gilli R, Nagar NM, Bianchi S, et al. 2003. MNRAS 344:L59–64
- (96) Manners JC, Johnson O, Almaini O, Willott CJ, Gonzalez-Solares E, et al. 2003. MNRAS 343:293–305
- (97) Marconi A, Risaliti G, Gilli R, Hunt LK, Maiolino R, Salvati M. 2004. MNRAS 351:169–85
- (98) Marshall FE, Boldt EA, Holt SS, Miller RB, Mushotzky RF, et al. 1980. Ap. J. 235:4–10
- (99) Matt G. 2002. Phil. Trans. R. Soc. Lond. A 360:2045–2056
- (100) McCammon D, Sanders WT. 1990. Annu. Rev. Astron. Astrophys. 28:657–88
- (101) McHardy IM, Jones LR, Merrifield MR, Mason KO, Newsam AM, et al. 1998. MNRAS 295:641–71
- (102) Mignoli M, Pozzetti L, Comastri A, Brusa M, Ciliegi P, et al. 2004. Astron. Astrophys. 418:827–40
- (103) Miyaji T, Hasinger G, Schmidt M. 2000. Astron. Astrophys. 353:25–40
- (104) Miyaji T, Griffiths RE. 2002. Ap. J. 564:L5–8
- (105) Miyaji T, Griffiths RE, Lumb D, Sarajedini V, Siddiqui H. 2003. Astr. Nach. 324:24–27
- (106) Miyaji T, Sarajedini V, Griffiths RE, Yamada T, Schurch M, et al. 2004. Astron. J. 127:3180–91
- (107) Moran EC, Filippenko AV, Chornock R. 2002. Ap. J. 579:L71–74
- (108) Moretti A, Campana S, Lazzati D, Tagliaferri G. 2003. Ap. J. 588:696–703
- (109) Mushotzky RF, Cowie LL, Barger AJ, Arnaud KA. 2000. Nature 404:459–64
- (110) Mushotzky RF. 2004. In Supermassive Black Holes in the Distant Universe, ed. AJ Barger, pp. 53–88. Dordrecht: Kluwer
- (111) Nandra K, Mushotzky RF, Arnaud K, Steidel CC, Adelberger KL, et al. 2002. Ap. J. 576:625–39
- (112) Nandra K, Laird ES, Adelberger K, Gardner JP, Mushotzky RF, et al. 2005. MNRAS 356:568–86
- (113) Norman C, Hasinger G, Giacconi R, Gilli R, Kewley L, et al. 2002. Ap. J. 571:218–25
- (114) Norman C, Ptak A, Hornschemeier AE, Hasinger G, Bergeron J, et al. 2004. Ap. J. 607:721–38
- (115) Osmer PS. 2004. In Coevolution of Black Holes and Galaxies, ed. LC Ho, pp. 325–41. Cambridge: Cambridge University Press
- (116) Page MJ, McHardy IM, Gunn KF, Loaring NS, Mason KO, et al. 2003. Astr. Nach. 324:101-04
- (117) Persic M, Rephaeli Y, Braito V, Cappi M, Della Ceca R, Franceschini A, Gruber DE. 2004. Astron. Astrophys. 419:849–62
- (118) Peterson BM. 1997. An Introduction to Active Galactic Nuclei, pp. 186–93. Cambridge: Cambridge University Press
- (119) Ranalli P, Comastri A, Setti G. 2003. Astron. Astrophys. 399:39–50
- (120) Reddy NA, Steidel CC. 2004. Ap. J. 603:L13–16
- (121) Revnivtsev M, Gilfanov M, Sunyaev R, Jahoda K, Markwardt C. 2003. Astron. Astrophys. 411:329–34
- (122) Rigby JR, Rieke GH, Maiolino R, Gilli R, Papovich C, et al. 2004. Ap. J. Supp. 154:160–65
- (123) Risaliti G, Maiolino R, Salvati M. 1999. Ap. J. 522:157–64
- (124) Risaliti G, Elvis M, Gilli R, Salvati M. 2003. Ap. J. 587:L9–13
- (125) Rosati P, Borgani S, Norman C. 2002a. Annu. Rev. Astron. Astrophys. 40:539–77
- (126) Rosati P, Tozzi P, Giacconi R, Gilli R, Hasinger G, et al. 2002b. Ap. J. 566:667–74
- (127) Sarajedini VL, Gilliland RL, Kasm C. 2003. Ap. J. 599:173–84
- (128) Schmidt M. 1968. Ap. J. 151:393–409
- (129) Schmidt M, Schneider DP, Gunn JE. 1995. Astron. J. 110:68–77
- (130) Schmidt M, Hasinger G, Gunn JE, Schneider DP, Burg R, et al. 1998. Astron. Astrophys. 329:495–503
- (131) Schneider DP, Fan X, Hall PB, Jester S, Richards GT, et al. 2003. Astron. J. 126:2579–93
- (132) Schwartz DA. 1980. Phys. Scripta 21:644–49
- (133) Seibert M, Heckman TM, Meuer GR. 2002. Astron. J. 124:46–52
- (134) Setti G, Woltjer L. 1973. In IAU Symposium No. 55: X-ray and Gamma-Ray Astronomy, ed. H Bradt, R Giacconi, pp. 208–213. Dordrecht: Reidel
- (135) Severgnini P, Caccianiga A, Braito V, Della Ceca R, Maccacaro T, et al. 2003. Astron. Astrophys. 406:483–92
- (136) Shankar F, Salucci P, Granato GL, De Zotti G, Danese L. 2004. MNRAS 354:1020–30
- (137) Silva L, Maiolino R, Granato GL. 2004. MNRAS 355:973–85
- (138) Silverman JD, Green PJ, Barkhouse WA, Cameron RA, Foltz C, et al. 2005. Ap. J. in press (astro-ph/0406330)
- (139) Snellen IAG, Best PN. 2001. MNRAS 328:897–902
- (140) Sołtan A. 1982. MNRAS 200:115–22
- (141) Spergel DN, Verde L, Peiris HV, Komatsu E, Nolta MR, et al. 2003. Ap. J. Supp. 148:175–94
- (142) Steffen AT, Barger AJ, Cowie LL, Mushotzky RF, Yang Y. 2003. Ap. J. 596:L23–26
- (143) Stern D, Tozzi P, Stanford SA, Rosati P, Holden B, et al. 2002a. Astron. J. 123:2223–45
- (144) Stern D, Moran EC, Coil AL, Connolly A, Davis M, et al. 2002b. Ap. J. 568:71–81
- (145) Streblyanska A, Bergeron J, Brunner H, Finoguenov A, Hasinger G, Mainieri V. 2004. Nuc. Phys. B (Proc. Supp.) 132:232–35
- (146) Szokoly GP, Bergeron J, Hasinger G, Lehmann I, Kewley L, et al. 2004. Ap. J. Supp. 155:271–349
- (147) Tananbaum H, Avni Y, Branduardi G, Elvis M, Fabbiano G, et al. 1979. Ap. J. 234:L9–13
- (148) Tozzi P, Rosati P, Nonino M, Bergeron J, Borgani S, et al. 2001. Ap. J. 562:42–51
- (149) Treister E, Urry CM, Chatzichristou E, Bauer FE, Alexander DM, et al. 2004. Ap. J. 616:123–35
- (150) Ueda Y, Takahashi T, Inoue H, Tsuru T, Sakano M, et al. 1998. Nature 391:866–68
- (151) Ueda Y, Takahashi T, Inoue H, Tsuru T, Sakano M, et al. 1999. Ap. J. 518:656–71
- (152) Ueda Y, Akiyama M, Ohta K, Miyaji T. 2003. Ap. J. 598:886–908
- (153) Vignali C, Bauer FE, Alexander DM, Brandt WN, Hornschemeier AE, Schneider DP, Garmire GP. 2002. Ap. J. 580:L105–09
- (154) Vignali C, Brandt WN, Schneider DP, Anderson SF, Fan X, et al. 2003. Astron. J. 125:2876–90
- (155) Wang JX, Malhotra S, Rhoads JE, Brown MJI, Dey A., et al. 2004a. Astron. J. 127:213–29
- (156) Wang JX, Rhoads JE, Malhotra S, Dawson S, Stern D, et al. 2004b. Ap. J. 608:L21–24
- (157) Wang JX, Malhotra S, Rhoads JE, Norman CA. 2004c. Ap. J. 612:L109–12
- (158) Weedman DW. 1986. Quasar Astronomy, pp. 123–39. Cambridge: Cambridge University Press
- (159) Weisskopf MC, Tananbaum HD, Van Speybroeck LP, O’Dell SL. 2000. Proc. SPIE, 4012:2–16
- (160) Windhorst RA. 2003. New. Ast. Rev. 47:357–65
- (161) Wolf C, Wisotzki L, Borch A, Dye S, Kleinheinrich M, Meisenheimer K. 2003. Astron. Astrophys. 408:499–514
- (162) Worsley MA, Fabian AC, Bauer FE, Alexander DM, Hasinger G, et al. 2004. MNRAS 357:1281–87
- (163) Yang Y, Mushotzky RF, Barger AJ, Cowie LL, Sanders DB, Steffen AT. 2003. Ap. J. 585:L85–88
- (164) Yu Q, Tremaine S. 2002. MNRAS 335:965–76
- (165) Yuan F, Narayan R. 2004. Ap. J. 612:724–28
- (166) Zamorani G, Mignoli M, Hasinger G, Burg R, Giacconi R, et al. 1999. Astron. Astrophys. 346:731–52
-
(167)
Zheng W, Mikles VJ, Mainieri V, Hasinger G, Rosati P, et al.
2004. Ap. J. 155:73–87
![[Uncaptioned image]](/html/astro-ph/0501058/assets/x11.png)