Packet Loss in High Data Rate Internet Data Transfer for eVLBI
Abstract
VLBI is gradually moving to the point where Gbps data rates are becoming routine. A number of experiments have shown that the internet can be used at data rates of several hundred Mbps on production networks. However use of the network is accompanied by packet loss. The paper discusses the statistics of packet loss as found by recent tests and investigates the expected effect of packet loss on correlator performance and signal to noise ratio on eVLBI observations. The relative merits of UDP versus TCP are also discussed.
1 Introduction
Much of the new science with VLBI requires the use of the best possible sensitivity. EVN is well placed for this since we have some of the largest radio telescopes in the world. However further improvements can only come from using wider bandwidths. The current tape systems are coming to the end of their lives, however there are two recent advances in technology that are transforming VLBI: the introduction of the Mk5 disk-based recording system and the use of the Internet. Experiments in high bandwidth data transfer using the Internet have taken place over the last 2 years, culminating in the first ever real-time VLBI image:
-
•
September 2002: JBO-WSRT fringes were obtained for the iGRID 2002 exhibition in Amsterdam. Westerbork data were pre-recorded on disk using the PCEVN system and transmitted via SuperJANET4 in Manchester, over the EC-funded GÉANT network to Amsterdam and then via the new SURFnet link to Dwingeloo where it was stored and then correlated with JBO data recorded on tape. Peak VLBI data transfer rates of 500 Mb/s were obtained to Amsterdam (Hughes-Jones et al 2003)
-
•
October 2002 – July 2003; various small-scale tests were undertaken and ftp-vlbi implemented at data rates of a few 10’s of Mbps
-
•
July 2003, WSRT connected at 2.5 Gb/s to Dwingeloo
-
•
October – December 2003. Data transmission tests between Manchester and Dwingeloo achieved more than 900 Mbps – see this paper
-
•
November 2003: An international baseline, Onsala (SE) – Haystack (USA) was used, producing eVLBI fringes only 15 minutes after observations were made.
-
•
November 2003: Onsala Space Observatory connected at 1Gb/s.
-
•
January 2004: First eVLBI image using Jb, On, Wb. Data recorded on MkV and transmitted over the normal Internet connection from JBO (using 155 Mbps connection from JBO-Manchester) and over dedicated links from Onsala and WSRT. Data were then received on MkV systems at JIVE, buffered on disk and played back into the correlator.
-
•
April 2004: Real-time fringes On-Wb (no disks) – with data streaming directly from the telescopes to the correlator.
-
•
28 April 2004: First image from a real-time eVLBI session involving Jb, On and Wb. No disks were used. The data were streamed from telescopes directly into the correlator and fringes obtained immediately. An image of the gravitational lens system B0218+357 was produced 4 hours after the observations ended.
In spite of these successes, it is still unclear how VLBI should make the best use of the Internet: data rates may be limited by local conditions in hardware and software, by the local area network, by the international networks (e.g. GÉANT) and not least by the protocols used. An important parameter is the effect of packet loss on the data, and this problem is addressed in this paper. Our data rates are high compared with the average Internet user and so we must be aware of the possibility of denial of service to others. eVLBI is a strong driver (along with high energy particle physics, the GRID and high performance computing) for increases in the available bandwidth of networks as is evident from the recent favourable discussions with Research and Education Network providers. It may well be possible to achieve data rates of several Gbps per telescope in the not too distant future.
2 Tests on the Network
An investigation of the link from the University of Manchester to JIVE in Dwingeloo was undertaken as a 4th year MPhys project by a pair of undergraduate students (Mathews and O’Toole) in the Autumn term of 2003. The link used the SuperJANET4 academic network in the UK to connect to London, then GÉANT to Amsterdam, followed by SURFnet to JIVE in Dwingeloo.
There are two main protocols in common use on the Internet, determined by software in the sending and receiving machines: Transmission Control Protocol (TCP/IP) which is used by most ftp systems, and User Datagram Protocol (UDP) which as the name suggests can be modified to suit by the user. In both systems data are congregated into packets: the larger the packets the higher the throughput, limited by the maximum size of packet that can be accommodated by routers in the link. In our case this was 1500 bytes, allowing 1472 bytes of user data. Data were placed on the LAN using 1-Gigabit Ethernet connections. Data rates of close to 1 Gbps can be achieved provided appropriate network interface cards and machines are used (Hughes-Jones et al. 2004). In fact the record at the time of writing (July 2004) stands at 6.6 Gbps on a Geneva–Los Angeles link using 10-Gigabit cards. TCP/IP produces a bit-wise correct transfer and tries to be fair for other users. Packets are checked on arrival and an acknowledgement sent back to the transmitter. A missing packet is interpreted as congestion and the transmit rate is halved (Stevens 1993). This can result in a highly variable transmit rate, but with no missing or corrupted data and perhaps explains the variable data rates obtained in recent eVLBI experiments (Parsley priv. comm.). UDP however will transmit at a rate determined by the user and the available bandwidth, and has no acknowledgement. Packets can therefore be lost or out of order with no effect on the transmit rate, though the receive rate will be less if packets are lost!
The main aim of the project was to find the distribution of packet loss in the data transfers and so UDP was chosen. A monitoring program UDPmon (available from http://www.hep.man.ac.uk/u/rich/) automatically sends packets and finds data rates and loss as a function of packet size and inter-packet interval. Fig. 1 shows the data rates achieved using a 2 GHz Xeon machine at Manchester and the 1.2 GHz PIII MkV machine at Dwingeloo for tests made on 11 November (Man–Dwing) and 13 November (Dwing–Man). Near wire rates were achieved at maximum, using 106 packets from UDPmon simulating near-continuous data transfer. The fall off as 1/(packet spacing) occurs because the time separating transmission of the packets is dominant over the physical transmission time and the link is waiting for data. The flat part of the curve indicates that the link (and computers) are limiting the rate. Fig. 2 shows that it is in this flat region that packet loss occurs.


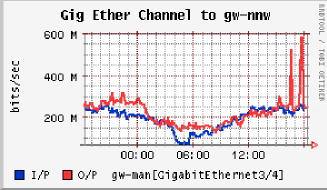
Packet loss can occur due to insufficient processor power or bus capacity in the end machines, or by congestion in routers on the link. Fig. 3 shows the traffic on the link to the Net North West router from Manchester University averaged over 5 minute intervals. Our tests, with average data rates of 400 Mbps, clearly dominate the traffic, and so congestion occurs when our data rate reaches 900 Mbps, close to the capacity of one of the two 1 Gigabit Ethernet links used to form the Ether Channel.
3 Effect of Packet Loss on VLBI data
Loss of data will cause a decrease in signal to noise (S/N) in VLBI observations. In normal circumstances S/N will be proportional to where is the fraction of packets lost. However if the loss of data is sufficient for the correlator to lose synchronisation, rather more data can be lost. The MkIV Station Unit in the MkIV correlator checks parity of each 9-bit (8 plus parity) MkIV VLBI byte. If more than 10% of the bytes per frame are wrong then the whole frame of 2500 9-bit bytes is rejected. Luckily the MkIV can flywheel synchronisation over to the next frame, but obviously if successive frames are rejected then synchronisation is lost. This gives the MkIV systems some resilience to data loss – a consequence of having to deal with drop-outs on tape systems.
In an eVLBI system where lost packets can be replaced by random data, then on average 50% will have the wrong parity. There are 1472x8-bit bytes in a packet and 2500x9 bit bytes in a VLBI data frame with 32 tracks, giving 2500x9x4/1472=61.14 packets per frame. (The value quoted in Hughes-Jones et al. (2003) is in error).
On average therefore 0.2x61=12.2 packets need to be lost per frame before a frame is rejected. Suppose average packet loss per frame is where is the number of packets lost per file and is the number of frames in a file. Assuming Poisson statistics, the probability of packets being lost in a frame is given by
A frame is rejected if more than 12 packets are lost so the number of frames rejected per file is:
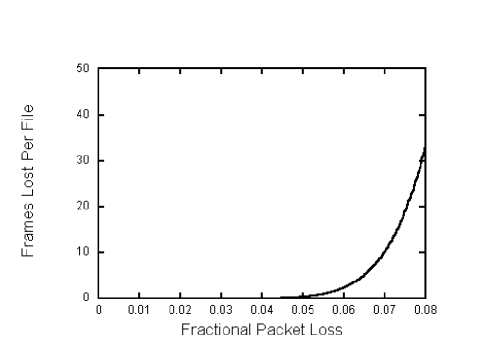
Fig. 4 shows the number of frames lost in a 1.8 Gbyte file (as used in the iGRID2002 experiment) as a function of the fractional packet loss (number of packets lost per file / number of packets in the file), assuming that missing packets are replaced by random data. Frame loss is a strong function of packet loss when the fractional loss exceeds a few %. More than one frame is rejected in a file of 1.8 Gbytes (i.e. in 28 seconds of data at 512 Mbps) if there is more than 5 % packet loss. If missing packets are not replaced then all missing packets have wrong parity and so one or more frames are lost if more than 1.5 % packets are lost. Since loss of synchronisation would mean that the correlator will need some time to recover, then a figure for packet loss of say less than 2 % is a useful limiting specification for eVLBI using the Dwingeloo MkV correlator, since then we would expect either no or rare loss of synchronisation in either case.
The above calculation is only true if packet loss obeys a Poisson distributed statistical process, i.e. if successive packet loss is independent and obeys normal counting statistics. However congestion is likely to result in correlated bursts in packet loss so long term correlation is expected. A run on the Manchester-Dwingeloo link during a time of high packet loss was undertaken to test this idea.
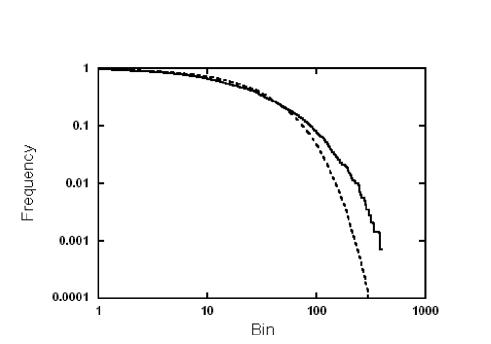
Fig. 5 shows the cumulative distribution of intervals between lost packets (i.e. where is the time interval and the probability density) found in tests on 4th December 2003 when a total of 1409 packets were lost in a 0.6 sec run. The distribution of intervals for Poisson process follows a falling exponential (e.g. Picinbono 1993) and the cumulative distribution should also be a falling exponential.
The mean time between lost packets was 424 sec, in good agreement with 394 sec found from the fitted exponential. There does seem to be an excess of events for bins greater than 100 (1200 sec) and a Kolmogorov-Smirnov test shows that this is significant at the 10 % level. There is therefore some evidence of long-term effects, however we can conclude that packet loss obeys Poisson statistics to a reasonable approximation for times up to around 1 msec.
Long term effects are expected in such data. Analyses of world-wide-web traffic have shown that the flow is self-similar (Crovella and Bestavros 1996, Park and Willinger 2000). Traffic occurs in bursts, and file transmission times have more events with long transmission times than expected, often obeying a power law distribution. Packet loss, if related to congestion, is expected to show similar behaviour, though we have little evidence of a power law tail in the distribution of packet loss in fig. 4. However these data were from one run only, more tests covering a wider variety of link conditions are in progress and might show self-similar effects more clearly.
4 TCP or UDP?
The question of which protocol TCP or UDP to use for eVLBI is important. TCP gives reliable data transfer and is fair to other users, but could be disadvantageous to eVLBI. UDP can achieve high throughput, but could in some circumstances lead to denial of service for other users, which would not be good politically.
A comparison of throughput can be made by use of models of TCP behaviour (Padhye et al. 2000). As mentioned above, TCP drops the rate by a factor of 2 when packet loss occurs. The number of packets in the window is then incremented by one for each further packet successfully received. TCP traffic rates therefore follow a saw-tooth pattern. The average sending rate can only reach 0.75 where is the available bandwidth of the link. where is the window size in packets (i.e. the number of packets in transit), the packet size in bytes and the round trip time (RTT). Allowing for packet loss and time-outs the model shows that the transmission rate is given by
This formula was derived for the (now obsolete) RENO version of TCP. An analysis for more recent implementations has not yet been made, but it should still be a good approximation.
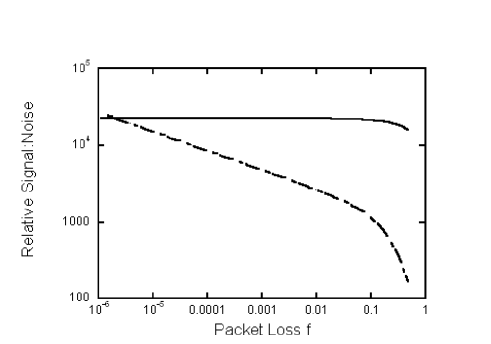
The signal to noise ratio (S/N) in one second is proportional to where is the bandwidth and the fraction of data lost in one second. Fig. 6 shows a comparison of the S/N for UDP and TCP, when packet loss occurs, assuming that the rate at which UDP data is sent is 512 Mbps and that the full bandwidth (1 Gbps) is available for TCP. Though TCP will give a higher S/N when there is no packet loss under these conditions (though under such a circumstance the UDP rate could also be increased), it can be seen that the S/N for TCP rapidly deceases when only moderate packet loss occurs. UDP is therefore expected to give much better performance for eVLBI.
An important point missed out so far is the fact that for the standard TCP stack, the time for TCP to recover its throughput from the loss of one packet on long distance high bandwidth links can be very large (), i.e. minutes for trans-European links (RTT 20 ms) and hours for trans-Atlantic links (RTT 150 ms). The link may therefore never get into equilibrium as assumed in the modelling described above, and so TCP data rates may be even lower. This dramatic variation in TCP throughput will affect the time that the data from each telescope is presented to the receiving program. As the path from each telescope will have different packet loss and RTTs, this implies difficulties in arranging suitable buffering of the data to maintain presentation of corresponding VLBI data from the telescopes to the correlator.
5 Conclusions
Experiments made on existing networks show that data rates close to the limiting capacity of 1 Gbit Ethernet are possible on European networks, at least for short periods, and that rates of 512 Mbps should not be considered unreasonable. Packet loss should be kept to less than 2% to avoid loss of synchronisation in the correlator if UDP is used. Our experiments show that the assumption of Poisson statistics for the distribution of packet loss is a good approximation, but further work is needed to clarify expected power law behaviour at long intervals. UDP gives higher throughput when packet loss occurs, the resultant decrease in TCP rates has a devastating effect on signal to noise ratio. Other implementations of TCP (e.g. High Speed TCP, Fast TCP and TCP Friendly Rate Control) may offer more optimal solutions, by maintaining high throughput even in the presence of packet loss. These problems are shortly to be investigated further by PDRAs working at the University of Manchester. Useful comments on high data rate transfer can be found on http://grid.ucl.ac.uk/nfnn.html.
Acknowledgements.
The authors thank Steve Parsley and the staff at JIVE for their valuable assistance in running the experiments to Dwingeloo.References
Crovella, M. E., & Bestavros, A., 1996, Proc ACM Sigmetrics, May
Hughes-Jones, R., Clarke, P., Dalison, S., & Fairey, G.. 2004, Fut. Gen Comp. Sys., in press
Hughes-Jones, R., Parsley, S., & Spencer, R., 2003, Fut. Gen Comp. Sys. 19, 883
Stevens, W. R., 1993, ‘TCP/IP Illustrated Vols 1 and 2’, Addison Wesley
Padhye, J., Firoiu, V., Towsley, D. F., & Kurose, J. F., 2000 IEEE/ACM Trans Net, 8, 133
Park, K., & Willinger, W., 2000, Self-Similar Network Traffic and Performance Evaluation, Wiley
Picinbono, R., 1993, Random Signals and Systems, Prentice Hall