email: torres@iaa.es, antxon@iaa.es 22institutetext: Departamento de Astronomía y Astrofísica, Universidad de Valencia, 46100 Burjassot, Spain
email: J.M.Marcaide@uv.es
VLBI observations of young Type II supernovae
Abstract
We give an overview of circumstellar interaction in young Type II supernovae, as seen through the eyes of very-long-baseline interferometry (VLBI) observations. The resolution attained by such observations ( mas) is a powerful tool to probe the interaction that takes place after a supernova goes off. The direct imaging of a supernova permits, in principle, to estimate the deceleration of its expansion, and to obtain information on the ejecta and circumstellar density profiles, as well as estimates of the magnetic field intensity and relativistic particle energy density in the supernova. Unfortunately, only a handful of radio supernovae are close and bright enough as to permit their study with VLBI. We present results from our high-resolution observations of the nearby Type II radio supernovae SN 1986J and SN 2001gd.
1 Introduction
Radio supernovae are mostly associated with core-collapse supernovae (Type II and Ib/c). Here, we will discuss only Type II radio supernovae, although most results apply as well to Type Ib/c radio supernovae. The progenitors of Type II supernovae are surrounded by a high-density wind, , where is the mass loss rate of the presupernova wind in units of 10, is the presupernova wind velocity in units of , and is the supernova shock radius in units of cm. In the standard interaction model for radio supernovae (Chevalier [1982], Nadyozhin [1985]), a forward shock at velocities thar largely exceed propagates into the circumstellar medium (CSM) when the blastwave reaches the dense, ionized, slowly expanding wind. In addition, a reverse shock moves back into the stellar envelope at speeds of relative to the expanding ejecta. As a result, a high-energy-density shell is formed.
The brightness temperature inferred from VLBI images of SNe is very large, indicating that the emission is of non-thermal origin, namely synchrotron radiation from relativistic electrons () in the high-energy-density shell. As it expands, a radio supernova quickly increases its radio brightness with time, due to the increasingly smaller electron column density in the line of sight. When the optical depth at cm-wavelengths has dropped to about unity, the supernova reaches its maximum of emission, after which the emission monotonically decreases. If synchrotron self-absorption effects are negligible, then the only relevant source of absorption is free-free absorption by thermal electrons in the CSM, and the radio luminosity evolves as (). Thus, a radio supernova is first seen at high frequencies and, as times goes, it becomes visible at increasingly lower frequencies. We see that the flux density monitoring of radio supernovae may yield important information on such fundamental physical parameters as magnetic field intensity and relativistic particle energy density in the supernova shell, as well as information on the relevant absorption and cooling mechanisms. Since the radio peaks of SNe are usually of the order of a few milliJansky, only bright, nearby radio supernovae are good VLBI targets.
The density of the supernova ejecta can be approximated by a steep power-law profile (). If the mass loss parameters () stay approximately constant up to the explosion, the CSM density profile is then . The dense shell formed at shock breakout decelerates as it interacts with the CSM, and it can be shown that the expansion of the shell radius follows a power-law with time: . More generally, , leading to . Therefore, by carrying several VLBI observations of the same supernova, we may be able to infer the value of its deceleration index, , and indirectly the values of and that characterize the ejecta and CSM density profiles.
2 SN 1986J in NGC 891
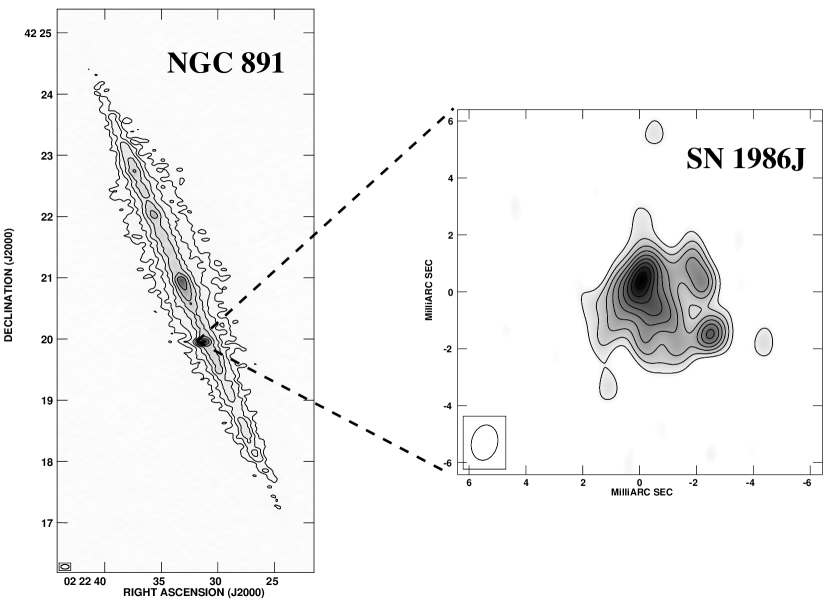
SN 1986J in NGC 891 is one of the most radio luminous SNe ever discovered. The precise date of its explosion is not known, but on the basis of the available radio and optical data SN 1986J was estimated to have exploded around the end of 1982, or the beginning of 1983 (e.g., Weiler, Panagia & Sramek 1990). Based upon its large radio luminosity, Weiler et al. [1990] suggested that the progenitor star was probably a red giant with a main-sequence mass of (20 – 30) M⊙ that had lost material rapidly () in a dense stellar wind. VLBI observations made at 8.4 GHz at the end of 1988 by Bartel et al. ([1991], hereafter B91) showed that the radio structure of SN1986J had the form of a shell, in agreement with expectations from the standard interaction model, with the minimum of emission located approximately at its center. Those authors claimed the existence of several protrusions at distances of twice the shell radius, and with apparent expansion velocities as high as . Since these protrusions were twice as far as the mean radius of the shell, it then follows that the main bulk of the shell expanded at roughly . Such protrusions have been successfully invoked by Chugai ([1993]) to explain the coexistence of velocities smaller than 1000 km s-1 implied from the observed narrow optical lines (Leibundgut et al. [1991]), and the large velocities indicated from the VLBI measurements.
We used archival VLA and global VLBI observations of supernova 1986J at 5 GHz, taken about 16 yr after the explosion, to obtain the images shown in Fig. 1. The right panel corresponds to the 5 GHz VLBI image of SN1986J. It shows a highly distorted shell of radio emission, indicative of a strong deformation of the shock front. The apparent anisotropic brightness distribution is very suggestive of the forward shock colliding with a clumpy, or filamentary wind. Note that there are several “protrusions” outside the shell, though just above three times the noise level and at different position angles from those previously reported by B91. Therefore, these protrusions could not be real, but must be just artifacts of the image reconstruction procedure. If this is the case, the disappearance of the protrusions seen in the previous VLBI observations (B91) would imply a change in the density profile of the circumstellar wind.
At a distance of 9.6 Mpc (Tully 1998), 1 mas corresponds to a linear size of . Based on 8.4 GHz VLBI observations, B91 found an angular size of 3.7 mas for the shell of SN 1986J, 5.74 yr after its explosion (assuming it took place on 1983.0). The corresponding mean linear velocity would then be 14700 km s-1 for the first 5.74 yr. However, this velocity applies only to the protrusions found by B91, not to the shell. Indeed, the velocities reported in B91 were calculated for the protrusions, and assuming that these originated in the centre at the time of the explosion. These authors also pointed out that the protrusions extended from the centre to twice the radius of the shell, i.e., the protrusions were outside the shell. Therefore, a value of 1.85 mas for the angular size of the shell of SN 1986J at epoch 1988.74 is indicated, and a mean linear velocity of the radio shell of 7400 km s-1 is more appropriate to characterize the first 5.74 yr of the expansion of SN 1986J, as has been previously noticed by Chevalier ([1998]) and Houck et al. ([1998]).
The angular size of the shell of SN 1986J on 21 February 1999 is 4.7 mas, equivalent to cm. Combining this angular size measurement with that obtained by B91 for epoch 1988.74 ( mas), we obtain a mean angular expansion velocity of the shell between 29 September 1988 (1988.74) and 21 February 1999 (1999.14) of , which corresponds to a linear velocity of . If we assume that SN 1986J freely expanded for the first 5.74 yr of its life () and then started to decelerate, the expansion between the two epochs of VLBI observations is characterized by . This mild deceleration contrasts with the case of several other supernovae, for which a strong deceleration has been measured (SN1979C: Marcaide et al. [2002]; SN1987A: Staveley-Smith et al. [1993], Gaensler et al. [1997]; SN1993J: Marcaide et al. [1997], Bartel et al. [2000]).
For a standard presupernova wind velocity, =10 km s-1, the linear size of SN 1986J at epoch =16.14 yr implies that we are sampling the progenitor wind about 11000 yr prior to its explosion. Since the mass loss rate of SN 1986J seems to have been (Weiler, Panagia & Sramek 1990), the swept-up mass must have been for a standard density profile of the progenitor wind (). Since the expansion of the supernova has not decelerated significantly between the two VLBI observations, it follows that the swept-up mass by the shock front must be much less than the mass of the ejected hydrogen-rich envelope, , as otherwise we should have observed a much stronger deceleration. In fact, momentum conservation implies that , significantly larger than . If the hydrogen-rich mass envelope was as high as 12 M⊙, this is a hint that the progenitor of SN 1986J was probably a single, massive Red Super Giant (as previously suggested by Weiler et al. 1990), which lost mass rapidly, but managed to keep intact most of its hydrogen-rich envelope by the time of explosion. This result contrasts with the cases of SN 1993J and SN 1979C, whose hydrogen-rich envelopes had masses of 0.2–0.4 M⊙(Woosley et al. 1994, Houck & Fransson 1996) and (Marcaide et al. 2002), and whose progenitor stars were part of binary systems.
Since the radio emission is of synchrotron origin, we can estimate a minimum total energy (in magnetic fields, electrons, and heavy particles) and a minimum magnetic field for SN 1986J. If we assume equipartition, then the minimum total energy is (Pacholczyk 1970) where is the radio luminosity of the source, is a characteristic size, is a slowly-dependent function of the spectral index, , is the fraction of the supernova’s volume occupied by the magnetic field and by the relativistic particles (filling factor), and is the ratio of the (total) heavy particle energy to the electron energy. This ratio depends on the mechanism that generates the relativistic electrons, ranging from up to , where and are the proton and electron mass, respectively.
Based on snapshot VLA observations of SN 1986J carried out on 13 June 1999, we determined an spectral index of () between 1.6 and 8.5 GHz. This value is very close to obtained by B91, and is a typical value for supernovae that are in the optically thin radio regime. With and mJy from our observations, we obtain a radio luminosity erg s-1 for the frequency range – Hz. The value of the function is approximately . As the characteristic size for SN 1986J, we take half the largest diameter of the shell, , which corresponds to a linear size of cm. With these values, the minimum total energy is then
where =0.66, =2.35 mas , and =9.6 Mpc. The value of the magnetic field that yields is then equal to
Since , can have values between and , while the corresponding values of the magnetic field can lie between and (for and ). These values of the magnetic field for SN 1986J are in agreement with, e.g., those obtained for SN 1993J at similar radii. For example, Pérez-Torres, Alberdi, and Marcaide [2001] showed that G, which results in a value of mG for a radius of cm. Since it is very unlikely that the magnetic field energy density in the wind is larger than its kinetic energy density, i.e., , we can then obtain an upper limit for the magnetic field in the circumstellar wind of SN 1986J:
where =, =10, =, and we have assumed a standard wind density profile. For SN 1986J, and cm, and we obtain mG. These arguments suggest that the magnetic field in the shell of SN 1986J is in the range 13–93 mG, or about 40 to 300 times the magnetic field in the circumstellar wind. Since a strong shock yields a fourfold increase in the particle density, the post-shock magnetic field is also fourfold increased. Hence, compression alone of the circumstellar wind magnetic field cannot account for the large magnetic fields existing in SN 1986J, and other field amplification mechanisms are needed to be invoked, e.g., turbulent amplification (Chevalier 1982; Chevalier & Blondin 1995). The same conclusion was reached for the case of SN 1993J (Fransson & Björnsson 1998, Pérez-Torres et al. [2001]), where magnetic field amplification factors were found to be necessary.
| SN 1979C1 | SN 1986J2 | SN 2001gd3 | SN 1993J4 | |
| Distance (Mpc) | 16.1 | 9.6 | 21.6 | 3.63 |
| Time since explosion5 (yr) | ||||
| 1 | ||||
| Radio brightness structure | Shell (likely) | Distorted shell | ? | Smooth shell |
| ? | ||||
| Deceleration parameter | ? | |||
| (years) | Not yet | ? | ||
| Asymmetric expansion? | No | Yes | ? | No () |
| Circumstellar medium | ? | Clumpy | ? | Approx. smooth |
| ? | ||||
| ? | ||||
| Explosion scenario | Binary | Single | Binary? | Binary |
| Magnetic field amplification | Turbulent | Turbulent | Turbulent | Turbulent |
-
1 From Marcaide et al. ([2002]). 2 From Pérez-Torres et al. ([2002]). 3 From Pérez-Torres et al. ([2004]). 4 From Marcaide et al. ([1995]), Marcaide et al. ([1995]), Marcaide et al. ([1997]), Pérez-Torres et al. ([2001],[2002]). 5 Time since explosion at which we are discussing the property of the supernova.
3 SN 2001gd in NGC 5033
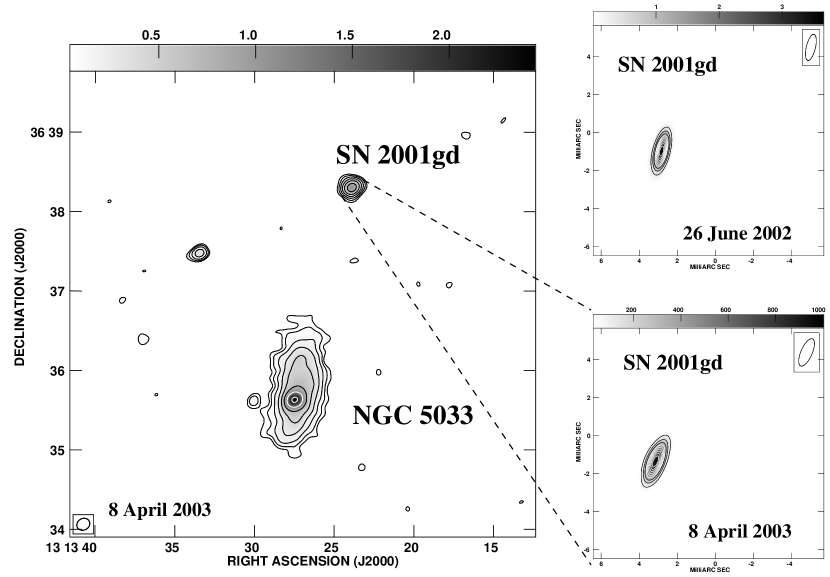
NGC 2001gd in NGC 5033 was discovered by Nakano et al. ([2001]) on 24.820 November 2001, although its explosion date is uncertain. The supernova had a visual magnitude of 14.5, and is located 3’ north-northwest of the nucleus of NGC 5033. Nakano et al. ([2001]) reported the following position for SN 2001gd: =13h13m23s.89, =+36∘38’17”.7. They also reported that there was no star visible at the above position on earlier frames taken from 1996 to April 2001. A spectrum obtained by P. Berlind ten days later (Matheson et al. [2001]), showed SN 2001gd to be a Type IIb supernova well past maximum light. Matheson et al. ([2001]) pointed out that the spectrum was almost identical to one of SN 1993J obtained on day 93 after explosion Matheson et al. ([2000]). Since SN 1993J was a strong radio emitter, it was natural to expect SN 2001gd to be also strong in radio. Stockdale et al. ([2002]) detected SN 2001gd on 8 February 2002 at cm-wavelengths with the Very Large Array (VLA), thus confirming the suggestion that SN 2001gd should be a strong radio emitter. Their continuous monitoring of SN 2001gd since its first radio detection has confirmed that SN 2001gd is very similar in its radio properties to SN 1993J (Stockdale et al. [2003]), as suggested by their optical similarity.
We observed SN 2001gd on 26 June 2002 and 8 April 2003 at a frequency of 8.4 GHz, using an earth-wide global VLBI array (Pérez-Torres et al. [2004]). Unfortunately, we were unable to resolve the fine radio structure of SN 2001gd (Fig. 2), despite the milliarcsecond resolution of our VLBI array. Therefore, we had to resort to non-imaging data analysis to make fits to the visibility data and estimate the true supernova size at each epoch. We assumed spherical symmetry for our model fits, and used the following models: (i) an optically thin sphere; (ii) an uniformly bright, circular disk; and (iii) an optically thin shell of width 25% the inner radius. Formally, all three models gave equally good fits to the () data, so in principle we could not rule out any of them. Although we suggest the uniformly bright, optically thick disk might be ruled out as a physical model in 2003.27, since the supernova was optically thin at 8.4 GHz, we have left it for comparison purposes. The systematic increase in angular diameter in all three models indicates that the supernova is expanding.
At a distance of 13 Mpc, 100 as correspond to a linear distance of 2 cm. The average expansion velocity of the supernova can then be written as 22600 km s-1, where = Mpc is the apparent distance to the supernova, the angular radius in as, and the time since explosion, in days. Hence, the average expansion speed of SN 2001gd on 26 June 2002 (), ranges from 2600 km s-1 (optically thin shell), up to 149003000 km s-1 (optically thin sphere). For our second epoch (), we obtain velocities between 700 km s-1 (shell) and 86001800 km s-1 (sphere). For any given model, the expansion speeds seem to decrease, but this decrement is only marginal, so the expansion is compatible with a non-decelerated ejecta. Thus, future VLBI observations are necessary to confirm, or reject, the validity of the deceleration.
We can estimate a minimum total energy and a minimum magnetic field for SN 2001gd, as we have done previously for SN 1986J. From our VLA observations on 8 April 2003, we determined an spectral index of () between 1.4 and 43 GHz, and . With those values, we obtain erg s-1between 1.4 and 43 GHz. As , we take the linear size corresponding to half the angular size of SN 2001gd measured in the 8 April 2003 epoch, as, which translates into to a linear size of cm. With these values, we get
Since , is in the range – erg, and the equipartition magnetic field in the range (52–376) mG. Thus, for a typical energy of 1051 erg for the explosion of SN 2001gd, the fraction of energy necessary to power the radio emission of SN 2001gd is quite modest. The upper range of the equipartition magnetic field is in marginal agreement with that obtained for SN 1993J at the same radius ( 1.8 G, [1998]; 0.5 G, [2001]). We note that our inferred equipartition magnetic field cannot be explained by compression of the pre-existing field in the circumstellar wind. Following the same reasoning made for SN 1986J, we obtain that For cm and a mass loss rate similar to that of SN 1993J (), we obtain mG, which is a factor about 35 to 250 times smaller than the equipartition field. Thus, it seems that to explain the radio emission from SN 2001gd, we also need to invoke amplification mechanisms other than compression of the circumstellar magnetic field, e.g., turbulent amplification.
4 Summary
We have presented results from VLBI observations of two Type II supernovae, SN 1986J and SN 2001gd. Those results are summarized in Table 1, where we have also included for comparison results obtained from radio observations on two other Type II supernovae, SN 1979C and SN 1993J.
VLBI observations of Type II supernovae suggest that if particles and fields are not far from equipartition, then it seems clear that amplification mechanisms other than compression from the existing circumstellar magnetic field must be acting, in order to explain the observed synchrotron radio emission. Turbulent amplification seems to be the most promising mechanism.
We would like to end this contribution by stressing that very-long-baseline interferometry (VLBI) observations of radio supernovae are a powerful tool to probe the circumstellar interaction that takes place after a supernova explodes. We recall the VLBI community that we have had to wait 11 years to have a really ”SN1993J”-like event, and even so at a distance four times greater. Since those supernovae belong to the rare group of radio supernovae that permit their follow-up with VLBI, we cannot miss the few opportunities we have of observing and monitoring them. Unexpected results, like the discovery of a pulsar nebula or the accretion of material onto a black hole, might be waiting for us to unveil them, sometimes many years after the supernova explosion (e.g. Bietenholz, Bartel & Rupen [2004]).
Acknowledgements.
MAPT acknowledges support of the Spanish National programme Ramón y Cajal. The European VLBI Network is a joint facility of European, Chinese, South African and other radio astronomy institutes funded by their national research councils.References
- [1991] Bartel N., et al. 1991, Nature, 350, 212 (B91)
- [2000] Bartel N., et al. 2000, Science, 368, 610
- [2004] Bietenholz M.F., Bartel N., & Rupen M. 2004, Science, 304, 1947
- [1982] Chevalier R.A. 1982, ApJ, 259, 302
- [1995] Chevalier, R. A., & Blondin, J. M. 1995, ApJ, 442, 312
- [1998] Chevalier, R.A. 1998, ApJ, 499, 810
- [1993] Chugai N.N. 1993, ApJ, 414, L101
- [1998] Fransson C., & Björnsson C.-I. 1998, ApJ, 509, 861 (FB98)
- [1997] Gaensler, B.M., et al. 1997, ApJ, 479, 845
- [1998] Houck, J.C., et al. 1998, ApJ, 493, 431
- [1991] Leibundgut B., et al. 1991, ApJ, 372, 531
- [2000] Matheson T., et al. 2000, AJ, 120, 1487
- [2001] Matheson T., Jha S., Challis P., et al. 2001, IAU Circ.
- [1995] Marcaide, J.M., et al. 1995, Nature, 373, 44
- [1995] Marcaide, J.M., et al. 1995, Science, 270, 1475
- [1997] Marcaide J.M., et al. 1997, ApJ, 270, 1475
- [2002] Marcaide J.M., et al. 2002, A&A, 384, 408
- [1985] Nadyozhin D.K. 1985, Ap&SS, 112, 225
- [2001] Nakano S., et al. 2001, IAU Circ. 7761
- [1970] Pacholczyk A. G. 1970, Radio Astrophysics (San Francisco: Freeman)
- [2001] Pérez-Torres M.A., Alberdi A. & Marcaide, J.M. 2001, A&A, 374, 997
- [2002] Pérez-Torres M.A., et al. 2002a, MNRAS, 335, L23
- [2002] Pérez-Torres, M.A, Alberdi, A. & Marcaide, J.M. 2002b, A&A, 394, 71
- [2004] Pérez-Torres M.A., et al. 2004, MNRAS, in the press
- [1993] Staveley-Smith L., et al. 1993, Nature, 366, 136
- [2002] Stockdale C.J., et al. 2003, ApJ, 592, 900
- [2003] Stockdale C.J., et al. 2003, ApJ, 592, 900
- [1998] Tully R.B. 1998, Nearby Galaxies Catalogue (Cambridge: Cambridge Univ. Press)
- [1990] Weiler K. W., Panagia, N., & Sramek, R. A. 1990, ApJ, 364, 611