A search for Interstellar absorptions towards Sgr dSph
We searched for Na I D1,D2 interstellar absorption lines towards 12 giant stars of the Sgr dwarf spheroidal and 3 stars of the associated globular cluster Terzan 7, observed at high resolution with the UVES spectrograph at the 8.2 m Kueyen VLT telescope. These stars are not an ideal background source for the analysis of interstellar (IS) absorption lines since they have been observed in the framework of a stellar abundances study. However they are sufficiently luminous to allow a decent S/N ratio at a resolution of about 43000, i.e. 7 , which allows an exploratory study. We detected two distinct groups of IS absorptions, a “local” group, with radial velocities ranging from -43 to 50 , and a high velocity group with radial velocities ranging from 150 km/s to 165 km/s. Likely the high velocity components are due to gas falling on the Sgr dSph since have been observed only in 2 stars which are separated by only 15 in the sky. We argue that the observations suggest a stripping of gas due to the passage of Sgr through the Galactic disc.
Key Words.:
Interstellar Medium – galaxies: individual: Sgr dSph stars: Globular Clusters: individual: Terzan 7| Stara | ||||||||||
|---|---|---|---|---|---|---|---|---|---|---|
| 432 | 18 | 53 | 50.75 | 27 | 27.3 | 17.55 | 0.965 | 160.8 | 0.3 | |
| 628 | 18 | 53 | 47.91 | 26 | 14.5 | 18.00 | 0.928 | 145.7 | 0.6 | |
| 635 | 18 | 53 | 51.05 | 26 | 48.3 | 18.01 | 0.954 | 125.2 | 0.2 | |
| 656 | 18 | 53 | 45.71 | 25 | 57.3 | 18.04 | 0.882 | 135.0 | 0.3 | |
| 709 | 18 | 53 | 38.73 | 29 | 28.5 | 18.09 | 0.917 | 125.2 | 0.5 | |
| 716 | 18 | 53 | 52.97 | 27 | 12.8 | 18.10 | 0.902 | 136.0 | 0.4 | |
| 717 | 18 | 53 | 48.05 | 29 | 38.1 | 18.10 | 0.872 | 142.0 | 0.4 | |
| 772d | 18 | 53 | 48.13 | 32 | 0.8 | 18.15 | 0.947 | 143.8 | 0.8 | |
| 867 | 18 | 53 | 53.02 | 27 | 29.2 | 18.30 | 0.933 | 154.3 | 0.2 | |
| 879e | 18 | 53 | 48.59 | 30 | 48.7 | 18.33 | 0.965 | 133.8 | 0.8 | |
| 894 | 18 | 53 | 36.84 | 29 | 54.1 | 18.34 | 0.940 | 129.5 | 0.8 | |
| 927 | 18 | 53 | 51.69 | 26 | 50.7 | 18.39 | 0.937 | 144.0 | 0.3 | |
| 1282f | 19 | 17 | 39.36 | 39 | 6.4 | 16.08 | 1.324 | 158.2 | 1.0 | |
| 1515f | 19 | 17 | 38.16 | 29 | 16.8 | 16.76 | 1.156 | 157.8 | 1.0 | |
| 1272f | 19 | 17 | 37.11 | 39 | 11.8 | 16.62 | 1.188 | 158.9 | 1.0 | |
a Star numbers for Sgr stars are from Marconi et al. (1998) field 1, available through CDS at cdsarc.u-strasbg.fr/pub/cats/J/A+A/330/453/sagit1.dat b accurate to 03 (Ferraro & Monaco 2002, priv. comm. for Sgr and Zaggia 2004 priv.comm. for Terzan 7) c The adopted reddening is d this is star [BHM2000] 143 of Bonifacio et al. (2000) e this is star [BHM2000] 139 of Bonifacio et al. (2000) f Star numbers for Terzan 7 stars are from the catalogue of Buonanno et al. (1995) available through CDS at cdsarc.u-strasbg.fr/pub/cats/J/AJ/109/663/table2.dat.
1 Introduction
The Sagittarius dwarf spheroidal galaxy (Sgr dSph) is one of the nearest satellites of the Milky Way. It offers an interesting opportunity for investigating the structure of the interstellar medium (ISM) in the Galactic Halo and, in principle, along all the line of sight up to the dwarf galaxy. The UVES spectra of 12 giant stars in Sgr and 3 giant stars in the associated globular cluster Terzan 7, which have been recently used to investigate the chemical composition of the Sgr dSph (Bonifacio et al., 2000, 2004; Sbordone et al., 2004) give us the opportunity to perform the first study of this kind. The Sgr giants are, of course, not ideal background sources for the study of the ISM, since the spectrum is complicated by the many stellar photospheric absorption lines. The only suitable ISM lines for which such a study is possible, with the above data, are the NaI D doublet lines. The observed stars are K giants and display strong photospheric absorptions in these lines. However the large radial velocity of Sgr ( ) guarantees that at least all the low radial velocity Galactic absorptions are not affected by the corresponding stellar absorptions. Luckily, the spectral region adjacent to the Na I D lines is relatively free from absorptions in the stellar spectrum, these two conditions allow to use these spectra for an exploratory study of the ISM towards Sgr. We further note that the hot stars in Sgr (the so called “Blue Plume” and the HB stars), which would be more desirable background sources for the study of the ISM, are considerably fainter, which implies that their use as background sources requires a major investment in telescope time. It is thus of paramount importance to make the best possible use of the available spectra.
| Star | logN | v | |
|---|---|---|---|
| 867 | 13.42 | 0.50 | |
| 14.63 | 1.57 | ||
| 716 | 11.58 | 6.05 | |
| 11.48 | 7.33 | ||
| 927 | 12.43 | 6.81 | |
| 12.42 | 3.70 | ||
| 11.94 | 1.45 | ||
| 635 | 11.80* | 0.60 | |
| 11.50* | 0.50 | ||
| 432 | 12.47* | 0.93 | |
| 13.84* | 1.30 | ||
| 13.00* | 1.10 | ||
| 879 | 12.40* | 5.30 | |
| 12.60* | 1.40 | ||
| 12.00* | 0.20 | ||
| 12.00* | 0.20 | ||
| 628 | 13.90* | 0.20 | |
| 12.40* | 0.68 | ||
| 11.50* | 1.70 | ||
| 11.60* | 0.30 | ||
| 11.40* | 0.30 | ||
| 717 | 12.45* | 0.28 | |
| 12.60* | 0.33 | ||
| 12.45* | 0.58 | ||
| 772 | 13.20* | 2.08 | |
| 12.46* | 3.43 | ||
| 11.71* | 2.11 | ||
| 656 | 12.10* | 1.70 | |
| 13.40* | 1.90 | ||
| 11.50* | 0.67 | ||
| 709 | 12.64 | 0.94 | |
| 13.15 | 2.41 | ||
| 12.18 | 3.63 | ||
| 14.53 | 0.00 | ||
| 894 | 11.80* | 1.40 | |
| 12.40* | 2.75 | ||
| 11.80* | 1.70 | ||
| 12.60 | 0.40 | ||
| 1282 | 11.87 | 2.82 | |
| 13.72 | 2.29 | ||
| 1515 | 11.60 | 2.04 | |
| 12.70* | 3.90 | ||
| 1272 | 12.38 | 2.33 | |
| 13.79 | 2.34 |
In general dSph galaxies are considered to be gas poor, as opposed to dwarf irregulars. With regard to the gas content of the Sgr dSph, pointed HI observations of its central region indicate that it does not contain a significant amount of neutral gas (Koribalski et al., 1994). The search for HI was continued by Burton and Lockman (1999), who found no detectable emission and provided an upper limit to the HI mass over 18 deg2, between and . This result is somewhat surprising since the chemical abundances (Bonifacio et al., 2000, 2004) and the colours of the Sgr stars show that it comprises a metal-rich young population implying that the Sgr dSph was forming stars within the last Gyr. Bonifacio et al. (2004) suggested that the passages of Sgr through the Galactic disc trigger star formation episodes, however this implies that there is gas available in Sgr or that it can be stripped from the disc. The “Blue Plume” stars are members of Sgr (Zaggia et al., 2004) and there is little question that they are the Main Sequence of the young population. Still the question lingers: where has the gas associated to this recent star formation gone? A recent investigation of Putman et al. (2004) has shown that gas is associated with the stream of stellar debris found to extend, along the Sgr dSph orbit, for over across the south Galactic hemisphere. It thus appears that the tidal interaction of Sgr with the Milky Way results in the stripping of gas.
Having this in mind, our attention has been focused on the search of ISM components at radial velocities close to those of the Sgr dSph stars. This is certainly a necessary condition for gas belonging to Sgr, although radial velocity by itself is not sufficient to prove that the gas is actually at that distance.
2 Observations and Analysis
Details on the observations are reported in Bonifacio et al. (2000), Bonifacio et al. (2004) and Sbordone et al. (2004). For the convenience of the reader we report the basic data on the stars used as background sources, in Table 1. The spectral resolution is about 43000, i.e. the velocity resolution is about 7 km s-1 at the NaI D2 line wavelength.
We used the very same spectra used for stellar abundance analysis in the above quoted papers and we refer the reader to those papers for details on the data reduction. For our purpose the main problem in our data is that the terrestrial Na I D emission lines, when present, cannot be satisfactorily subtracted. This implies that the lowest speed local IS components are affected, sometimes severely. However, the components in the Sgr dSph velocity range are always clean from the atmospheric emission. The heliocentric corrections were always applied before summing the spectra.
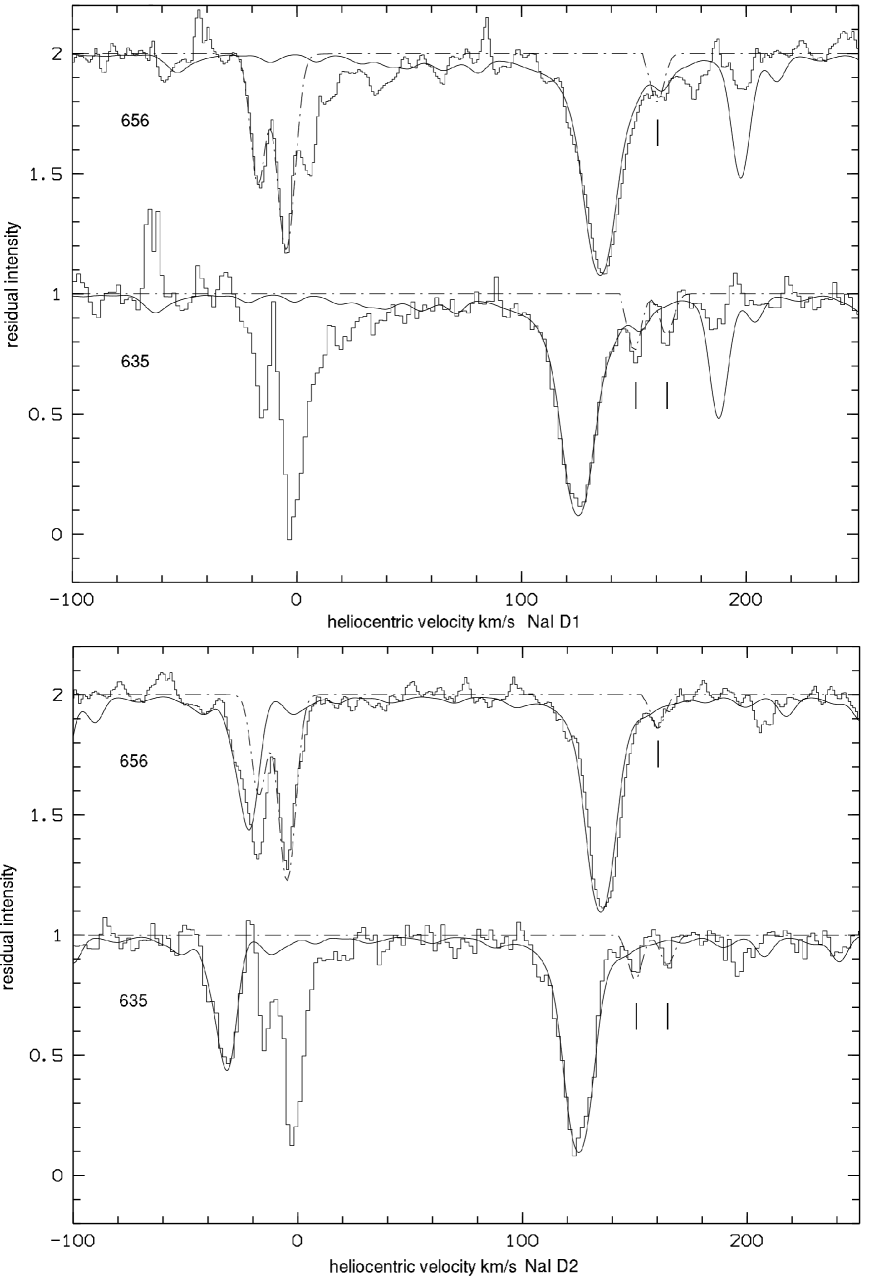
Another serious problem is posed by the stellar absorption lines, though these may be reliably identified with the aid of a synthetic spectrum, since atmospheric parameters and chemical abundances of the background sources are known. For each star we computed a synthetic spectrum using the Linux version of SYNTHE (Sbordone et al., 2004; Kurucz, 1993) and the same atmospheric parameters and abundances given in Bonifacio et al. (2000), Bonifacio et al. (2004) or Sbordone et al. (2004), as appropriate. An example of synthetic spectra is shown in Fig. 2, with this aid we rejected possible identifications of interstellar lines for which one of the components appeared to be severely blended with a stellar absorption line. The wavelength, column density and coefficient were therefore derived only when the lines were detected in both components and beyond a 3 level over the synthetic spectra, i.e. only when the latter were not able to completely reproduce the features. The analysis was performed by means of the code fitvoigtminuit (E. Caffau, 2004 private communication). This code, starting from initial guesses provided by the user, performs a voigt profile () fit; prior to the computation of the () the computed profile is convolved with an instrumental profile, in our case we used a gaussian profile with a FWHM of 7 , which is appropriate for our data, as can be verified from the profiles of unblended Th I lines in the calibration arc spectrum. The minimum is found by the MINUIT routine (James, 2001). The fitting parameters for each component are four: central wavelength, column density, factor and value. One of the useful features of MINUIT is that any of the parameters can be held fixed, even all four, in which case there is no fitting, the routine simply computes a line for the input parameters. In our case the values, which are well known for the Na I D lines, were of course always kept fixed (see Table 3).
| line | f value | |
|---|---|---|
| NaI D1 | 5889.9510 | 0.65459 |
| NaI D2 | 5895.9240 | 0.32732 |
At this relatively low resolution there is no need to take into account the hyperfine structure of the Na I D lines, which simply results in a slightly larger value. In the cases in which the detected IS lines are contaminated by the stellar absorptions (clear examples are the high velocity components shown in Fig.2), to properly recover all the parameters of the IS lines (central wavelength, and column density) it would be necessary to fit simultaneously the stellar and interstellar lines. Although this is possible, in principle, using the stellar synthetic spectra, we felt that considering the rather low S/N ratio in the spectra and the additional uncertainty introduced by the modelling of the stellar absorptions the results would be affected by a large error, too large in fact to be a useful measure. Instead, in the exploratory spirit of the present work, we decided in these cases to assume the values of and column density and fit only the central wavelength of the IS absorption. Although this procedure is somewhat arbitrary it is fairly robust. As long as column density and are fixed arbitrarily, but in such a way that the resulting synthetic spectrum is not obviously incompatible with the observed spectrum, the fitted centroid of the component does not change by more than 1 . This is clearly sufficient for the exploratory purpose of the present study. The results of our analysis are reported in Table 2. When and column density were kept fixed, the symbol * appears near the log N values.
A few comments are in order here. The available resolution is somewhat limited for a detailed analysis of the kinematic structure of the ISM. It is quite likely that in higher resolution observations the “components” we fitted split into several narrower components. The number of components to fit to a given feature is somewhat arbitrary and, for the above reason, may not have particular physical meaning. We used the criterion to use the minimum number of components in the fit. It is thus clear that we do not give particular physical significance to the column densities and factors obtained, keeping in mind that they reflect the combined effect of several gas clouds. In particular factors are not very significant; most of the values we find are well below our instrumental resolution, and thus, not very well constrained. We stress here that the FWHM of all the detected features is above the instrumental resolution. A very low fitted value of simply reflects the fact that the FWHM of the feature is only very slightly larger than the instrumental profile, however at the S/N ratios of the present data all the values of up to 7 provide almost equally acceptable fits. What is significant is that we do not observe factors in large excess of our instrumental resolution. This allows to conclude that there is no strong turbulence within the clouds and that the velocity dispersion of groups of clouds which cluster in velocity space (our “components”) is less than our instrumental resolution, i.e. 7 .
3 Results and discussions
From Table 2 we can infer the presence of two distinct groups of IS components: one which we call “local”, ranging from -43 to 50 , and a high velocity group ranging from 150 to 165 .
3.1 The local components
In most cases the sky contaminations prevent us from precise column densities or measures, nevertheless the velocity determinations are reliable.
We underline the presence of the -43 km/s and 0 towards all the Terzan7 stars, which are probably due to a local cloud covering the small angular spread of these lines of sight. The column densities and values are consistent with this scenario.
The component around –15 is also quite ubiquitous, we find it towards 7 out of 12 lines of sight towards the Sgr dSph. The Redfield and Linsky (2000) model for the G and Local Interstellar Cloud in these directions, gives velocities of –24.27 and –22.2 respectively, at our resolution these two components would appear as a unique feature at . It is not clear whether the component around found by us could be indeed compatible with the Redfield and Linsky (2000) model. As mentioned above, we had a heavy contamination by atmospheric NaI emission lines, and considering that the heliocentric corrections are around –8,–10 , a possible systematic error in our velocity measure, due to an incorrect subtraction of the atmospheric emission, leaves open the question of the identification with the above components predicted by the Redfield and Linsky (2000) model.
Another component is revealed between –7 and –2 . This velocity spread is not very significant, since our velocity resolution is 7 , perhaps it could be related to the 0 component toward Terzan 7. The column densities and values (where reliable) are not as homogeneous as those observed in the direction of Terzan 7.
Other components behave in the same ubiquitous manner, temptatively we can identify the following ones: 9-15 , 18-28 , 34-36 and 40-45 the latter two component are present towards 3 stars. Other absorptions are observed towards less than 3 lines of sight, their distances are probably greater then the previous ones, but we cannot infer any more about them. The evident absorption features of star #635 have not been fitted due to severe sky contaminations of both D1 and D2 lines.
3.2 The high velocity components
As already said, this is the first investigation towards the Sgr dSph, therefore the finding of high velocity IS absorptions could reveal the presence of gas in it, or in the Galactic Halo on the other side of Galactic centre.
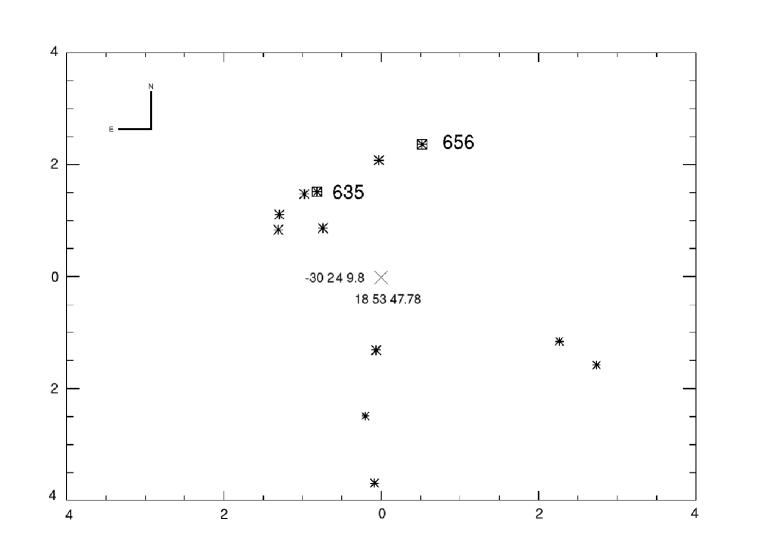
Only three components of velocities 150, 160, and 165 have been found towards only two lines of sight, as reported in Fig. 1. In particular, the 150 and 165 are revealed towards star # 635 as shown in Fig. 2. The non ubiquitous nature of these absorptions should indicate the great distance of the absorbing gas, given the relative angular clumpiness of our sample, and in particular of these two stars. Nearby clouds should cover more than 2 or 3 lines of sight, but, at the other side of our Galaxy, their angular sizes could not. In particular, the nearest star to # 635 is # 927, which shows no detectable IS absorptions at these velocities, its angular separation corresponds to a linear separation of 2.9pc at the distance of Sgr dSph. The non detection could be explained by three causes:
-
1.
since the radial velocity of star # 927 is 18.8 km/s higher than that of the # 635, it is obvious from Fig.2 that the stellar features could mask completely the IS ones in this velocity range.
-
2.
since from the analysis of Bonifacio et al. (2004) the # 927 is more metal rich than # 635 by a factor of two, it shows stronger stellar absorptions just around these components and this probably could, by itself, prevent us from detecting them even if they were present;
-
3.
the clouds are very clumpy, of size less than 2.9pc.
Arguments 1) and 3) apply also to star # 628, which falls exactly between the # 635 and # 656, and has a larger angular distance than the angular distance of star # 927 from star # 635, from either star # 635 or star # 656. The lack of HI detections in the Sgr dSph direction, (Burton and Lockman, 1999), could be well explained by the small angular size of case 3). Moreover, it is very interesting to note that these velocities are always greater than the stellar ones, implying that the gas is “falling” towards them.
4 Conclusions
The presence of high velocity absorptions towards 2 out of a sample of 12 stars of the Sgr dSph is the main result of our analysis. Given the Burton and Lockman (1999) upper limit on HI mass over the area, one can derive an upper limit for the HI column density of . We stress the fact that the radio beam integrates the signal over an area which is considerably larger than our field. The Sgr stars were initially found as radial velocity members on an EMMI MOS frame (Bonifacio et al., 1999) which had a side. In spite of this it is interesting to derive an estimate of an upper limit on the corresponding NaI column density. Such an estimate is clearly quite uncertain, in fact one has to assume a Na/H ratio, an ionization balance and a dust depletion factor. Rather than relying on theoretical estimates, we can assume the physical state of the gas to be similar to what observed by Molaro et al. (1993) towards the Magellanic Clouds. They found a value of for Intermediate Velocity Clouds, thus we could expect . The fact that we assume higher column densities, but still compatible with the observations, suggests one out of three possibilities: either our assumed column densities are too high by dex, or our detected high velocity absorptions arise in a clumpy medium which prevents detection of HI emission with a radio beam of , or the physical conditions in the gas are different from what assumed to derive the upper limit on NaI column density and lead to . Since this galaxy reveals a lack of gas, probably stripped away during the last perigalactic passage, it is also possible that the interaction with the Milky Way caused some gas to fall onto Sgr (see Putman et al., 2004). Although our conclusion has to be considered preliminary, since it is based on only two background stars and we have no indication on the actual distance of the clouds, it is interesting to consider the implications of this finding, assuming that the gas is at the same distance as Sgr. In the first place it shows that there is a small amount of gas in Sgr, possibly clumpy and consisting of many small clouds. This gas may be the residual of the gas which was used up in the last star formation episode of Sgr, which gave birth to the young metal-rich population found by Bonifacio et al. (2004), the rest being now in the form of stars or lost along the orbit. In the second place since this gas is chemically enriched and “falling” towards Sgr it could well be gas which has been stripped from the Milky Way. If at each passage Sgr is actually capable of “refueling” with metal enriched gas stripped from the Galactic disc, this could be a means to maintain the star formation episodes over a very long period of time, as testified by the very large metallicity spread of Sgr ( Zaggia et al. 2004), even without a large reservoir of local gas. Moreover it could explain the anomalously high metallicity of Sgr, compared to its luminosity; perhaps Sgr is not so chemically evolved because it retains efficiently the ejecta of its own SNe, but simply because it “steals” enriched material from the Milky Way. These considerations are still highly speculative, however they provide an important thrust for the continuation of such an investigation. Data for more lines of sight using hotter background sources which span a range of distances from the Galactic disc to Sgr are badly needed to test these hypothesis.
Acknowledgements.
We are grateful to E. Caffau for providing the fitvoigtminuit code and to S. Zaggia for providing accurate coordinates of the Terzan 7 stars. We are also in debt with the referee Dr. J. Linsky because the article has been improved thanks to his constructive comments. This research was done with support from the Italian MIUR COFIN2002 grant “Stellar populations in the Local Group as a tool to understand galaxy formation and evolution” (P.I. M. Tosi).References
- Bonifacio et al. (1999) Bonifacio P., Pasquini L., Molaro P., Marconi G., 1999, Ap&SS, 265, 541
- Bonifacio et al. (2000) Bonifacio P., Hill V., Molaro P., Pasquini L., Di Marcantonio P., Santin P. 2000, A&A, 359, 663
- Bonifacio et al. (2004) Bonifacio P. et al. A&A, 414, 503, 2004
- Buonanno et al. (1995) Buonanno R. et al. 1995, AJ 109, 663
- Burton and Lockman (1999) Burton W and Lockman F.J. A&A, 349, 7, 1999
- James (2001) James, F., 1998 MINUIT, Reference Manual, Version 94.1, CERN, Geneva, Switzerland
- Koribalski et al. (1994) Koribalski B., Johnston S. and Otrupeck R., MNRAS, 270, 43 1994
- Kurucz (1993) Kurucz, R. L. 1993, CD-ROM 13, 18 http://kurucz.harvard.edu
- Marconi et al. (1998) Marconi, G., Buonanno, R., Castellani, M., Iannicola, G., Molaro, P., Pasquini, L., & Pulone, L. 1998, A&A, 330, 453
- Molaro et al. (1993) Molaro, P. et al. A&A, 274, 505, 1993
- Putman et al. (2004) Putman et al. Ap.J., 603, L77, 2004
- Redfield and Linsky (2000) Redfield S. & Linsky J.L. Ap.J., 534, 825, 2000
- Sbordone et al. (2004) Sbordone, L., Bonifacio, P., Marconi, G., & Buonanno, R. 2004, MSAIt, 75, 396
- Sbordone et al. (2004) Sbordone, L., Bonifacio, P., Castelli, F., & Kurucz, R.L. 2004, MSAIS, 5, 93
- Zaggia et al. (2004) Zaggia et al. MSAIS, 5, 291