11email: valdes@pd.astro.it,bressan@pd.astro.it 22institutetext: Instituto Nacional de Astrofísica, Optica y Electrónica, Apdos. Postales 51 y 216, C.P. 72000 Puebla, Pue., México
22email: jvaldes@inaoep.mx 33institutetext: Dipartimento di Astronomia, vicolo dell’Osservatorio 5, 35122 Padova, Italy
33email: berta@pd.astro.it,rodighiero@pd.astro.it,franceschini@pd.astro.it 44institutetext: Department of Physics (Astrophysics), University of Oxford, Denys Wilkinson Building, 1 Keble Road, Oxford OX1 3RH, UK
44email: dar@astro.ox.ac.uk
NIR Spectroscopy of Luminous Infrared Galaxies and the Hydrogen Recombination Photon Deficit ††thanks: based on observations collected at the European Southern Observatory, Chile, ESO No. 67.A-0593, 71.A-0707.
We report on near-infrared medium-resolution spectroscopy of a sample of luminous and ultra-luminous infrared galaxies (LIRGs-ULIRGs), carried out with SOFI at the ESO 3.5m New Technology Telescope. Because of wavelength dependence of the attenuation, the detection of the Pa or Br line in the Ks band should provide relevant constraints on SFR and the contribution of an AGN.
We find, however, that the intensities of the Pa and Br lines, even corrected for slit losses, are on average only 10% and 40%, respectively, of that expected from a normal starburst of similar bolometric luminosity. The corresponding star formation rates, after correcting for the attenuation derived from the NIR-optical emission line ratios, are 14% and 60% of that expected if the far infrared luminosity were entirely powered by the starburst.
This confirms the existence of a recombination photon deficit, particularly in the case of the Pa line, already found in the Br line in other infrared galaxies of similar luminosity.
In discussing the possible causes of the discrepancy, we find unlikely that it is due to the presence of an AGN, though two objects show evidence of broadening of the Pa line and of the presence of coronal line emission. In fact, from our own observations and data collected from the literature we argue that the studied galaxies appear to be predominantly powered by a nuclear starburst.
Two scenarios compatible with the present data are that either there exists a highly attenuated nuclear star forming region, and/or that a significant fraction (80% ) of the ionizing photons are absorbed by dust within the HII regions. We suggest that observations in the Br spectral region could constitute a powerful tool to disentangle these two possibilities.
Key Words.:
ISM: dust extinction – Galaxies:starburst – Infrared:galaxies1 Introduction
The advent of the Infrared Space Observatory (ISO) combined with the availability of new ground based facilities such as SCUBA on the JCMT have resulted in the discovery of numerous distant galaxies with enhanced infrared (IR) emission (e.g. Elbaz et al. elb (1999), Smail et al. sma (2000), Barger et al. bar (2000), Gear et al. gear2000 (2000), Franceschini et al. fran01 (2001), Smail et al. smaetal2003 (2003), Ivison et al. ivis2002 (2002)).
It is not yet clear what mechanisms power the bolometric luminosity of these luminous (LIRGs) and ultra (ULIRGs) luminous infrared galaxies, with bolometric luminosities exceeding 10 and 10, respectively.
Perhaps, the tightest constraint on the nature of the infrared luminosity is that they mostly obey the FIR/Radio correlation of normal star forming galaxies (Sanders & Mirabel sand1 (1996)). However the presence of broad emission line components, a certain degree of polarization, power-law near infrared colours, warm far-infrared (FIR) spectra, high radio brightness temperature in the milli-arcsecond central structure and, finally, hard X-ray emission are often detected, suggesting that a significant contribution to the luminosity may come from mass accretion onto a compact central object.
These galaxies are often found to be interacting systems, indicating that the two phenomena may be triggered at once by dynamical interaction (e.g. Rigopoulou et al. rig1 (1999)).
Optical studies have been performed in order to establish the nature of these objects (e.g. Veilleux et al. veil99 (1999)), but it is difficult to disentangle between AGN and star formation processes, because the bulk of their luminosity is strongly attenuated by dust and the re-emitted FIR spectrum keeps little memory of the primary power source.
Even in objects without clear signatures of the presence of AGN, there are significant discrepancies between different observables. For example Poggianti, Bressan & Franceschini (pogg (2001)), in analyzing a sample of Infrared Galaxies with log(LIR/L⊙)11.5, concluded that the Star Formation Rate (SFR) detected from optical diagnostic tools (even corrected for attenuation) amounts to about 1/3 of that inferred from the FIR. However, if such a large fraction of stellar activity is hidden by dust, one may wonder whether also the nuclear activity is invisible at optical wavelengths.
A natural way to avoid strong dust obscuration is to look in the near infrared where, being the attenuation only a fraction (1/7) of that in the optical, one may hope to obtain an unbiased estimate of the SFR and at the same time to search for the possible presence of an obscured AGN by means of broadening of permitted emission line and/or presence of coronal lines.
With these purposes we begun a medium resolution NIR spectroscopic study with SOFI at the ESO 3.5m New Technology Telescope, of a sample of ULIRGs selected from Genzel et al. (gen (1998)) and Rigopoulou et al. (rig1 (1999)) samples. In this paper we present and discuss these new observations.
The plan of the paper is as follows. In Sections 2 we present the observations and data reduction, with an analysis of the emission line properties of target galaxies presented in subsections 2.1 and 2.2. All the process to calculate the Star Formation rates are discussed in Section 3. In particular, the technique we adopted to calculate the slit losses and to evaluate the extinction are presented in subsections 3.1 and 3.2. In Section 4 we show that, even correcting for extinction and losses from the slit, there is a large Pa/IR deficit, and we discuss its possible origin. Our conclusions are summarized in Section 5. We assume H0=65 [km/s/Mpc], =0.3, =0.7 throughout.


| Object | z | D | S12μm | S25μm | S60μm | S100μm | S25/S60 | SIR | SRadio | qd | L/C e |
|---|---|---|---|---|---|---|---|---|---|---|---|
| [Mpc] | [Jy] | [Jy] | [Jy] | [Jy] | [W m2] | [mJy] | 7.7m | ||||
| IRAS00085-1223 | 0.0198 | 80.3 | 0.395 | 2.372 | 16.62 | 16.97 | 0.143 | 1.3910-12 | 66.9b | 2.48 | |
| IRAS00188-0856 | 0.1284 | 648.6 | 0.117 | 0.372 | 2.59 | 3.40 | 0.144 | 2.4410-13 | 15.7b | 2.36 | 1.53 |
| IRAS00582-0258 | 0.0874 | 373.7 | 0.110 | 0.341 | 1.21 | 0.99 | 0.282 | 1.3310-13 | 10.1b | 2.14 | |
| IRAS01077-1707 | 0.0334 | 158.4 | 0.301 | 0.846 | 6.48 | 10.4 | 0.130 | 6.4010-13 | 43.8b | 2.32 | |
| IRAS02411+0354 | 0.1436 | 638.1 | 0.085 | 0.224 | 1.37 | 1.94 | 0.164 | 1.4010-13 | 6.6b | 2.44 | 3.17 |
| IRAS06206-6315 | 0.0924 | 455.9 | 0.069 | 0.294 | 3.96 | 4.58 | 0.074 | 3.1010-13 | 21.9a | 2.53 | 3.69 |
| IRAS19335-3632 | 0.0821 | 349.8 | 0.107 | 0.154 | 1.19 | 1.78 | 0.129 | 1.2710-13 | 7.1b | 2.36 | |
| IRAS20100-4156 | 0.1295 | 655.0 | 0.135 | 0.343 | 5.23 | 5.16 | 0.065 | 4.0010-13 | 20.3c | 2.49 | 1.92 |
| IRAS22206-2715 | 0.1314 | 579.1 | 0.096 | 0.160 | 1.75 | 2.33 | 0.091 | 1.6110-13 | 6.3b | 2.56 | |
| IRAS22491-1808 | 0.0777 | 379.7 | 0.119 | 0.549 | 5.44 | 4.45 | 0.101 | 4.1310-13 | 5.9b | 3.02 | 2.85 |
| IRAS23128-5919 | 0.0446 | 184.7 | 0.250 | 1.590 | 10.80 | 10.99 | 0.147 | 9.0710-13 | 37.3a | 2.72 | |
| IRAS23230-6926 | 0.1063 | 529.2 | 0.058 | 0.295 | 3.74 | 3.42 | 0.079 | 2.7710-13 | 32.0a | 2.31 | 1.50 |
| IRAS23389-6139 | 0.0927 | 457.5 | 0.063 | 0.244 | 3.63 | 4.26 | 0.067 | 2.8310-13 | 163.9a | 1.62 | 1.33 |
a) 843MHz flux from Mauch et al (2003);
b) 1.4GHzflux from NRAO VLA Sky Survey (Condon et al 1998); c)
Condon et al (1996)
d) FIR/Radio correlation parameter (Sanders & Mirabel 1996).
843MHz fluxes were converted to 1.4GHz fluxes
by assuming F(
e) L/C from Lutz et al. Lutz98 (1998)
2 Observations and Data Reduction
The selected galaxies were drawn from the IRAS 1.2Jy sample (Fisher et al. fish (1995)), and from Genzel et al. (gen (1998)) and Rigopoulou et al. (rig1 (1999)). The sample galaxies cover the interval of solar luminosities 11.45log(LIR/L ⊙)12.73. The IR and radio properties of our target galaxies are listed in Table 1. The penultimate column indicates the FIR/Radio correlation parameter at 1.4GHz, (see eq. 1 below), which for star forming galaxies is known to be q2.350.15 over a wide range of infrared luminosities (e.g. Sanders & Mirabel sand1 (1996)).
Medium-resolution Ks-band NIR spectroscopy of the galaxies was performed with the SOFI infrared spectrometer (Moorwood et al. moor (1998)) at the Nashmyth A focus of the ESO 3.5m New Technology Telescope (NTT), during August 2001 and August 2003. During the 2003 run, 5 minutes of Ks-band imaging were obtained as well.
The instrumental set consisted of the medium resolution grism (pixel scale = 0.292 arcsec), with a dispersion of 4.62 Å/pixel and a spectral coverage between 2.0 m and 2.3 m. The Ks filter works as order sorting filter. We adopted 1 arcsec slit, providing a spectral resolution of R / 2000 ( 150 km s-1) at 2 m.
Data were acquired by placing the galaxy at two different positions along the slit, through the standard nodding technique; the nod throw was set to 60 arcsec.
In some cases, given the peculiar structure of the galaxy, the slit has been oriented with two different position angles (see Table 2).
The standard reduction pipeline for long-slit NIR spectra was performed by using routines of the Image Reduction and Analysis Facility (IRAF111The package IRAF is distributed by the National Optical Astronomy Observatory which is operated by the Association of Universities for Research in Astronomy, Inc., under cooperative agreement with the National Science Foundation.). The spectra were flat-field corrected in the usual manner and sky was subtracted through the nod on slit procedure.
Wavelength calibration and slit-curvature correction was obtained with the Xenon/ Neon internal lamp and checked on sky IR emission lines.
Corrections for telluric features and flux calibration have been performed by observing nearly featureless hot B and/or solar-like telluric and spectro- photometric standard stars, from the Hipparcos catalogue. Atmospheric transmission variations were compensated by observing the standard stars contiguously, at similar (as near as possible to target galaxies) air masses. The adopted procedure consists in dividing the raw galaxies spectra by that of the standard star and then multiplying by its intrinsic emitted spectrum. The latter has been obtained by normalizing Pickles (pick (1998)) stellar templates of the proper spectral type to the V-to-K observed magnitudes of the standard stars. In the case of not optimal seeing conditions, we corrected the raw spectra of the standard stars for slit-losses, before applying flux calibration.
The exposure time, the position angle (PA) of the slit, the spectral type of the atmospheric calibrators and their air masses with respect to those of the observed galaxies are given in Table 2.
| IRAS name | Integ. | P.A. | Atmos. | Gal./Std. |
|---|---|---|---|---|
| (seg) | (deg) | Calib. | Air Mass | |
| 00085-1223 | 3600 | 38 | B9V | 1.11/1.11 |
| 00188-0856 | 7200 | 0 | F8V | 1.13/1.46 |
| 00582-0258 | 3600 | 55 | G0V | 1.18/1.17 |
| 3600 | 67 | B9V | 1.11/1.16 | |
| 01077-1707 | 480 | 30 | F6V | 1.22/1.25 |
| 02411+0354 | 6600 | -54 | G0V | 1.22/1.07 |
| 6600 | 90 | G0V | 1.19/1.07 | |
| 06206-6315 | 2400 | 145 | G0V | 1.57/1.69 |
| 19335-3632 | 5400 | 43 | B9V | 1.19/1.47 |
| 20100-4156 | 7500 | 25 | G2V | 1.32/1.05 |
| 8400 | -56 | B9V | 1.11/1.12 | |
| 22206-2715 | 3600 | -32 | G0V | 1.11/1.04 |
| 3600 | 61 | G0V | 1.37/1.04 | |
| 22491-1808 | 7200 | 74 | G3V | 1.02/1.08 |
| 23128-5919 | 4800 | 35 | B4V | 1.32/1.10 |
| 23230-6926 | 4500 | 158 | F7V | 1.45/1.51 |
| 23389-6139 | 480 | 8 | F5V | 1.20/1.03 |
2.1 Emission line properties
NIR spectra of galaxies in our sample, presented in Figures 1 and 2, are characterized by strong Pa or Br emission, depending on their redshift. In the Pa region we also detect weak H2 lines from higher order vibrational transitions (H2 1-0S(5) at 1.835m, H2 1-0S(3) at 1.957m, and H2 1-0S(2) at 2.033m). Almost all these galaxies show a contamination of the Pa blue wing by the HeI emission at 1.868m, and in some of them the weak Br emission at 1.945m is detected. Galaxies observed in the Br region, show H2 lines from lower order vibrational transitions (H2 1-0S(3) at 1.957m, H 2 1-0S(2) at 2.033 m, H2 1-0S(1) at 2.121m, and H 2 1-0S(0) at 2.223m). It is to note the relatively strong HeI emission at 2.058m in the case of IRAS 23128-5919.
We find a good correlation between the Pa and IR luminosity, as shown in Figure 4. The dashed line in the Figure is the zero-intercept linear correlation we obtain, log(LPaα/LIR) = -4.69. IRAS 02411+0354 has been excluded from the analysis because it falls significantly off the correlation. In the case of Br luminosity, we have only three galaxies, but our values fall on top of the relation found by Goldader et al. (gold97 (1997)). The dashed line is a zero-intercept linear correlation with slope quoted by Goldader et al. (gold97 (1997)), log(LBrγ/LIR) = -4.96.
The spatial distribution of the Pa emission in IRAS 00582-0258, IRAS 23230-6926 and IRAS 23389-6139 appears compact. The peak of the Gaussian profile of the line emission corresponds to the peak obtained from the continuum emission alone, coming from the nucleus of the galaxies. In contrast, IRAS 22491-1808 shows a broader spatial distribution in Pa emission, with some minor peaks superposed on a broader single Gaussian profile along the slit.
Six galaxies, IRAS 00188-0856, IRAS 02411+0354, IRAS 19335-3632, IRAS 20100-4156, IRAS 22206-2715, and IRAS 22491-1808 show double profiles, corresponding to the double nuclei observed in the corresponding NIR images. Finally, IRAS 06206-6315 is best fitted with three Gaussian profiles. This complexity is associated with the bright regions seen in the H and I images (Bushouse et al. bush (2002)).
In the case of galaxies observed in the Br spectral domain, IRAS00085-1223 and IRAS23128-5919 show a single Gaussian profile, while IRAS 01077-1707 is best fitted with three Gaussian profiles.
The observed emission line properties of target galaxies are shown in Table 3. Only for those galaxies with sufficient S/N have we considered the emission properties of multiple components separately while, in all other cases, we have folded the separate contribution together. The FWHM velocities have been corrected by instrumental response after subtracting in quadrature the instrumental FWHM.
2.2 Detection of AGN signatures
Typical signatures of central non thermal activity are the presence of broad emission line components and/or high excitation lines.
None of the objects observed in the Br region show a broad component of the Br line. In the case of the Pa galaxies, we have attempted to isolate a broad component of the Pa emission, by forcing the fit of the shape of the line with two Gaussians. With this procedure, in IRAS 00188-0856 and IRAS 00582-0258 we could detect a broad component of FWHM 2339 and 2210 km/s, respectively. Figure 3 shows the results of the multi Gaussian fitting for these galaxies. In the case of IRAS 00188-0856 we have also taken into account the contribution of the HeI line at 1.8689m to the general shape of the line. The broad component corresponds to about 42% and 80% of the Pa flux in the narrow component for IRAS 00188-0856 and IRAS 00582-0258, respectively. The Pa intensities reported in Table 3 correspond only to the narrow component.


Another AGN diagnostic in the NIR, is the presence of the high excitation line [SiVI]1.9628m. This diagnostic is particularly useful in Sy2 galaxies, that lack broad-line components. The [SiVI]1.9628m line falls slightly long wards of the H2 1-0S(3) 1.957 m line, causing an asymmetry in medium resolution spectra (e.g. Vanzi et al. vanzi (2002)). While our spectral resolution allow us to disentangle these two lines, the S/N is not sufficient to draw firm conclusions. However, [SiVI]1.9628m seems to be present in the spectra of IRAS 00188-0856 and IRAS 00582-0258, the same galaxies for which we have hints of a broad emission component at Pa. In all other cases there is no evidence of this coronal line.
| IRAS name | Line | Flux | EW | FWHM | FWHM | |
| [m] | [erg s-1 cm-2] | [rest] | [rest] | [km-1] | ||
| 00085-1223 | HeI | 2.1500 | 4.9910-15 | -1.04 | 34.26 | 482.26 |
| Br | 2.1661 | 1.2510-14 | -2.68 | 35.51 | 475.85 | |
| HeII | 2.2155 | 4.3410-15 | -0.99 | 29.97 | 348.24 | |
| H2 1-0S(0) | 2.2235 | 6.1510-15 | -1.43 | 20.45 | 243.83 | |
| 00188-0856 | H2 1-0S(5) | 1.8353 | 4.2110-16 | -1.81 | 16.86 | 243.82 |
| HeI | 1.8689 | 3.8610-16 | -1.79 | 18.87 | 278.64 | |
| Pa | 1.8756 | 5.9710-15 | -29.4 | 27.88 | 423.43 | |
| H2 1-0S(3) | 1.9570 | 5.0110-16 | -2.63 | 16.45 | 215.47 | |
| 00582-0258 | HeI | 1.8689 | 9.3410-17 | -1.89 | 4.37 | |
| Pa | 1.8756 | 1.6310-15 | -31.56 | 36.19 | 561.35 | |
| H2 1-0S(3) | 1.9570 | 2.0510-16 | -3.18 | 24.26 | 294.90 | |
| 01077-1707 | H2 1-0S(2) | 2.0338 | 1.2910-15 | -1.89 | 18.27 | 218.47 |
| HeI | 2.0587 | 2.2210-15 | -3.27 | 26.72 | 409.34 | |
| H2 1-0S(1) | 2.1213 | 2.1610-15 | -3.45 | 23.68 | 290.23 | |
| Br | 2.1661 | 5.6110-15 | -9.38 | 33.43 | 514.02 | |
| 02411+0354NE | HeI | 1.8150 | 3.3210-15 | -6.95 | 23.00 | 347.08 |
| H2 1-0S(5) | 1.8353 | 1.5610-16 | -2.95 | 17.62 | 251.22 | |
| HeI | 1.8689 | 5.2510-16 | -8.58 | 26.38 | 420.41 | |
| Pa | 1.8756 | 8.3010-15 | -151.5 | 22.67 | 339.52 | |
| H2 1-0S(4) | 1.8920 | 2.5210-16 | -4.82 | 19.11 | 305.08 | |
| Br | 1.9445 | 3.2910-16 | -6.03 | 17.39 | 272.50 | |
| H2 1-0S(3) | 1.9570 | 3.7310-16 | -5.59 | 21.31 | 301.19 | |
| 02411+0354SW | Pa | 1.8756 | 2.1810-15 | -92.3 | 24.37 | 369.74 |
| 06206-6315 | Pa | 1.8756 | 5.0510-15 | -30.25 | 42.01 | 651.92 |
| H2 2-1S(6) | 1.8942 | 5.6610-16 | -3.60 | 11.15 | 137.46 | |
| 19335-3632 | Pa | 1.8756 | 6.1510-15 | -124.0 | 24.64 | 368.26 |
| Br | 1.9445 | 5.1910-16 | -7.43 | 17.93 | 228.89 | |
| H2 2-1S(3) | 1.9570 | 4.0710-16 | -5.82 | 18.79 | 264.55 | |
| HeI | 2.0587 | 4.7110-15 | -8.78 | 18.23 | 237.63 | |
| 20100-4156S | H2 2-1S(5) | 1.8353 | 3.110-16 | -11.63 | 30.25 | 497.00 |
| HeI | 1.8689 | 8.810-16 | -18.61 | 62.87 | 1008.76 | |
| Pa | 1.8756 | 6.0910-15 | -136.2 | 31.36 | 501.56 | |
| Br | 1.9445 | 6.0010-16 | -13.91 | 35.02 | 540.18 | |
| H2 2-1S(3) | 1.9570 | 1.6610-15 | -39.04 | 51.47 | 788.84 | |
| 20100-4156N | HeI | 1.8689 | 3.2910-16 | -14.08 | 33.40 | 535.97 |
| Pa | 1.8756 | 1.7010-15 | -76.95 | 25.46 | 407.21 | |
| 22206-2715NE | Pa | 1.8756 | 2.8110-15 | -37.78 | 26.67 | 408.40 |
| 22206-2715SW | Pa | 1.8756 | 6.5810-16 | -13.18 | 28.79 | 439.67 |
| 22491-1808 | Pa | 1.8756 | 4.9410-15 | -90.96 | 30.07 | 449.54 |
| Br | 1.9445 | 1.2110-16 | -2.00 | 12.26 | 142.29 | |
| H2 1-0S(3) | 1.9570 | 7.0410-16 | -11.93 | 34.18 | 513.09 | |
| H2 1-0S(1) | 2.1213 | 8.3110-16 | -18.75 | 33.77 | 459.81 | |
| 23128-5919N | HeI | 2.0587 | 3.7510-15 | -8.30 | 25.75 | 427.81 |
| H2 1-0S(2) | 2.0338 | 8.2810-15 | -18.48 | 24.44 | 328.09 | |
| H2 1-0S(1) | 2.1213 | 5.8510-15 | -13.99 | 27.87 | 375.23 | |
| Br | 2.1661 | 1.3710-14 | -30.78 | 57.11 | 811.43 | |
| 23230-6926 | Pa | 1.8756 | 7.2110-15 | -111.8 | 35.53 | 501.97 |
| Br | 1.9445 | 5.9310-16 | -8.94 | 20.70 | 303.25 | |
| H2 1-0S(3) | 1.9570 | 1.3010-15 | -21.94 | 33.92 | 497.54 | |
| H2 1-0S(2) | 2.0338 | 2.8710-16 | -4.45 | 15.13 | 174.93 | |
| 23389-6139 | Pa | 1.8756 | 7.3410-15 | -77.48 | 49.56 | 676.14 |
| H2 2-1S(6) | 1.8942 | 1.7110-16 | -1.72 | 4.65 | ||
| Br | 1.9445 | 9.3010-17 | -0.90 | 2.76 | ||
| H2 1-0S(3) | 1.9570 | 2.3810-15 | -27.34 | 43.44 | 639.7 | |
| [FeII] | 1.9670 | 2.6310-16 | -2.89 | 15.24 | 150.4 |
3 The star formation rates.
In this section we compare the star formation rate derived from the Pa or Br emission lines, with that deduced from the IR, assuming that both originate in an ongoing vigorous starburst.
In order to perform a proper analysis of the star formation rate from the emission lines we need to correct the measured fluxes for slit losses and for dust extinction.
3.1 Slit loss corrections
When comparing different observations, it is important to evaluate any discrepancy caused by the different apertures. If the source has a certain degree of symmetry, it is possible to extrapolate the mono dimensional spatial profile observed along the slit, to a two-dimensional surface brightness distribution, and to estimate the flux that would be recevied by a given aperture. We define as “slit losses” the ratio between the flux corresponding to a given aperture and the flux received within our rectangular aperture.
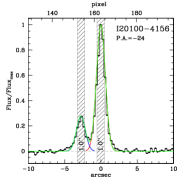
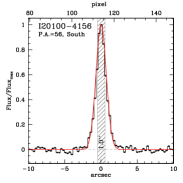
In our galaxies, the two-dimensional flux distribution was obtained by rotating around the nucleus the best fit Gaussian profile of the spatial distribution of the Pa or Br line. If the slit covers more than one nucleus, different Gaussian profiles were fitted for each nucleus. As an example, Figure 5 shows the case of IRAS20100-4156, at two position angles P.A.=-24 and 56 respectively. Slit loss coefficients, and , needed to compare our Pa fluxes to H and IR fluxes taken from the literature are reported in Table 4.

3.2 Attenuation
Correction for attenuation can be derived by comparing the observed hydrogen line emission intensity ratios, Robs, with the intrinsic values predicted by models of nebular emission, Rint.
However, since the only strong Hydrogen line present in our spectra is either Pa or Br we need to compare our fluxes with other observations taken from the literature. Duc, Mirabel & Maza (duc (1997)), Veilleux, Kim & Sanders (veil99 (1999)), and Veilleux et al. (Veil95 (1995)) provide optical spectroscopy within slit apertures of 1.25′′, 2 kpc and 4 kpc respectively, for almost all galaxies in our sample. Observed intensities of the H and H emission lines are reported in columns two and three of Table 5.
There exists a wide literature concerning predicted intrinsic line ratios of Hydrogen recombination lines. In general these values depend only very slightly on the assumed density of the emitting region (usually between cm-3) but they depend more on the electronic temperature. The latter may be assumed or may be the result of detailed modeling of HII regions, accounting for the hardness of ionizing spectrum, geometry and metallicity of the gas. To investigate this point, we have run a set of CLOUDY (Ferland, 2003) models for different HII regions, characterized by different ages of the ionizing stellar population, different metallicity and gas density. The intrinsic ratio decreases at increasing metallicity (lower electronic temperature) and increasing age (lower hardness, neglecting a hardening of the spectrum due to the presence of Wolf Rayet stars). For example, for the ratio R we find values as high as 8.5 at Z=0.008 and young ages and as low as 7.0 in metal rich HII regions and/or old cluster ages. Furthermore, more realistic galaxy models must take into account a law of star formation (almost continuous in the case of a normal star forming galaxy) which, in general will diminish the hardness of the ionizing spectrum. In all the following analysis we will make use of the recent models for normal star forming galaxies presented by Panuzzo et al. (pan03 (2003)). In these models the galaxy evolution is followed with a chemical evolution code and the spectro-photometric properties are computed with metal dependent stellar population synthesis (Bressan, Chiosi & Fagotto bress94 (1994)). Line emission is also accounted for by means of a large data set of HII region models computed with CLOUDY, with the appropriate chemical composition. The code (GRASIL, Silva et al. silva98 (1998)) also account for attenuation of light by dust, both in molecular clouds and in the more diffuse cirrus component. These models have been successfully tested against a number of different observations, from UV to the radio (Granato et al. gran00 (2000), Bressan et al. bress02 (2002) and Panuzzo et al. pan03 (2003)).
We adopt the values quoted by Panuzzo et al. (pan03 (2003)) for a star-forming galaxy, i.e. R3.0, R 7.2 and R 93.5. The latter two values, in particular, are lower than that quoted by Hummer & Storey (humm87 (1987)) ( 8.58, and 103.54), which however refer to a density of 104cm -3 and a temperature of Te=104K. Our single population CLOUDY models show that, already at Z=0.02 (solar), the temperature is below 8000K and e.g. R 8.0. Adopting R by Hummer & Storey (humm87 (1987)), would increase the derived E(B-V) by about 0.09 mag.
To evaluate the extinction from the observed Pa or Br fluxes, we have re-scaled our observations to the H aperture by multiplying our values by the coefficients CHα listed in Table 4. As for the extinction law we have used that of Calzetti et al. (2000), which is suited for starburst galaxies. The derived values of AV are shown in Table 5.
| IRAS name | CHα | CIR |
|---|---|---|
| 00085-1223 | 1.67 | 2.08 |
| 00582-0258 | 1.74 | |
| 00188-0856 | 1.18 | 1.44 |
| 01077-1707 | 1.28 | 3.44 |
| 02411+0354NE | 1.05 | 1.90 |
| 02411+0354SW | 1.05 | 1.88 |
| 06206-6315 | 1.32 | 2.44 |
| 19335-3632 | 3.56 | |
| 20100-4156S | 1.21 | 1.70 |
| 20100-4156N | 3.35 | |
| 22206-2715 | 0.41 | 3.03 |
| 22206-2715NE | ||
| 22206-2715SW | ||
| 22491-1808 | 0.83 | 4.79 |
| 23128-5919 | 1.24 | 2.04 |
| 23230-6926 | 1.16 | 3.02 |
| 23389-6139 | 1.22 | 1.76 |
3.3 The star formation rate.
To derive the star formation rate from the observed line intensities we have adopted the calibrations provided by Panuzzo et al. (pan03 (2003)):
SFR(Pa) = 5.0610-41 L(Pa) M⊙yr-1/(erg s-1)
SFR(Br) = 6.6010-40 L(Br) M⊙yr-1/(erg s-1)
For the IR luminosity (Table 1) we have adopted the calibration provided by the same authors between the star formation rate and the 8m-1000m infrared luminosity:
SFR(IR) = 4.6310-44 L(IR) M⊙yr-1/(erg s-1)
All the above calibrations refer to a Salpeter IMF between 0.1M⊙ and 120M ⊙ and take into account an increment of 16% due to the lower IMF limit with respect to the value of 0.15M⊙ adopted by Panuzzo et al. (pan03 (2003)). Pa and Br fluxes were corrected for extinction and multiplied by the coefficients CIR listed in Table 4. Luminosities have been computed adopting distances quoted in Table 1.
The values of SFR, obtained in this way from different indicators, are reported in Table 6. The last column of Table 6 indicates the ratio between the SFR derived from the hydrogen line emission and that derived from the IR luminosity.
On average the Pa luminosity, even corrected for slit losses and attenuation, provides a SFR which is only 14% of that derived from the far infrared luminosity (assuming that the latter is entirely due to the starburst). In the case of the objects showing the Br line, the average ratio is 60%.
| IRAS name | SHβ | SHα | AV | ||
|---|---|---|---|---|---|
| H/H | Pa/H | Br/H | |||
| 00085-1223 | 4.08e-15a | 1.00e-13a | 6.08 | 5.09 | |
| 00188-0856 | 2.45e-16b | 3.50e-15b | 4.52 | 4.28 | |
| 01077-1707 | 1.16e-14a | 9.90e-14a | 3.03 | 2.97 | |
| 02411+0354NE | 8.00e-16b | 4.20e-15b | 1.62 | 4.33 | |
| 02411+0354SW | 1.10e-15b | 7.60e-15b | 2.41 | 1.24 | |
| 06206-6315 | 2.60e-16c | 6.31e-15c | 6.05 | 3.25 | |
| 20100-4156S | 1.86e-15c | 1.61e-14c | 3.06 | 1.91 | |
| 22206-2715 | 8.96e-16b | 6.40e-15b | 2.51 | 0.75 | |
| 22491-1808 | 3.15e-15b | 2.30e-14b | 2.57 | 0.40 | |
| 23128-5919 | 8.86e-15c | 8.29e-14c | 3.29 | 4.11 | |
| 23230-6926 | 1.08e-15c | 1.35e-14c | 4.13 | 2.39 | |
| 23389-6139 | 3.40e-16c | 2.26e-14c | 8.96 | 1.68 | |
| IRAS name | L(Pa) | SFR(Pa) | L(Br) | SFR(Br) | L(IR) | log | SFR(IR) | Line/IR |
|---|---|---|---|---|---|---|---|---|
| [1041erg s-1] | [Myr-1] | [1041erg s-1] | [Myr-1] | [1045erg s-1] | (LIR/L | [Myr-1] | ||
| 00085-1223 | 4.05 | 26.7 | 1.08 | 11.45 | 49.9 | 0.54 | ||
| 00188-0856 | 9.1 | 48.1 | 12.32 | 12.51 | 570.5 | 0.08 | ||
| 00582-0258 | 0.47 | 2.4 | 2.22 | 11.76 | 102.7 | 0.02 | ||
| 01077-1707 | 8.22 | 54.2 | 1.92 | 11.70 | 89.1 | 0.61 | ||
| 02411+0354 | 13.22 | 66.9 | 6.83 | 12.25 | 316.2 | 0.21 | ||
| 02411+0354NE | 10.17 | 51.5 | ||||||
| 02411+0354SW | 3.04 | 15.4 | ||||||
| 06206-6315 | 8.78 | 44.4 | 7.73 | 12.30 | 357.9 | 0.12 | ||
| 19335-3632 | 3.20 | 16.2 | 1.87 | 11.69 | 86.6 | 0.19 | ||
| 20100-4156 | 12.00 | 60.7 | 20.59 | 12.73 | 953.1 | 0.06 | ||
| 20100-4156S | 9.08 | 45.9 | ||||||
| 20100-4156N | 2.92 | 14.8 | ||||||
| 22206-2715 | 6.54 | 33.1 | 6.49 | 12.23 | 300.4 | 0.11 | ||
| 22491-1808 | 6.38 | 32.3 | 7.13 | 12.27 | 330.1 | 0.10 | ||
| 23128-5919 | 16.68 | 110.14 | 3.71 | 11.99 | 171.8 | 0.64 | ||
| 23230-6926 | 15.01 | 75.9 | 9.29 | 12.38 | 430.0 | 0.18 | ||
| 23389-6139 | 15.42 | 78.0 | 7.11 | 12.27 | 329.0 | 0.24 |
Pa luminosities for IRAS00582-0258, IRAS19335-3632 and IRAS20100-4156N are not extinction corrected, and the SFRs are only lower limits.
4 Discussion
In all the observed galaxies the Pa or Br flux, even corrected for aperture effects and extinction derived from NIR optical recombination lines (Table 5), is significantly less than that expected from a starburst of corresponding bolometric luminosity. A similar ”deficit” of recombination photons has already been noticed by Goldader et al. (1995), based on the analysis of the Br line in a sample of local ULIRGs.
Poggianti, Bressan & Franceschini (pogg (2001)) have found that the SFR derived from the extinction corrected intensity of H in a sample of ULIRGs was a factor of three less than that derived from the FIR luminosity. They attributed the discrepancy to an age-selective extinction effect where a substantial young population was essentially escaping the optical detection. On the contrary, in a recent analysis of lower infrared luminosity starburst galaxies (10 log(L11) Mayya et al.(mayya (2004)) have not found strong evidence for a loss of optical photons.
We discuss below several possible explanations of the differences between the SFR (and/or attenuation) derived from the emission lines and from the IR emission.
4.1 The AGN contribution
The first and most obvious cause for the photon deficit is that a significant contribution to the infrared emission comes from an AGN. There is evidence that in the most luminous nearby infrared galaxies a significant fraction of the luminosity could arise in principle from an AGN instead of the starburst, as suggested by some optical (Veilleux et al. Veil95 (1995)), NIR (Veilleux, Sanders & Kim, veil99 (1999)) and ISO ( Tran et al. Tran2001 (2001)) spectroscopic studies of ULIRGs.
To explain the observed large discrepancy, the AGN should provide a conspicuous fraction of the IR luminosity, generally exceeding 80%.
As already anticipated we have possibly detected broad emission line components and [SiVI] emission only in IRAS 00188-0856 and IRAS 00582-0258.
It is interesting to note that, in the IR colour-luminosity diagram (Neff & Hutchings neff (1992)), both IRAS 00188-0856 with log(S25μm/S60μm)=0.63 and log(L 60μm/L⊙)=12.05, and IRAS 00582-0258 with log(S 25μm/S60μm)= 0.55 and log(L 60μm/L⊙)=11.24, fall in the region of overlap between QSO and Seyfert 1 galaxies.
The presence of a broad component (FWHM2000 km/s) in the Pa line, the possible detection of the high excitation [SiVI] line, and their position in the IR colour-luminosity diagram, favour the existence of an obscured AGN in IRAS 00188-0856 and IRAS 00582-0258.
4.1.1 Other diagnostics for unveiling the AGN
Hints on the nature of the IR luminosity may come also from other wavelength observations.
In star forming galaxies, FIR and radio emissions are tightly correlated over a wide range of IR luminosities. Sanders & Mirabel (sand1 (1996)) report:
| (1) |
where FFIR=1.2610-14(2.58 + ) , with and expressed in Jy. Radio observations of all our target objects have been reported in Table 1. After extrapolating a few 843MHz data to 1.4GHz by assuming a radio slope Fν , we have evaluated the q parameter, reported in Table 1.
All the objects, including IRAS00188-0856 and IRAS00582-0258, but IRAS22491-1808 and IRAS23389-6139, fall on top of the FIR-radio relation of starburst galaxies. Panuzzo et al. (pan03 (2003)) have shown that in normal star-forming galaxies the radio luminosity is an excellent indicator of star formation and that deviations from this relation are due to variations of the corresponding FIR luminosity as the latter depend more on the details of the obscuration. In contrast, in a very young obscured starburst there is an excess of FIR emission because core collapsed supernovae, thought to provide the 90% of radio emission, have a delay of a few million years. For the same reason, if the starburst is in a late phase and the star formation decreased exponentially, there is an excess of radio emission (Bressan, Silva & Granato bress01 (2001)).
Based on different arguments, Smith et al. (sm98 (1998)), Farrah et al. (Farrah (2003)) and Prouton et al. (prout04 (2004)), have shown that the contribution of the putative AGN to the radio luminosity in obscured starbursts (not harbouring radio-loud sources) is low. Thus a significant contribution to the IR from the AGN would significantly raise the value of q above the FIR-radio correlation. This might be particularly relevant for IRAS00188-0856 and IRAS 00582-0258 where, as we have already seen, there are hints for the presence of the AGN from our own observations, but in fact these galaxies show a q parameter typical of starbursts indicating that the contribution of the AGN in the IR is not high.
Another diagnostic for the presence of the AGN is a low value of the ratio of the line to continuum emission of the 7.7 m PAH feature, as measured by ISO spectroscopy (Lutz et al. Lutz98 (1998)). Unfortunately, not all our galaxies have this ratio measured. Following this indicator (Table 1), three sources could harbour an obscured AGN, IRAS 00188-0856, IRAS 23230-6926 and IRAS 23389- 6139. However only the first source shows evidence for an AGN from our NIR observations. This may give further support to criticism on the use of this indicator recently raised by Farrah et al. (Farrah (2003)) (but see also Prouton et al. prout04 (2004)).
There are also XMM-Newton hard X-ray observations for IRAS 20100-4156 (Franceschini et al. frabra (2003)). IRAS 20100-4156 shows a faint X-ray flux of S(2-10 keV) 1.9 10-14 erg s-1cm-2, with a (2-10Kev)/(8-1000m) flux ratio 4.75 10-5. Unfortunately, its large distance and consequent poor X-ray photon statistics prevented any careful X-ray spectral analyses. Although the total source flux is slightly above that expected from a starburst of similar FIR power (Franceschini et al. frabra (2003)), there is no definite evidence, from hard X-rays, that the galaxy hosts an absorbed AGN. For instance MKN231, a typical Sy1 galaxy, is about 34 times brighter, between 2 and 10 keV, than IRAS 20100-4156, in spite of having about the same IR luminosity.
In summary, from our own observations and other collected data in the literature we may conclude that IRAS 00188-0856 and IRAS 00582-0258 could harbour an AGN. However in all cases the contribution of the AGN to the IR seems not at the level required to explain the discrepancy between line flux and FIR emission. Indeed the first evidence of a buried AGN in the ultraluminous galaxy UGC 5101, provided by SPITZER, allows a contribution to the total luminosity of only 10% (Armus et al. armus04 (2004)).
4.2 High NIR extinction
Another alternative to explain the photon recombination deficit is simply that the extinction is very high, even at NIR wavelengths, and that what we see from optical lines is only the external skin of the starburst.
To evaluate the possible range of that kind of extinction we have compared the observed values of the Pa/IR (or Br/IR) ratio with that predicted by models of normal star- forming galaxies. In this way we will obtain the excess extinction over that of a normal star forming galaxy. From Panuzzo et al. (pan03 (2003)) we get the following average relations between line and IR (8m– 1000m) emission:
S(H)/S(IR)=6.5610-3,
S(Pa)/S(IR)=7.910-4, and
S(Br)/S(IR)=6.3210-5
The observed values of S(Pa)/S(IR) or S(Br)/S(IR) are reported in Table 7. The observed intensities of the emission lines have been corrected for slit losses by multiplying by the factor CIR of Table 4. The average value of the observed S(Pa)/S(IR) ratios is 10% of that predicted by the models while, in the case of Br line, it is 40% of the predicted value.
Assuming that the difference with respect to the models is entirely due to an extinction larger than in the case of a normal star forming galaxy, we have derived the corresponding attenuation in magnitudes, in the line and in the visual. The values of AV must be considered as in excess of that of normal star forming galaxies which is typically A1 mag. In this way we obtain an average attenuation at Pa of about 2.9 mags, corresponding to an average visual attenuation of about 20 mags. These values are much higher than those derived from optical emission lines (cfr. Table 5). Values of A5-50 have been already found by Genzel at al. (1998) from mid-infrared spectroscopy of a small sample of ULIRGs and are confirmed by recent SPITZER observations of selected ULIRGs ( Armus et al. armus04 (2004)). High optical depths (20) at 1m have been also inferred from fitting the far infrared to radio SEDs of a sample of compact ULIRGs (Prouton et al. prout04 (2004)).
| IRAS name | Line/IR | Obs/Modela | A(line) | A |
|---|---|---|---|---|
| Pa | ||||
| 00188-0856 | 2.73E-05 | 3.45E-02 | 3.65 | 24.9 |
| 00582-0258 | 2.13E-05 | 2.70E-02 | 3.92 | 26.7 |
| 02411+0354 | 1.42E-04 | 1.80E-01 | 1.86 | 12.7 |
| 06206-6315 | 3.97E-05 | 5.03E-02 | 3.25 | 22.1 |
| 19335-3632 | 1.72E-04 | 2.18E-01 | 1.65 | 11.2 |
| 20100-4156 | 4.01E-05 | 5.08E-02 | 3.23 | 22.0 |
| 22206-2715 | 6.53E-05 | 8.27E-02 | 2.71 | 18.4 |
| 22491-1808 | 5.73E-05 | 7.25E-02 | 2.85 | 19.4 |
| 23230-6926 | 7.86E-05 | 9.95E-02 | 2.51 | 17.0 |
| 23389-6139 | 4.56E-05 | 5.78E-02 | 3.10 | 21.1 |
| Br | ||||
| 00085-1223 | 1.88E-05 | 2.98E-01 | 1.31 | 13.5 |
| 01077-1707 | 3.02E-05 | 4.77E-01 | 0.80 | 8.3 |
| 23128-5919 | 3.08E-05 | 4.88E-01 | 0.78 | 8.0 |
a) Observed L(Pa)/IR = 7.9E-4 and L(Br)/IR = 6.3E-5,
for a normal star forming galaxy (Panuzzo et al. 2003)
b) APaα/AV=0.147 and ABrγ/AV=0.097 from
Calzetti et al. (2000)
We also notice that, in the case of Pa galaxies, even assuming an AGN contribution to the IR of the order of 50% (which is large, following Prouton et al. prout04 (2004)), the visual attenuation would still remain between 15 and 25 mags.
As a second point, we notice that in the galaxies observed in the Br domain the extinction is lower than that obtained for the sample with Pa in agreement with a slab attenuated model. In fact, for such a model we expect A(Br)0.66 A(Pa) (Calzetti et al. 2000). The average extinction of the Br sample is A(Br)0.96, while taht of the Pa sample is A(Pa)2.9, with a ratio of 0.33. Though we are comparing different galaxies and the statistics is low (but notice that our Br galaxies lie on the relation defined by the more exhaustive sample of Goldader et al. 1997), this may indicate that the photon deficit is wavelength dependent, an thus favour the effects of a complex extinction geometry over those of absorption by dust within HII regions, discussed below.
4.3 Dust within the HII regions
In presence of dust within the ionized regions of the starburst, only a fraction of Ly-continuum photons may effectively ionize the gas, while the remaining (1-) is absorbed. This effect causes a deficit of recombination photons, with respect to the FIR emission. To explain the observed discrepancy between NIR line emission and IR flux, dust within HII regions should absorb about 80% of the ionizing flux.
Dust absorption within HII regions has been invoked by Hirashita et al. (Hira (2003)) to explain the anomalous H to UV flux, observed in a sample of IUE selected star forming galaxies. Hirashita et al. (Hira (2003)) have estimated an average value of (1-)50%, with some objects reaching (1-) 80%. However, it is worth recalling that the conclusions reached by Hirashita et al. (Hira (2003)) are based on a single screen extinction model. By analyzing the same data, Panuzzo et al. (pan03 (2003)) have instead found that this effect may result from “age-selective” extinction, namely that younger populations are more extinguished than older ones, the latter still contributing to the UV flux but not to nebular emission.
Dust within ionized regions has been indicated also by Luhman et al. (2003) as a possibility to explain the [CII] deficit relative to FIR, observed in their sample of ULIRGs. In fact dust would not only affect the pool of ionizing photons, but would also inhibit the penetration of 13.6eV6eV photons (thought to be responsible of the [CII] excitation) in the photo-dissociation regions, while preserving the overall FIR emission.
If confirmed by further studies, a 80% depression of the ionizing flux would deeply challenge any determination of SFR from even the less extinguished emission lines.
4.4 Age of the starbursts
Estimators of the SFR are usually derived assuming a continuous star formation rate. This is essentially correct when dealing with normal galaxies, but starburst galaxies are, by definition, currently dominated by a single episode, with a duration which is generally comparable to the characteristic times of the star formation indicators. In such circumstances the use of different calibrators may lead to significant discrepancies. For instance, this may be the case of the Radio and IR SFR indicators, as discussed by Bressan, Silva & Granato (bress02 (2002)).
To get hints on the evolutionary status of our galaxies we have analyzed the equivalent widths (EW) of hydrogen emission lines (see e.g. Terlevich et al. 2004). These indicators are relatively unaffected by dust extinction in at least two cases, namely when both continuum and line emission arise from the same population, or when attenuation can be approximated by an inter vening absorbing slab. In the latter case however, the equivalent width may be affected by the presence of the old population, outside the starburst region.

Figure 6 compares the observed Pa and Br equivalent widths of our galaxies with those predicted by starburst models. The models have been constructed by adding nebular emission to the spectral energy distribution of simple stellar populations of solar metallicity, as described in Bressan, Poggianti & Franceschini (bress01 (2001)). The adopted star formation e-folding time is =25, but since we are interested in the ratio between the age of the starburst and the e-folding time, our conclusions do not change significantly by assuming other plausible values for .
From Figure 6, we observe a lack of young objects, with only one source, IRAS 23128-5919, appearing younger than twice the SFR e-folding time. The other galaxies have ages that are either between two and three times the SFR e-folding time, or around four times the e-folding time. Taken at face value, these estimates would place IRAS 00188-0856, IRAS 00582-0258, IRAS 06206-6315 and IRAS 22206-2715NE in a post-starburst phase. Part of the photon deficit discrepancy could then originate simply from our use of stationary models. However, given the high current IR luminosity of the latter galaxies, their bolometric luminosity at the peak SFR would have been unreasonably large, between 31013L⊙ and 21014L⊙.
It is worth noticing that, being the average distance of the Pa sample about four times that of the Br sample, our slit is sampling an intrinsic galaxy area which increases by at least one order of magnitude going from the Br sample to the Pa sample. In spite of that, both the equivalent width of the lines and the corresponding SFR show a comparable distribution in the two samples (though the Br sample is not statistically significant). This not only suggests that the line emission originates from the central regions, but also indicates that the equivalent widths are dominated by sources that share the same spatial distribution. For instance, they should not be significantly affected by an underlying old population, as expected in vigorous starbursts (Mayya et al. mayya (2004)).
We conclude that the observed distribution of EWs, skewed toward old ages, is actually another aspect of the photon deficit problem, independent from bolometric luminosity considerations. Unfortunately a statistical argument based on the distribution of EWs cannot help to discriminate between the different causes. In fact, strong age selective extinction could make the starburst to appear older than it is; absorption of ionizing photons could diminish the equivalent width, because the K band continuum of the ionizing cluster would suffer much less attenuation; and finally the K-band continuum could be dominated by the presence of an AGN, still compatible with the FIR/Radio correlation (Prouton et al. 2004).
5 Conclusions and Perspectives
We have obtained NIR medium dispersion long slit spectroscopy with SOFI at NTT of ten luminous infrared galaxies having suitable redshift to push their Pa emission in the Ks band. We included also three objects with lower redshift, for which the Br line was in the Ks band.
We have found that the Pa emission, even corrected for slit losses and for extinction estimated by comparing our data with optical spectroscopy, is significantly less than that expected from a starburst of corresponding bolometric luminosity. The discrepancy is lower for the galaxies observed in the Br region, but in general we confirm the existence of a deficit of recombination photons first pointed out in ULIRGs by Goldader et al. (gold95 (1995)).
Furthermore, in IRAS 00188-0856 and IRAS 00582-0258 we find evidence for significant broadening of the Pa line and for the presence of [SiVI] coronal line. However these two galaxies fall on top of the FIR/Radio correlation, indicating that, though present, the AGN does not dominate the far infrared emission. For all other sources we do not find evidence of AGN contribution and we argue that the studied galaxies appear to be predominantly powered by a nuclear starburst.
Based on current data alone it is impossible to disclose the origin of the recombination photon deficit, and we may only advance the following hints.
The galaxies may harbour a highly attenuated star forming region. In this case an estimate of the attenuation can be obtained from the comparison the observed line/IR emission ratio with the predictions of models for normal star-forming galaxies. Then the average attenuation would be A10-25mag and A2-4mag. These figures are slightly lower when derived from the Br/IR ratio (A 1mags) and are consistent with the decrement of attenuation going from Pa to the Br wavelength region. A significant attenuation of the nuclear star forming region even in the NIR comes out to be in agreement with the large molecular cloud optical depths ( 20), derived by Prouton et al. (prout04 (2004)) from SED fitting of compact ULIRGs. It is also in agreement with recent SPITZER observations of ultra luminous galaxies with buried AGN (Armus et al. 2004). Assuming that the AGN may contribute about 50% of the IR flux (a quite extreme figure, Prouton et al. prout04 (2004)), would imply only a slightly smaller attenuation.
Our finding is also compatible with a scenario where a large fraction (80%) of the ionizing flux is absorbed by dust within the HII regions. The required fraction is large but comparable with some extreme values found by Hirashita et al. (Hira (2003)) in their analysis of a sample of UV selected starbursts. This effect has been recently invoked as one of the possible causes of the [CII] emission deficit relative to FIR observed in some ULIRGs (Luhman et al. 2003 ). Based on MIR to radio SED fitting, Prouton et al. (prout04 (2004)) have estimated that the dust sublimation radius within molecular clouds in compact ULIRGs, is generally a fraction of a parsec. Dust may thus survive even in the innermost regions of an HII region and, if such a strong effect is confirmed, it will challenge our ability to derive SFR and/or to study inner environmental conditions, from even the most un-extinguished emission lines.
Though the above alternative scenarios are both compatible with the present data, their predictions at longer wavelengths are markedly different and suggest that a decisive test to disentangle between high nuclear obscuration and dust absorption within HII regions, would be to look at the Br 4.05 m line emission. In fact, assuming the Calzetti et al. (2000) extinction law and an intrinsic ratio L( Pa)/L(Br)3.9 (Panuzzo et al. pan03 (2003)) we get
Thus if the Pa deficit is due to absorption of ionizing photons by dust within HII region and AV3 mag, as derived from optical and NIR-optical emission line ratios, then the expected ratio L(Br)/L(Pa) is 0.34. On the other hand, if the Pa emission comes from a dust enshrouded region with say AV20 mag, then L(Br)/L(Pa) 1.6, a factor about five times larger than in the previous case.
Acknowledgements.
We tank the anonymous referee for her/his comments and suggestions and M. Clemens for discussions and careful reading of the manuscript. A.B. acknowledges warm hospitality by INAOE and J.R.V. acknowledges warm hospitality by INAF, Osservatorio Astronomico di Padova. S.B. acknowledges support by ASI research grant no. I/R/062/02. This research was partially supported by the European Commission Research Training Network ‘POE’ under contract HPRN-CT-2000-00138 and by MURST under COFIN n. 2001/021149References
- (1) Armus, L.; et al. 2004, AAS, 204, 3319
- (2) Barger, A. J., Cowie, L. L. & Richards, E. A. 2000, AJ, 119, 209.
- (3) Berta, S., Fritz, J., Franceschini, A., Bressan, A. & Pernechele, C.: 2003, A&A, 403, 119.
- (4) Bressan, A., Silva, L., & Granato, G. L. 2002, A&A, 392, 377
- (5) Bressan, A., Poggianti, B., & Franceschini, A. 2001, QSO Hosts and Their Environments, 171
- (6) Bressan, A., Chiosi, C., Fagotto, F. 1994, ApJS, 94, 63
- (7) Bushouse, H.A., Borne, K.D., Colina, L., Lucas, R.A., Rowan-Robinson, M., Baker, A.C., Clements, D.L., Lawrence, A., Oliver, S., 2002, ApJSS, 138, 1
- (8) Calzetti, D., Armus, L., Bohlin, R. C., Kinney, A. L., Koornneef, J., & Storchi-Bergmann, T. 2000, ApJ, 533, 682
- (9) Condon, J. J., Helou, G., Sanders, D. B., & Soifer, B. T. 1996, ApJS, 103, 81
- (10) Condon, J. J.; Cotton, W. D.; Greisen, E. W.; Yin, Q. F.; Perley, R. A.; Taylor, G. B.; Broderick, J. J., 1998, AJ, 115, 1693
- (11) Duc, P.-A., Mirabel, I. F. & Maza, J. 1997, A&AS, 124, 533
- (12) Elbaz, D., Cesarsky, C.J., Fadda, D., et al. 1999, A&A, 351, 37
- (13) Farrah, D., Afonso, V., Efstathiou, A., Rowan-Robinson, M. ,Fox, M., Clements, D., 2003, MNRAS, 343, 585
- (14) Ferland, G. J. 2003, ARA&A, 41, 517
- (15) Fisher, K.B., et al. , 1995, ApJS, 100, 69
- (16) Franceschini A., Aussel H., Cesarsky C., Elbaz D., Fadda D.: A&A, 2001, 378, 1.
- (17) Franceschini, A., Braito, V.,Persic, M. et al. 2003, MNRAS, 343, 1181
- (18) Gear, W. K., Lilly, S. J., Stevens, J. A., Clements, D. L., Webb, T. M., Eales, S. A., & Dunne, L. 2000, MNRAS, 316, L51
- (19) Genzel, R., Lutz, D., Sturm, E., et al. 1998, ApJ, 498, 579
- (20) Goldader, J. D.; Joseph, R. D.; Doyon, R.; Sanders, D. B. 1997, ApJS, 108, 449
- (21) Goldader, J. D., Joseph, R. D., Doyon, R.; Sanders, D. B. 1995, ApJ, 444, 97
- (22) Granato, G.L., Lacey, C.G., Silva, L., Bressan, A., Baugh, C.M., Cole, S., Frenk, C.S. 2000, ApJ, 542, 710
- (23) Hirashita, H., Buat, V., Inoue, A. K., 2003, A&A, 410, 83
- (24) Hummer, D. G.; Storey, P. J. 1987, MNRAS, 224, 801
- (25) Ivison, R. J. et al. 2002, MNRAS, 337, 1
- (26) Kennicutt, R.C. 1998, ARAA, 36, 189
- (27) Kim, A. G., Gabi, S., Goldhaber, G., et al. 1997, ApJ, 476, L63
- (28) Luhman, M.L., et al. , 2003, ApJ, 594, 758
- (29) Lutz, D., Spoon, H. W. W., Rigopoulou, D., Moorwood, A. F. M., & Genzel, R. 1998, ApJ, 505, L103
- (30) Mauch, T.; Murphy, T.; Buttery, H. J.; Curran, J.; Hunstead, R. W.; Piestrzynski, B.; Robertson, J. G.; Sadler, E. M., 2003, MNRAS, 342, 1117
- (31) Mayya, Y.D., Bressan, A., Rodriguez, M., Valdes, J.R., Chavez, M., 2004, ApJ, 600, 188
- (32) Moorwood A., Cuby J.G. & Lidman C. 1998, The Messenger 91, 9
- (33) Neff, S. G., Hutchings, J. B., 1992, AJ, 103, 1746
- (34) Panuzzo, P., Bressan, A., Granato, G. L., Silva, L., & Danese, L. 2003, A&A, 409, 99
- (35) Pernechele, C., Berta, S., Marconi, A., Bonoli, C., Bressan, A., Franceschini, A., Fritz, J., & Giro, E. 2003, MNRAS, 338, L13
- (36) Pickles, A.J. 1998, PASP, 110, 863
- (37) Poggianti, B. M., Bressan, A., & Franceschini, A., 2001, ApJ, 550, 195
- (38) Prouton, O. R.; Bressan, A.; Clemens, M.; Franceschini, A.; Granato, G. L.; Silva, L. 2004, A&A, 421, 115
- (39) Rigopoulou, D., Spoon, H. W. W., Genzel, R., Lutz, D., Moorwood, A. F. M., & Tran, Q. D. 1999, AJ, 118, 2625
- (40) Sanders, D. B. & Mirabel, I.F. 1996, ARAA, 34, 7479
- (41) Silva, L., Granto, G.L., Bressan, A., Danese, L. 1998, ApJ, 509, 103
- (42) Smail, I., Ivison, R.J., Owen, F.N., et al. 2000, ApJ, 528, 612
- (43) Smail, I., Ivison, R. J., Gilbank, D. G., Dunlop, J. S., Keel, W. C., Motohara, K., & Stevens, J. A. 2003, ApJ, 583, 551
- (44) Smith, H.E.; Lonsdale, C.J.; Lonsdale, C.J. 1998, A&A, 492,137
- (45) Stevens, J. A. et al. 2003, NATURE, 425, 264
- (46) Tran Q. D., et al, 2001, ApJ, 552, 527
- (47) Terlevich, R., Silich, S., Rosa-González, D., & Terlevich, E. 2004, MNRAS, 348, 1191
- (48) Vanzi, L., Bagnulo, S., Le Floc’h, E., Maiolino, R., Pompei, E., Walsh, W., 2002, A&A, 386, 464
- (49) Veilleux, S., Kim, D.-C., & Sanders, D. B., 1999, ApJ, 522, 113
- (50) Veilleux, S., Sanders, D. B., & Kim, D.-C., 1999, ApJ, 522, 139
- (51) Veilleux S., Kim, D.-C., Sanders D. B., Mazzarella J. M., Soifer B. T., 1995, ApJS, 98, 171
- (52) Zenner, S., Lenzen, R., 1993, A&ASS, 101, 363