VLBI-experiments on research of solar wind plasma
Abstract
This work devotes to investigations of solar corona and solar wind plasma by the method of radio probing with using of very long baseline interferometry (VLBI). We performed the theoretical calculation of power spectrum of interferometric response to radio source emission, passed through the turbulent medium. Data of theoretical analysis are compared with results of international VLBI experiments on investigations of solar wind plasma. The observations were realized in 1998, 1999, 2000 with participation of radio telescopes, included at Low Frequency VLBI Network (LFVN): Bear Lakes (RT-64, Russia), Puschino (RT-22, Russia), Urumqi (RT-25, China), Noto (RT-32, Italy), Shanghai (RT-25, China) and others. Preprocessing was carried out with using of S2 correlator at Penticton (Canada). Post processing of experimental data was performed at RRI (Russia) and was aimed to obtain value of solar wind velocity and index of spatial spectrum of electron density fluctuations.
1 Introduction
One of the most important problem of solar-terrestrial physics is the investigation of coronal plasma — the determination of physical parameters of electron density irregularities and their spatial-temporal structure. The method of radio sounding is widely applied for investigation of coronal plasma and solar wind. In this method the signal from the radio source goes through the turbulent medium and then is received at ground-based radiotelescope. Heterogeneous mediums cause phase, amplitude and frequency fluctuations of the received emission and distort the output signal of the instrument. The analysis of these disturbances allows one to get information on physical characteristics of the propagation medium.
Perspective technique in this field proves to be interferometry method [Altunin et all, 2000, Girin et all, 1999, Spangler S. R. et all, 2002], when sounding signals are propagated through circumsolar plasma by different paths and received at separated antennas of VLBI-complexes. A very long baseline interferometer permits studying the electron-density irregularities using relative phase, amplitude, and frequency fluctuations originating on propagation paths from the source to the receiving antennas of the interferometer. Moreover the size of the baseline projection of the instrument to the wave front determines the scale of irregularities (100–10000 km), interferometer being sensitive to them. Using of interferometric complexes with various orientation of baseline projections allows to obtain information about spatial structure of solar wind plasma parameters. The observations of sources, located at different positional angles and distances from the Sun, let us make certain conclusions about the spatial structure and anisotropy of electron density of investigated medium. The radiointerferometric method allows for obtaining data by receiving both monochromatic signals from spacecraft and wideband emission from natural radio sources.
In recent years, a number of VLBI-experiments connected with the investigation of solar wind plasma by the method of radio sounding has been carried out at Low Frequency VLBI Network (LFVN).
We performed theoretical analysis of power spectrum of interferometric response to radio source emission, passed through the turbulent medium [Gavrilenko et all, 2002, Alimov et all, 2004]. The conclusions were compared with experimental data having for an object to get information about physical characteristics of propagation medium, namely, solar wind velocity and spectral index.
2 Frequency spectrum of the interferometer response to wideband emission under conditions of an inhomogeneous medium
The purpose of current work is to obtain theoretical formulas describing the response of an interferometer to the radio emission from the source, which propagated through a turbulent medium, to simulate VLBI experiments on radio raying of the solar wind, and to compare the calculation results with the experimental data.
We analyzed the situation, when the noise emission of a cosmic radio source passes along axis through the turbulent medium of solar wind with chaotic large scale irregularities of electron density. Then it is received by a two-element ground radio interferometer on plane , which is perpendicular to the direction of propagation.
The signals received at separated antennas having been transformed in the tracts of the interferometer, undergo mutual correlation processing. The power spectrum of signals at the output of the interferometer’s correlator, having information about the propagation medium, can be represented in following way:
| (1) |
where
| (2) |
— the correlation function of the interferometer’s output signal, — the signals at the outputs of the receiving tracts of the interferometer, — the complex function of amplitude and phase fluctuations, caused by the turbulence, — the baseline of the interferometer, — the frequency of Fourier-analysis.
Expression (2) is described the correlation procedure, common for interferometer reception. It has some advantages in comparison with traditional one point receiving as it allows to investigate the field fluctuations caused by turbulent medium only on two different propagation paths. In this case the influence of source self-radiation is excluded and it allows us to sound the medium not only by monochromatic but also wideband source signal. It proves to be very important when the later is raying by sound emission of natural sources.
In this work the theoretical calculation of the power spectrum of the interferometer’s output signal is performed. The distribution of field fluctuations was carried out with geometric-optical approach. It was supposed, that the temporal changes of the electromagnetic field parameters in the solar corona concern the “frozen-in” hypothesis — when the irregularities move from the Sun in radial direction at the velocity of solar wind . The spatial spectrum of fluctuations of turbulence parameters was described by a power law function at the wave number range , , ( and — are outer and inner scale of turbulence respectively):
| (3) |
— the structural coefficient, determining the intensity of fluctuations.
The spectral index is usually considered to be equal to (Kolmogorov’s spectrum) at distances from the Sun more than ( — radius of the Sun) and it is decreased to at shorter distances. Index is the characteristics of the turbulent medium being investigated, which is determined from the spectrum of the interferometer’s output signal.
The expression for correlation function, considering the amplitude and phase fluctuations, has a form:
| (4) | |||||
, — plasma frequency, — velocity of light, , , — projections of wavenumber, baseline and solar wind velociy on the plane of the sky, — the central frequency of the reception, — electron density, — the thickness of irregularities’ layer.
We examine two limit cases: strong and weak phase fluctuations. In case of strong phase fluctuations, the expression for can be written as follows:
| (5) |
| (6) |
| (7) |
| (8) |
In (5)–(8) the cross baseline projection is directed along the axis ; , — Bessel function. It is evident, that in case of strong phase fluctuations, the power spectrum of the output signal has the form of Gaussian function independently of the choice of the spatial spectrum’s type . Value described the intensity of phase fluctuations.
The analysis confirms, that solar wind observations proved to be more informative at weak phase fluctuations. In this case the form the power spectrum must be drop-down power law function. When stream velocity is directed along baseline (, ) dependence of spectrum from baseline and solar wind velocity is described approximately by the expression:
| (9) |
( — constant coefficient, (9) — is received under the condition: ).
The function describing the spectrum is represented in fig. 1 in logarithmic scale; the dimensionless value is marked along the abscissa axis ().
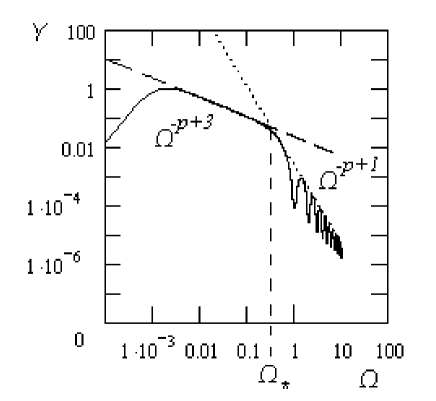
It follows from (9) that the spectrum should have oscillations determined by the factor and dependent only on the relationship between the solar-wind velocity and the interferometer baseline. This makes it possible to determine the velocity of irregularity transport on the sounding path.
Two characteristic intervals can be distinguished for this curve. The corresponding frequency dependences are described by the next approximation:
| (10) |
| (11) |
Therefore, the index of the spatial spectrum of fluctuations of medium parameters can be determined from the slopes of the curve. Approximating curves (10) and (11) intersect at some point from which one can determine the solar-wind velocity if is known.
If the interferometer baseline is perpendicular to the drift velocity of irregularities of the medium , then (9) yields
| (12) |
| (13) |
In this case, as well, the spectral index can also be determined from the asymptotic dependence of the measured frequency spectrum, while the solar wind velocity can be determined from the characteristic frequency at the break point of measured spectrum .
3 Results of experiments
We carried out the analysis of international VLBI experiments on investigations of solar wind plasma, implemented in 1998, 1999, 2000. These observations were realized with participation of radio telescopes, included at Low Frequency VLBI Network: Bear Lakes (RT-64, Russia), Puschino (RT-22, Russia), Hartebeesthock (RT-25, South Africa), Arecibo (RT-305, USA), Urumqi (RT-25, China), Noto (RT-32, Italy), Shanghai (RT-25, China), GMRT (RT-45, India). At the course of these experiments VLBI complex received the extragalactic source radio emission (wavelength 18 cm) passed through the turbulent plasma of solar wind. Radio sources were located at different angular distances from the Sun (4-37 degrees). The observational information were recorded using the S2 system. Preprocessing of VLBI-data was carried out at S2-correlator at Penticton (Canada). The data were calibrated in the NRAO AIPS package using the standard technique.
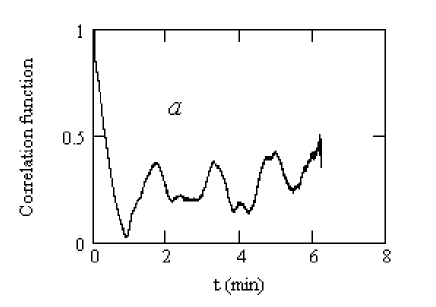
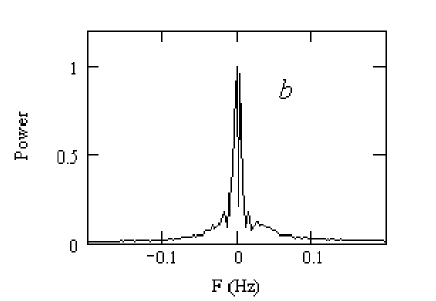
Postprocessing was performed at RRI (Russia) and was aimed to obtain value of solar wind velocity and index of spatial spectrum of electron density fluctuations. The autocorrelation function of output signal was counted. After that Fourie-analysis was performed; as a result we have the power spectrum of field of interferometer signal. The examples of the autocorrelation function and spectrum taken in the course of experiments are shown at fig. 2.
The results of spectral analysis of realization series were compared with theoretical conclusions. Obtained experimental power spectra let us to get estimations of index of spatial spectrum according slope of the spectrums. During observations took on a value 3.2–4.5 depending on the angular distances of radio sources to the Sun.
The determination of solar wind velocity were embarrassed by the several reasons. The most part of experimental data was correlated with too large integration time s). This circumstance did not allow to get output spectrum in sufficient wide band, where desired feature of spectrum is located. Reiteration of preprocessing with integration time s, before activity correlator was stopped, has been implemented for sources, observed at experiment INTAS99.4 in 1999, November.
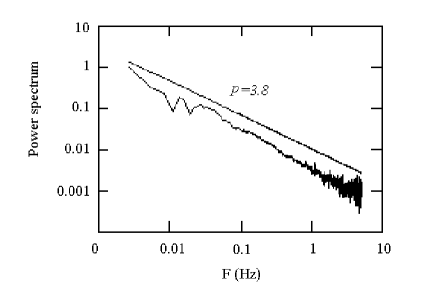
Strong response was obtained only for one source NRAO530, located at angular distance from the Sun degrees. Positions of other sources, coming for solar wind observations, were too close to Sun and their signal-to-noise relation was too low, that does not allow to obtain distinct spectrums. The sample of power spectrum for source NRAO530 is displayed on fig.3 (baseline Bear Lakes (RT-64, Russia) — Noto (RT-32, Italy), wavelength 18cm, integration time sec, 4 December, 1999). The baseline projection was directed mainly along velocity of irregularities transfering. The conditions of it’s observations corresponded to the case of weak phase fluctuations. Spectral index , evaluated on the slope of power spectrum, is equal to 3.8.
As stated above, proposed method theoretically may be used for calculation of solar wind velocity. The expression (9) shows, that must be oscillations on spectrum wings. They depend on relation of velocity and baseline. Experimental spectrum does not demonstrate distinct oscillations. Supposed, velocity fluctuations at solar wind were significant, and provoked the smoothing of minimums and rendered impossible to evaluation of velocity. The break point of measured spectrum could not be clear distinguished at this graph. Further theoretical and experimental testing is need for adjusting of procedure for solar wind velocity evaluation.
4 Conclusions
We performed the theoretical analysis of interferometer response on radio emission propagated through the coronal plasma. The power spectrum of field fluctuations was obtained using the approach of “frozen-in” hypothesis for two cases: strong and weak phase fluctuation. It was showed that data on the propagation medium can be received at sounding of media by monochromatic signals from spacecrafts, as well as wideband emission from natural radio sources.
The theoretical analysis has demonstrated that interferometer’s signal carries information about spatial spectrum of electron density distribution, intensity of phase fluctuations and solar wind velocity.
Experimental works are satisfactory corresponded with conclusions of theoretical analysis as regards to determination of spectral index. Nevertheless determination of average velocity of irregularities transportation is embarrassed by weak source signal and existing sufficient fluctuations of velocity. With this object the program of solar wind observations was included at schedules of last experiments VLBR04.1, VLBR04.2, VLBR04.3, performed at Low Frequency VLBI Network in June, July and October of 2004 at wavelength 6 cm. Records of experimental data was realized at system MK2. Processing of date will be made at correlator MK2 “NIRFI-3” at RRI, Nizhnij Novgorod, Russia. The high time resolution of this correlator and large diameter of enabled antennas let us to expect satisfactory results as concerned the solar wind velocity determination.
Acknowledgements. This work is supported by grants RFBR-02-02-39023, RFBR-04-02-27022, NSCF-10173015. We thank the staff at the participating observatories, who made these observations possible.
References
- [1] Altunin, V. I., Dement’ev, A. F., Lipatov, B. N., Nechaeva, M. B., Okmyanskiy, V. A., Snegirev, S. D. and Tikhomirov, Yu. V. 2000, Radiophysics and Quantum Electronics, 43, No. 3, 178.
- [2] Girin I. A., Likhachev S. F., Molotov I. E., Chuprikov, A. A., Dementiev, A. F., Lipatov, B. N., Nechaeva, M. B., Snegirev, S. D., Tikhomirov, Yu. V. 1999, Radiophysics and Quantum Electronics, 42, No. 12, 991–998
- [3] Spangler S. R., Kavars D. W., Kortenkamp P. S., Bondi M., Mantovani F., Alef W., A&A, 2002, 384, 654–665
- [4] Gavrilenko, V. G., Lipatov, B. N., Nechaeva, M. B. 2002, Radiophysics and Quantum Electronics. 45, No. 6, 419–430
- [5] Alimov V. A., Gavrilenko V. G., Lipatov B. N., Nechaeva M. B. 2004, Radiophysics and Quantum Electronics, 47, No. 3, 149–160