Detection of Gamma-rays around 1 TeV from RX J0852.04622 by CANGAROO-II
Abstract
We have detected gamma-ray emission at the 6 level at energies greater than 500 GeV from the supernova remnant RX J0852.04622 (G266.21.2) using the CANGAROO-II Imaging Atmospheric Cherenkov Telescope (IACT). The flux was 0.12 times of that of Crab at 1 TeV. The signal centroid is consistent with the peak of the X-ray emission in the north-west rim of the remnant.
1 Introduction
Young supernova remnants (SNRs) have for many years been believed to accelerate cosmic rays up to energies around the “knee” of the cosmic ray spectrum at 100 TeV, however direct observational evidence has only recently been found to support this. The interactions of such high energy cosmic rays with surrounding material produce a signature in TeV energy gamma-rays, and so TeV observations of SNR are therefore of fundamental importance in understanding the origin of Galactic cosmic rays. To date, the only SNRs which have been reported to emit TeV gamma-rays are the shell-type SNRs SN1006 (Tanimori et al., 1998), RX J1713.73946 (Muraishi et al., 2000; Enomoto et al., 2002b), and Cassiopeia A (Aharonian et al., 2001). However, although RX J1713.73946 has been detected by two groups (Hofmann, 2004), there have as yet been no confirming reports for Cassiopeia A, and for SN1006, a recent upper limit is significantly below the originally reported flux (Hofmann, 2004). Therefore, in addition to further observations of these sources, it is necessary to search for further examples of such SNRs.
RX J0852.04622 (G266.21.2) is a SNR located (in projection) at the southeast corner of the Vela SNR. It was discovered by Aschenbach (1998) using data from the ROSAT All-Sky Survey. It is one of the few known SNRs which display strong non-thermal X-ray emission (Tsunemi et al., 2000; Slane et al., 2001). In addition, the 1157 keV line of 44Ti was detected by COMPTEL (Iyudin et al., 1998). From a consideration of the lifetime of 44Ti (90 yr), the X-ray flux, and the angular size of the X-ray emission, 2∘, the age and distance from the Earth were estimated to be 500–1100 yr and 80–500 pc, respectively (Aschenbach, Iyudin, & Schonfelder, 1999). An independent estimate of the distance, of 1–2 kpc, was provided by Slane et al. (2001) from a simple scaling of the column density, which suggested that the SNR was at least several times more distant than the Vela SNR. ASCA hard X-ray images revealed a shell-like morphology with a featureless spectrum well described by a power-law (Tsunemi et al., 2000; Slane et al., 2001). Radio emission also has a non-thermal spectrum (Combi, Romero, & Benaglia, 1999; Duncan & Green, 2000). Both the X-ray and radio emission are brightest in the north-west rim of the SNR. These data suggest that particles may be being accelerated to 100 TeV. At these energies electrons can give rise to TeV gamma-rays through inverse Compton scattering, and protons can interact with surrounding material to produce TeV gamma-rays via decay.
Furthermore, RX J0852.04622 is, like RX J1713.73946, an extended SNR at X-ray energies. The relatively large angular size enables us to study the detailed morphology even with the existing angular resolution.
We have observed RX J0852.04622 with the 10 m diameter CANGAROO-II Imaging Atmospheric Cherenkov Telescope (IACT). The telescope (Kawachi et al., 2001) detects gamma-rays above several hundred GeV by reconstructing optical Cherenkov images generated by relativistic secondary particles in the cascades produced when high-energy gamma-rays (and background cosmic rays) interact with the Earth’s upper atmosphere. Parametrizing the optical images enables the direction and energy of gamma-ray events to be inferred. The telescope is located near Woomera, South Australia (136∘47′ E, 31∘06′ S), from which RX J0852.04622 culminates at 15∘ from the zenith, enabling observations with a lower energy threshold. The angular resolution of CANGAROO-II was estimated to be 0.30–0.39∘ (2.6–3.4 pc at a distance of 0.5 kpc) with an energy threshold of 500 GeV depending on the observing conditions and the spectrum.
2 Observations
The observations were carried out between 2001 December 12 and 2002 February 15 (19 nights), and between 2003 January 5 and February 28 (25 nights). The telescope tracked the peak of the X-ray emission, in the north-west rim of the SNR (, , J2000 coordinates). The field of view (FOV) of the camera is 2.762.76∘. The brightest star in the FOV, SAO 220422, has a visual magnitude of 4.1, and this region is brighter than our typical on-source FOV. As a result, we used a higher trigger threshold, requiring 5 triggered pixels rather than the usual 3 (Itoh et al., 2003). The recently installed lights several kilometers from the telescope were expected to have little effect on these observations as the telescope was pointed close to the zenith (Itoh et al., 2003), and this was confirmed from the azimuthal angle dependence of the shower rate (see § 3). Each night was divided into two or three periods, i.e., ON–OFF, OFF–ON–OFF, or OFF–ON observations. ON-source observations were timed to contain the meridian passage of the target, as was done by Enomoto et al. (2002b). In total, 5900 min. of ON- and 5300 min. of OFF-source data were obtained.
3 Analysis
First, ‘cleaning’ cuts on camera images were applied, requiring (0.115∘-square) pixel pulse-heights of greater than 3.3 photoelectrons, and Cherenkov photon arrival times within 50 ns of the median arrival time. Clusters of at least five adjacent triggered pixels (rather than the usual four-pixel cut) were required in each event to minimize the effects of the bright star field. After these pre-selection cuts, which reduced events due to background light were reduced by 99%, the shower rate was stable on a run-to-run basis for observations in the same year. The systematic difference of the run-by-run acceptance within the same year is expected to be less than 12%. The ON/OFF shower rate differences in 2002 and 2003 were % and %, respectively. By examining the event rates within each run we were able to reject periods affected by cloud, dew forming on the mirrors, instrumental abnormalities, etc. Only data taken at elevation angles greater than 60∘ were accepted. After these cuts, 4300 min. of ON- and 3900 min. of OFF-source data survived.
Trigger rates for each pixel per 700 s were monitored by a scaler circuit in real-time and recorded each second. These data were used to exclude ‘hot’ pixels (generally due to the passage of a star through the FOV of a pixel) in off-line analysis. Hillas parameters were then calculated to discriminate gamma-rays from cosmic rays based on the image shape and orientation (Hillas, 1985). Further, in each year’s data, we masked a small number of pixels which showed deformed ADC spectra, possibly due to a hardware fault. Discrimination of the cosmic ray background from gamma-rays was carried out using the likelihood method of Enomoto et al. (2002a).
4 Results
The resulting distributions of the image orientation angle, , for the combined data in 2002 and 2003 are shown in Fig. 1. The normalizations between the ON- and OFF-distributions were carried out using data with . The numbers of excess events () were (in an observation time of 2100 min.), (2200 min.), and (4300 min.) in 2002, 2003, and the combined data, respectively. The excess rates for 2002 and 2003 were similar to each other. Nightly signal rates were also checked during both years. The largest deviations occurred with a rate times larger than the average for 2002 and times for 2003, respectively. These are not unexpected statistically, and therefore there is no evidence of time-variability in the TeV emission.
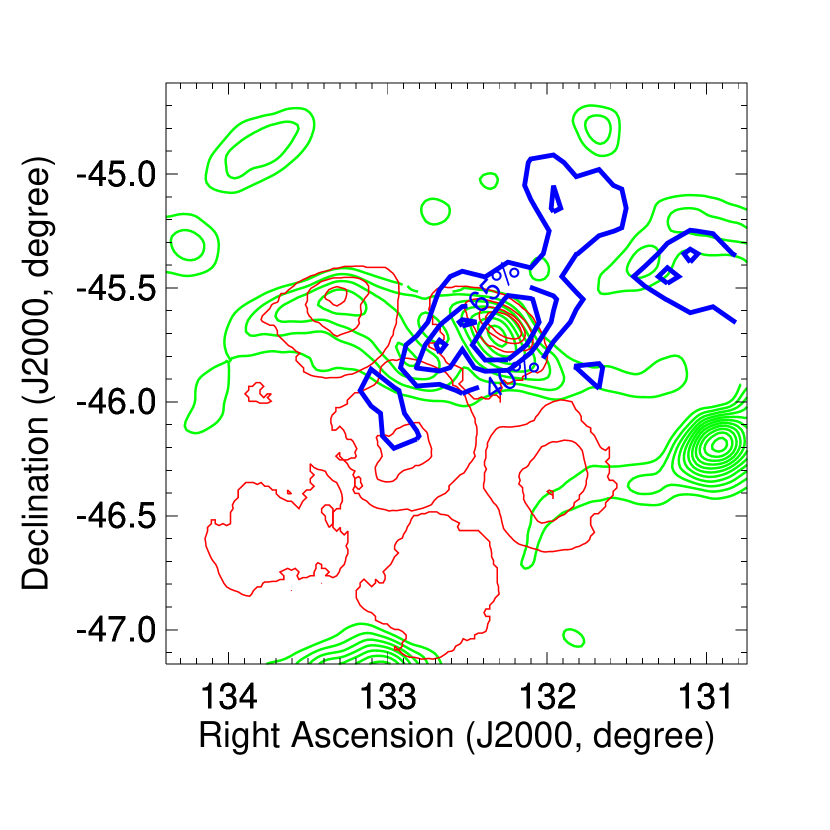
To check on the spatial distribution of the signal we derived the “significance map”, shown by the blue contours in Fig. 2. The contours were calculated from the distribution of the detection significance determined at each location from the difference in the plots (ON- minus OFF-source histogram) divided by the statistical errors. The centroid is consistent with position of the X-ray maximum, within our possible systematic uncertainty of 0.1∘. The region enclosed by the 65% (of the peak TeV significance) contour is elliptical with a semi-minor axis of 0.19∘ (NE-SW) and a semi-major axis of 0.35∘ (NW-SE), while our angular resolution was estimated to be 0.30–0.39∘. The acceptance of the CANGAROO-II telescope decreases smoothly with offset from the tracking center, falling to 50% at a 0.9∘ offset, i.e. at the edge of the trigger region. It is difficult to obtain the reliable upper limits on the two neighboring X-ray enhancements in the rim since they are near the edge of the trigger region.
After correcting for this acceptance, the differential fluxes listed in Table 1 were derived. As both statistical and systematic errors are included, the energy bins overlap somewhat, particularly at low energies. The systematic uncertainty for the energy determination (20%) dominates the errors in the energies. The Spectral Energy Distributions (SEDs), derived from radio, X-ray, MeV gamma-ray, and our TeV gamma-ray observations, are plotted in Fig. 3. The hatched area indicates the allowed region, where the for the power-law fitting including energy uncertainty, and is the for the best fit. The values are listed in Table 1. The derived spectrum has a power-law index of , the errors of which come predominantly from the uncertainty in energy.
The derived spectrum from RX J0852.04622 seems rather steep. The photon index of 2.6, however, is within 1 level due to the large uncertainty on the energy determination. This indicates that we cannot firmly conclude that the energy spectrum as soft as spectral index of 4.3. Recently CANGAROO-II collaboration has reported a similar steep spectrum from the Galactic Center (Tsuchiya et al., 2004). This spectrum is different from that reported by H.E.S.S. collaboration (Aharonian et al., 2004a). Applying the same procedure to the Galactic Center result, the allowed spectral index range became 4.6. No further answer on this is found in this stage. Time variability might be one of solution (Aharonian & Neronov, 2004). On the other hand, the difference in the energy spectrum from the SNR RX J1713.73946 between the CANGAROO-II and the H.E.S.S. is 2.2 level (Aharonian et al., 2004b). These complex situations encourage the further observations and analysis of the stereoscopic data using IACTs.
Our Monte Carlo simulations predict, even for a point-source, that the distribution of gamma-ray events for this soft spectrum should have a broader peak than that for a Crab-like spectrum. Therefore we cannot conclude from the experimental data whether this source is extended or point-like.
Various checks on the signal yield and position were carried out, by varying thresholds, clustering cuts, Hillas parameter values, etc: these yielded consistent fluxes within the systematic errors given in Table 1. Also, Crab nebula data were analyzed with the same code, with the derived flux and morphology consistent with previous measurements and the point-spread function, respectively. The distributions of the Hillas parameters for the excess events were checked and found to be to be consistent with Monte Carlo simulations for gamma-rays. The OFF-source data were compared with the Monte Carlo simulations for protons, and found to be consistent.
5 Discussion
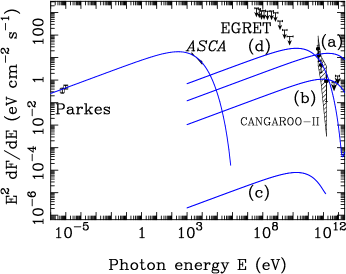
The gamma-rays around 1 TeV are most likely produced by one of two mechanisms. We consider first the synchrotron/inverse Compton (IC) model. The spectra obtained using this model are shown in Fig. 3 (upper). This model has the following parameters: the magnetic field (), the spectral index of electrons (), and the maximum electron energy (). The cutoff energy of the synchrotron emission is proportional to , which was constrained by the X-ray and the radio data. The cutoff of the IC emission is proportional to . The ratio of the peak of the synchrotron component and the peak of the IC component in the SED is proportional to . If is too small, is too high to explain our data, as shown by (a) in Fig 3. The lower limit of in this model is 12 G as shown by (b) in Fig. 3. This model cannot explain our data.
A more complex model in which the synchrotron and IC emissions come from different zones (a two-zone model) was considered by Aharonian, Atoyan, & Kifune (1997). At first, we assume the same electron spectra and with different zone sizes. The lines(c) and (d) in Fig. 3 show the IC emissions with size ratios (VTeV/V) of 1 and , respectively. The flux ratio between lines (c) and (d) corresponds roughly to the size ratio. This model requires a high size ratio and a strong magnetic field ( mG). Chandra observations revealed small-scale structures in the rim of SN1006 (Bamba et al., 2003): similar high resolution observations (in both X-rays and TeV gamma-rays) of RX J0852.04622 will help constrain the size ratio and refine this two-zone model. Stereo observations in the TeV region are required.
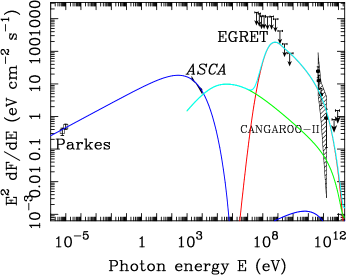
The other possible origin for the gamma-rays is decay. The estimated flux from decays is shown by the red line in Fig. 3 (lower). The emissions from the electrons were also considered using the electron/proton ratio (). Bremsstrahlung emission, shown by the green line, is constrained by the ASCA data. Therefore was limited to be at most 4. As a result, both the flux of the inverse Compton emission and that of the bremsstrahlung were too small at TeV energies to explain our data. The sum of the emission, the inverse Compton emission and the bremsstrahlung is shown by the light blue line. The spectrum of accelerated protons is assumed to be a power-law with an exponential cutoff. The model has the following parameters: the spectral index of the protons, the maximum energy of protons (), and , respectively. Here, , , and are the total energy of protons in the region from which gamma-rays were detected, the number density of protons where the interactions occur, and the distance from the earth, respectively. The spectral index and the maximum energy of protons were assumed to be those of electrons, i.e., 2.5 and 8 TeV, respectively. For the best-fit spectrum 4.9 was obtained. Assuming the distribution of the energy of the accelerated cosmic rays is isotropic, the total energy of accelerated cosmic rays in the whole SNR is proportional to the ratio Vtot/VTeV, where Vtot is the total volume. This ratio was estimated to be 46 from the “significance map” with the assumption of spherical symmetry. The range of (Vtot/VTeV) of –ergs corresponds to of 23000–230, which are typical values for molecular clouds. Thus, the model of decays can naturally explain the multi-band spectrum.
The molecular distribution toward the whole extent of the Vela SNR has been mapped by Moriguchi et al. (2001). As RX J0852.04622 is embedded (in projection) in the Vela SNR, it is not possible to uniquely associate the detected molecular clouds with one or other SNR. The general anti-correlation of the X-rays and 12CO with the Vela SNR suggests a strong interaction between this SNR and the interstellar medium, but does not rule out the existence of molecular clouds around RX J0852.04622, encouraging the further analysis.
References
- Aharonian, Atoyan, & Kifune (1997) Aharonian, F.A., Atoyan, A.M., & Kifune, T. 1997, MNRAS, 291, 162
- Aharonian et al. (2001) Aharonian, F.A., et al. 2001, A&A, 370, 112
- Aharonian et al. (2004a) Aharonian, F.A., et al. 2004a, A&A, 425, L13
- Aharonian et al. (2004b) Aharonian, F.A., et al. 2004b, Nature, 432, 75
- Aharonian & Neronov (2004) Aharonian, F.A. & Neronov, A. 2004, submitted to ApJ, astro-ph/0408303
- Aschenbach (1998) Aschenbach, B. 1998, Nature, 396, 141
- Aschenbach, Iyudin, & Schonfelder (1999) Aschenbach, B., Iyudin, A.F., & Schonfelder, V. 1999, A&A, 350, 997
- Bamba et al. (2003) Bamba, A., Yamazaki, R., Ueno, M., & Koyama, K. 2003, ApJ, 589, 827
- Combi, Romero, & Benaglia (1999) Combi, J.A., Romero, G.E., Benaglia, P. 1999, ApJ, 519, L177
- Duncan & Green (2000) Duncan, A.R. & Green, D.A. 2000, A&A, 364, 732
- Enomoto et al. (2002a) Enomoto, R., et al. 2002a, Astropart. Phys., 16, 235
- Enomoto et al. (2002b) Enomoto, R., et al. 2002b, Nature, 416, 823
- Hillas (1985) Hillas, A.M. 1985, Proc. 19th ICRC (La Jolla), 3, 445
- Hofmann (2004) Hofmann, W. 2004, in 3rd Conf. on Frontier Science Proc., in press
- Itoh et al. (2003) Itoh, C., et al. 2003, A&A, 402, 443
- Iyudin et al. (1998) Iyudin, A.F., et al. 1998, Nature, 396, 142
- Kawachi et al. (2001) Kawachi, A., et al. 2001, Astropart. Phys., 14, 261
- Moriguchi et al. (2001) Moriguchi, Y., Yamaguchi, N., Onishi, T., Mizuno, A., Fukui, Y. 2001, PASJ, 53, 1025
- Muraishi et al. (2000) Muraishi, H., et al. 2000, A&A, 354, L57
- Slane et al. (2001) Slane, P., Hughes, J.P., Edgar, R.J., Plucinsky, P.P., Miyata, E., Tsunemi, H., & Aschenbach, B. 2001, ApJ, 548, 814
- Tanimori et al. (1998) Tanimori, T., et al 1998, ApJ, 497, L25
- Tsuchiya et al. (2004) Tsuchiya, K., et al. 2004, ApJ, 606, L115
- Tsunemi et al. (2000) Tsunemi, H., et al. 2000, PASJ, 52, 887

| Mean energy | Flux | Lower bound∗ | Upper bound∗ |
|---|---|---|---|
| of bin [TeV] | [ph/cm2/s/TeV] | ||
| 0.480.11 | (9.433.49) | 1.99 | 3.01 |
| 0.550.12 | (3.851.78) | 1.03 | 1.28 |
| 0.790.18 | (8.544.63) | 1.47 | 1.84 |
| 1.930.48 | (2.802.45) | 1.35 | 1.22 |
| 5.841.51 | 3.18 | — | — |
| 10.383.15 | 1.91 | — | — |