The signature of dark energy on the local Hubble flow
Abstract
Using -body simulations of flat, dark energy dominated cosmologies, we show that galaxies around simulated binary systems resembling the Local Group (LG) have low peculiar velocities, in good agreement with observational data. We have compared results for LG-like systems selected from large, high resolution simulations of three cosmologies: a CDM model, a WDM model with a 2 keV warm dark matter candidate and a quintessence model (QCDM) with an equation of state parameter .
The Hubble flow is significant colder around LGs selected in a flat, dominated cosmology than around LGs in open or critical models, showing that a dark energy component manifests itself on the scales of nearby galaxies, cooling galaxy peculiar motions. Flows in the WDM and QCDM models are marginally colder than in the CDM one.
The results of our simulations have been compared to existing data and a new data set of 28 nearby galaxies with robust distance measures (Cepheids and Surface Brightness Fluctuations). The measured line-of-sight velocity dispersion is = 88 20 km/sec (R/7 Mpc). The best agreement with observations is found for LGs selected in the CDM cosmology in environments with on scales of 7 Mpc, in agreement with existing observational estimates on the local matter density.
These results provide new, independent evidence for the presence of dark energy on scales of few Mpc, corroborating the evidence gathered from observations of distant objects and the early Universe.
keywords:
cosmology: theory – dark matter – large-scale structure of the Universe – galaxies: clusters – galaxies: haloes – methods: numerical1 Introduction
The Hubble flow just outside the Local Group is dynamically cold, as indicated by the small scatter in the velocity-distance diagram of nearby galaxies. This was first pointed out by Sandage, Tammann & Hardy (1972). The peculiar line-of-sight velocity dispersion (see eq. 6 for a definition) of galaxies within Mpc lies in the range km s-1 (Giraud 1986, Schlegel et al. 1994, Sandage 1999, Ekholm et al. 2001, Karachentsev et al. 2003b). This low value is likely linked to the properties of the energy-matter density field around the Local Group and it can be used to constrain cosmological models.
Interestingly, cosmological cold dark matter (CDM) simulations of hierarchical structure formation have so far not been able to produce values of the velocity dispersion around simulated galaxy groups as low as the observed one. The three models tested in the works of Schlegel et al. (1994) and Governato et al. (1997, hereafter G97) all showed substantially larger velocity dispersions and failed to recover a significant number of binary systems with the properties of our Local Group. Typical values of ranged from 200 km/sec (for the open model) to 500 km/sec (for the old “standard” CDM model with ), several times higher than the observational estimates.
Since these early works, substantial progress has been made in the determination of the main cosmological parameters. Observations indicate the presence of a significant component of smooth energy with large negative pressure (observations of high-redshift supernovae by Perlmutter et al. 1999, Riess et al. 1999; analysis of fluctuations of the cosmic microwave background combined with data on the large-scale structure of galactic distribution by Balbi et al. 2000, Tegmark, Zaldarriaga & Hamilton 2001, Netterfield et al. 2002, Spergel et al. 2003, Verde et al. 2003, Dai, Liang & Xu 2004). This component has been dubbed dark energy, and the most appealing candidate is Einstein’s cosmological constant (see Peebles & Ratra 2003 for a recent review).
On theoretical grounds, Baryshev, Chernin & Teerikorpi (2001) (but see also Chernin 2001) suggested that a dark energy (DE) component would cause peculiar velocities to cool adiabatically in regions of the universe where dark energy overcomes the gravity of the local dark matter concentration. In such regions, the usually growing mode of the density perturbation is decaying ( and ). When dark energy dominates, new structures do not condensate and linear perturbations of density and peculiar velocities field decay (this effect was also considered for vacuum-dominated regions by Chernin et al. 2003). They have shown that for a Milky-Way like halo the DE starts to be dominant on a scale of few Mpc and that the strength of this effect is related to the equation of state of the DE. Their idea was developed further by Karachentsev, Chernin & Teerikorpi (2003) and Chernin et al. (2004), using a numerical approach to trace the trajectories of the radially expanding galaxies back in time in different cosmological models to see the effect of a cosmological constant on the evolution of the flow. In a more general frame the importance of DE on Cluster and Galaxy scales was also pointed out by Mota & van de Bruck (2004) and Nunes & Mota (2004) using linear theory and spherical collapse model and extended to model beyond the standard FRW model by Teerikorpi, Gromov, Baryshev (2003).
Recently, Klypin et al. (2003a) simulated the evolution of a cosmic region resembling the real Universe around 100 Mpc from the Local Group. The density field was mapped using the MARKiii survey (Willick et al. 1997) and a CDM power spectrum was assumed. The authors report a peculiar line-of-sight velocity dispersion of 60 km/sec around the Local Group in their simulation, which is a significant improvement compared to previous studies. We have extended their work on a bigger sample of simulated LGs to test if the low value of reflects the specific geometry of the mass distribution, or/and is a general characteristic of the cosmology used.
The possibility that the observational estimate of adopted in previous works be incorrect or biased cannot be dismissed entirely, as the based on Tully-Fisher (TF) distances suffers likely from large distance errors (which should however increase ) while the lower value estimated by Ekholm et al. (2001) was based on a sample of only 9 galaxies. Moreover, the galaxies in the TF sample used by Schlegel et al. (1994) had been “regrouped”. This was necessary in order to avoid inflating with the internal velocity dispersion of small virialised galaxy associations. No detail, however, was given on how the procedure was carried out. If, for example, the velocities of loose, non virialised associations of galaxies are averaged, the could be effectively “cooled” by removing the peculiar motion of infalling galaxies.
All considered, the existing literature raises interesting questions but leaves them partially unanswered: is the low value of a generic problem of all CDM models or does it depend on the cosmology adopted? How important is the influence of the local environment and/or the surrounding large scale structure? Is the addition of a cosmological constant important? How robust is the observational estimate of around our own LG?
Motivated by the growing success of flat -dominated models and the availability of more accurate distance estimates, we embarked on a new analysis of the problem. In this paper, we present a new sample of distances and velocities of nearby galaxies combined with results from other authors on the very local ( Mpc) Hubble flow. We compare these observational data with new high resolution simulations, considering DE models with a constant equation of state parameter different from in order to test the impact of DE on the cooling of the local Hubble flow.
2 Revisiting the Coldness of the Hubble Flow
To obtain a robust estimate of the coldness of the Hubble flow around the Local Group, it is essential to use accurate distances to nearby galaxies. As noted above, previous measures of were based on TF distances, which suffer from fairly large relative errors, especially for small, poorly resolved galaxies and/or viewed at unfavourable angles.
To this purpose we have gathered data from different sources: Cepheid-based distances taken from the Hubble Space Telescope (HST) key project to measure the Hubble constant (Freedman et al. 2001), distance estimates based on the Surface Brightness Fluctuation method (SBF, Tonry et al. 2001) and, mainly as a comparison, TF distances (Tully et al. 1992). For galaxies common to several samples we have kept the Cepheid-based distances. The final sample contains 28 galaxies within 10 Mpc from the Sun (11 with Cepheid-based distances; 17 early type galaxies with distances measured using the SBF method: 37 with TF distances). We have converted heliocentric distances into distances relative to the barycenter of the Local Group, taken 2/3 of the way on the line between M 31 and the Milky Way (hereafter denoted as ). As for the heliocentric distance to M 31, we used the Cepheid derived value of 870 kpc (Ekholm et al. 2001). The observed heliocentric velocities, taken from the NASA Extragalactic Database, were corrected to the values they would have if measured from an observer in our galaxy at rest relative to the centroid of the Local Group, according to Yahil et al. (1977).
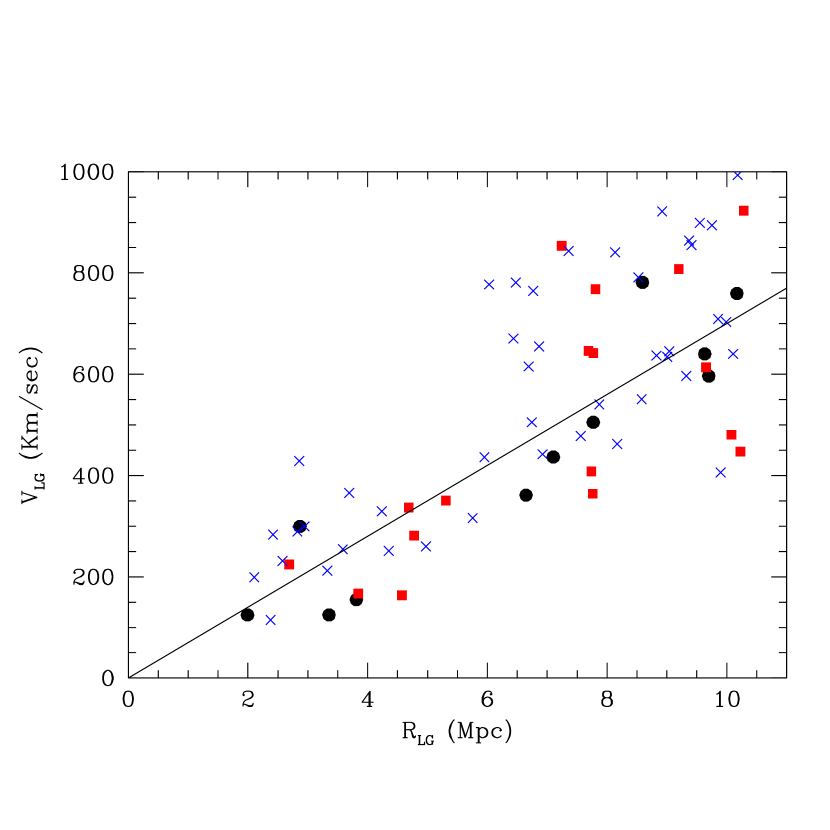
With this sample of 28 galaxies it is also possible to measure how changes with radius as larger and larger volumes (with radius up to 10 Mpc) are included. Fig. 1 shows a velocity-distance plot, where the distances are relative to the barycenter of the LG and the velocities have been corrected for the solar motion toward the centroid of the Local Group. The crosses show the TF points, the black dots the Cepheid-based values and the filled squares are from the SBF sample. The straight line corresponds to km s-1 Mpc-1.
Measures of including the TF sample proved to be systematically higher by 30–40% than those using only galaxies with Cepheid- or SBF-based distances independent of the particular sky quadrant they were selected, showing that TF galaxies are not tracing different (hotter) structures, but are rather subject to larger distance errors. We then decided to not use the TF sample.
We regrouped galaxies in regions with a number overdensity larger than 64. This overdensity threshold corresponds roughly to virialised region (Eke et al. 1996). Each group was assigned the mean position and velocity of its members. Only a smaller number (%) of galaxies were linked together, mostly into binary and triple systems. Result obtained using our regrouping scheme, do not differ substantially from those using galaxy sample without regrouping.
The velocity dispersion increases with the size of the sphere within which galaxies are included. It varies from 52 km s-1 within 3 Mpc to 135 km s-1 within 10 Mpc. This is in agreement with previous results of Ekholm et al. (2001) based on 7 galaxies within 7 Mpc and those of Schlegel et al. (1994), based on a sample of galaxies between 3 and 7 Mpc. Our estimate of is a bit higher than the one obtained by Karachentsev et al. (2003b) who found km/sec inside a sphere of 5 Mpc using distances from luminosity of the tip of the red giant branch stars of 16 dwarf galaxies, but the results are compatible at the level. For measured using HST and SBF galaxies in spheres centered on the LG with growing radius we obtained the following fit:
The final results of the relation vs enclosing radius are shown in Fig. 5, where we also include the results of Karachentsev et al. (2002) for the very local ( Mpc) Hubble flow.
3 A Review of theory predictions
In this section, we very briefly review the analytical work done on the subject of cold flows in the context of the Local Group Hubble flow. Specifically Baryshev et al. (2001) and Axenides & Perivolaropoulos (2002) had already suggested on the basis of simple dynamical arguments that dark energy could appear as a cooler of peculiar motions in the Local Group environment. What is the expected trend as the constant in the equation of state of dark energy changes?
A first fundamental difference between the quintessence and the () models is the epoch at which dark energy dominates over the gravitational attraction of the matter.
The expansion of a flat universe with dark energy is governed by the Friedmann equation
| (1) |
where is the scale factor. The dark energy term dominates over the gravitational attraction of the matter at redshifts lower than :
| (2) |
For , this gives and for .
It has been argued from linear perturbation theory that dark energy has little effect on the local dynamics (Lahav et al. 1991, Wang & Steinhardt 1998). In linear perturbation theory, the peculiar velocity field associated with a spherical mass concentration with density contrast averaged over proper radius is , where ; with (Peebles 1980). Wang & Steinhardt (1998) have provided an approximation to in quintessence models, which showed that the difference between the linear peculiar velocities in models with different is negligible, as the growth factor depends mainly on and dark energy dominates only at late times.
However, it has been later recognized that peculiar velocities can be cooled locally for galaxies located in a “dark energy dominated zone” (Baryshev et al. 2001). Considering a shell enclosing a mass evolving in an expanding background, one can calculate a “zero-mass” radius beyond which the dark energy dominates over the gravitational attraction of the matter (). The equation of motion of the shell is:
| (3) |
Baryshev et al. (2001) have argued that peculiar velocities are cooled adiabatically for galaxies situated beyond the zero-mass surface, where dark energy dominates the dynamics. For , the zero-mass radius is independent of the redshift:
| (4) |
using M⊙ for the Local Group (van den Bergh 1999) and our adopted cosmological parameters. For , we have
| (5) |
For (which is equivalent to an open model with the same matter energy content), . For , . This gives Mpc.
Note that the relative importance of dark energy on the dynamics of galaxies around a mass concentration varies in time, depending on the local density contrast. The zero-mass radius is larger around high-density regions, and for a given region it increases with cosmic time. So a galaxy which is now close to the Local Group and within the matter dominated zone could have been in the dark energy dominated zone in the past (even if the dynamics of the universe as a whole was not dark energy dominated) and have had its peculiar velocity cooled during a period of time. Numerical simulations make it possible to see the integrated effect of the dynamical evolution of galaxies around concentrations of mass, which cannot be calculated easily analytically as galaxies could move in and out of dark energy dominated zones.
If a galaxy has been in the dark energy dominated zone at from redshift until now, then its peculiar velocity will have cooled adiabatically:
As an upper limit for the peculiar velocity, one can take the Hubble expansion velocity :
For , one obtains For one has This upper limit on the peculiar velocity is lower by about 9% in the quintessence model with than in the cosmological constant case.
As pointed out by Baryshev et al. (2001), when both linear modes are decaying (the second, usually growing mode, decays as for ). Both density perturbations and peculiar velocities decay. The lower the value of the faster is the decay, so we would expect to have a colder Hubble flow in the CDM model than in the QCDM one, compensating for the earlier dominance of DE that we have in models with . These two contrary effects make hard to predict which Dark Energy model will present a colder hubble flow in a given environment. The only way to test this scenario is via numerical simulations, that we will present in the next section.
In cosmologies with no dark energy component like the open CDM model (equivalent to ), the zero-mass surface is pushed to infinity and there are no decaying modes so peculiar velocities can’t be cooled, which is consistent with the high peculiar velocities seen in simulation of the OCDM model by Governato et al. (1997).
Finally, Axenides & Perivolaropoulos (2002) have calculated the growth suppression factor of velocity fluctuations in a dark energy model compared to the Einstein-de Sitter model and concluded that the presence of dark energy is not sufficient to explain the coldness of the local flow. However, this holds true for cosmological models with different and the same high redshift normalization of the density field perturbations. However, realistic models must be normalized to match the observed value of at .
From the above analysis it seems plausible that cosmologies with a dark energy component would present colder flows around cosmic haloes. However the magnitude of this effect, the dependence on and on the local properties of the density field remain poorly constrained by simple analytical arguments based on linear extrapolations. These considerations make resorting to numerical –Body simulations necessary.
4 Simulations
We present results from four simulations, performed using two different codes:
– CDM: two simulations, both with , , =0.7, but with different resolutions (see details below);
– WDM: a flat model similar to the low resolution CDM but with a sterile neutrino mass of 2 keV as a warm dark matter candidate;
– QCDM: a quintessence model with the same parameter of the previous two simulations C(W)DM model but with a constant equation of state parameter for the dark energy .
The simulations were performed using PKDGRAV, a parallel, multistepping tree-code with periodic boundary conditions (Stadel 2001). For the quintessence simulation, we used the parallel Adaptive Refinement Tree code ART (courtesy of A. Klypin, Kravtsov, Klypin & Khokhlov 1997).
QCDM models with are now disfavored by CMB observation (Kogut et al. 2003, Verde et al. 2003). Nevertheless we have used this value for in order to try to maximize the influence of dark energy on (so it will be used as a limiting case). According to theoretical expectation (Baryshev et al. (2001) and section 3) the strength of this effect depends on the epoch when the DE becomes the dominant component of the universe: the earlier the DE period begins, the stronger the cooling. In our QCDM model the DE period starts earlier than in the CDM model, and so we would expect a larger effect of dark energy (but see discussion in earlier paragraph). To calculate the power spectrum for the WDM model and the QCDM used the CMBFAST code to generate transfer functions (Seljak & Zaldarriaga, 1996). Sterile neutrinos are a popular candidate for warm dark matter (Dodelson & Widrow 1994, Dolgov & Hansen 2002). Though formation mechanisms for sterile neutrinos are likely to produce a non-thermal energy spectrum, the filtering effect may still be modeled accurately using thermal neutrinos with adjusted masses (Hansen et al. 2001). The WDM model can be characterized in terms of the reduction in fluctuations on dwarf galaxy scales. For 2 keV neutrinos the fluctuations on the scale of M⊙ () are down by 10% over CDM. The power spectrum at Mpc is lower by 2 orders of magnitude and thus contribution of small objects to is vastly reduced. Fluctuations on the scale of M⊙ haloes are only marginally affected ( down by 3%).
Each C(W)DM simulation cube is 100 Mpc on a side with both using 1443 particles and a spline kernel softening of 60 kpc (the spline kernel is completely Newtonian at 2 softening lengths) The QCDM simulation has a box size of 90 Mpc with 1283 particles, which gives roughly the same mass resolution as the low resolution run. Since our goal is to identify galactic sized dark haloes, not to resolve their internal structure, this combination of mass/force resolution is adequate. Each simulation used at least 512 steps for every particle, and many more (up to a few thousands) for particles with large accelerations as those at the center of dense haloes. The mass resolution is such that a well resolved halo (30 particles) at redshift zero has a circular velocity of 95 km/s. We can therefore resolve isolated haloes that are associated with galaxies that have luminosities as low as a few % of an galaxy (Cole et al. 2001).
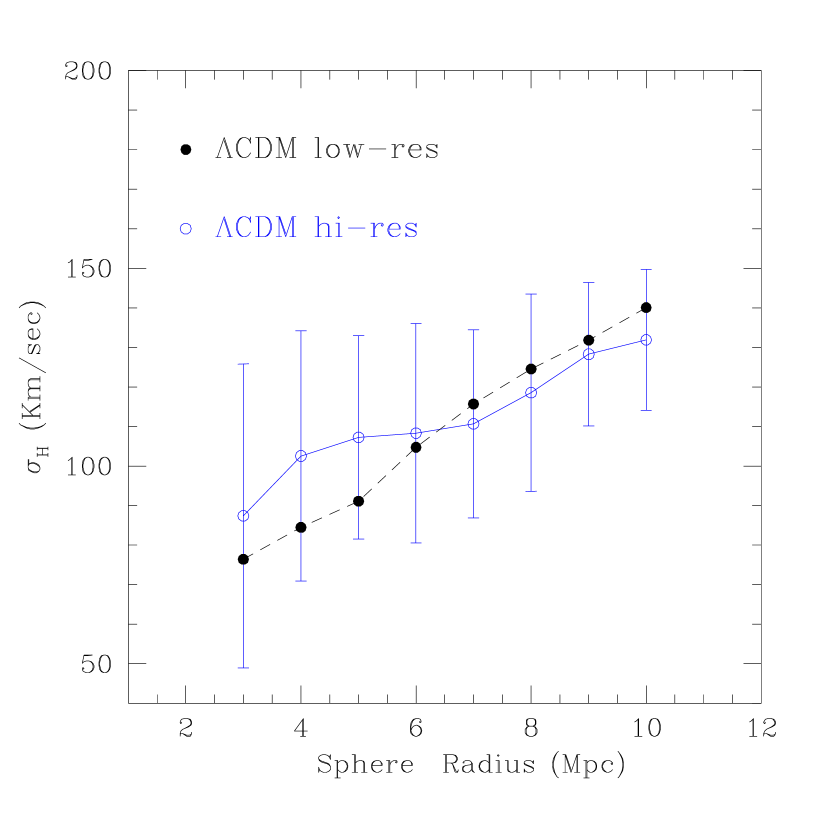
We have also analysed a very high resolution simulation for the CDM model, with dark matter particles simulated from a starting redshift . The employed volume is 50 Mpc, which gives a particle mass of M⊙ allowing us to resolve haloes down to less than M⊙ with 75 particles. The force resolution is 5 kpc and the particles in the highest density region undergo 20 000 timesteps (this simulation is described in more details in Reed et al. 2003a). In this run, we are able to resolve the substructure inside haloes corresponding to galaxy groups, allowing us to evaluate the effect of substructure within larger haloes in velocity dispersion measurements. The results of a comparison with the low resolution run are shown in Fig. 3.
Our CDM model has parameters very close to those currently suggested by observational results. This model has been successful on an extended number of crucial tests on scales down to a few Mpc. However, recent results pointed out a possible flaw of CDM at galactic and subgalactic scales, like steeper density profiles than those implied by galaxy rotation curves (Moore et al. 1998, de Block & Bosma 2002, Swaters et al. 2003, Reed et al. 2003b, Diemand et al. 2004a) and an excess of substructure (i.e. small satellites) in galactic haloes (Moore et al. 1999, Klypin et al. 1999, Ghigna et al. 2000, De Lucia et al. 2004, Diemand et al. 2004b; Klypin et al. (2003b) for QCDM model). Both problems may be linked to an excess of power at small scales. Hence, as a cure to the above mentioned problem a WDM rather than CDM component reduces the amount of density fluctuation and subgalactic scale and may prove useful in cooling the Hubble flow around the Local Group. To boost its possible effects we used for the mass of the WDM a value of 2 keV, this is close to the minimum allowed from constraints based on satellites abundance and the abundance of absorption systems (Bode, Ostriker & Turok 2000). A lower WDM mass would likely underproduce both of them. Recently Yoshida et al. (2003) put strong constraints on WDM candidates lighter than 10keV based on the abundance of haloes at the epoch of reionization.
5 Halo finders and selection of LG systems
Our simulations only follow the evolution of the dark matter component. It is expected that baryons condense and form galaxies at the centers of the dark matter haloes (White & Rees 1978; Cen & Ostriker 1992,1993a,b; Katz, Hernquist & Weinberg 1992). For our purpose of locating LG halo candidates (not resolving their internal structure), we resorted to two algorithms: SO and SKID (SKID is publicly available at http://www-hpcc.astro.washington.edu). Our version of SO (Lacey & Cole 1995) uses SKID halo centers (based on the density maxima) as a start, then a sphere is grown around this center until the enclosed density drops below some threshold which is chosen to be that associated with the average density inside a spherical virialised halo in that given cosmology (values were and for LC(W)DM and QCDM respectively (Mainini et al. 2003); At difference with SKID, SO imposes a spherical symmetry to the haloes and, perhaps more importantly, regroups substructure within larger virialized structures. We verify that this does not affect our results in subsection 6.2. We verified that our results were largely independent on which halo finder we used and decided to show results only from SO. In this paper we assume that a galaxy with a certain circular velocity would be found in a dark halo that has a similar circular velocity (Cole et al. 2001).
6 STATISTICAL PROPERTIES OF LOCAL GROUP CANDIDATES: COMPARING simulations with THEORY and OBSERVATIONS
6.1 Selection of Local Groups
Following G97, from the halo catalogs obtained we selected “Local Groups”, i.e. binary haloes with the following criteria:
-
1.
A generic sample of binary haloes with separations Mpc and circular velocities km/sec.
-
2.
A LG sample defined such that Mpc, circular velocities km/sec, negative radial velocities and no neighbors within 3 Mpc with circular velocity larger than either of the two group members.
-
3.
A LG sample defined as (2) but with the additional requirement that the binary haloes must lie close (5–12Mpc) to a Virgo sized cluster with km/sec.
In the CDM cosmology, about 30 Local Groups satisfy criteria 1) and 2), and about 15 satisfy point 3) as well. As we will show later there are no significant differences between samples 2 and 3 (and actually with the global field halo population, see Fig. 6), and we will refer to our Local Group sample as systems identified using criterion 2).
We define the peculiar line-of-sight velocity dispersion from the Hubble flow for a set of haloes within a sphere of radius (in Mpc) centered on the center of mass of each simulated LG as:
| (6) |
where
| (7) |
where a local Hubble constant Hloc is fit to each dataset of haloes. We have used the same procedure also to analyse the data points shown in Fig. 5.
6.2 Comparison with observations
Comparing the results from this new set of simulations to the ones obtained by G97 (see Fig. 2), it is evident that the new, dark energy dominated models fare better, expecially when compared to the new observational estimate of . The velocity dispersion is down by at least a factor of two compared to the classical, but outdated SCDM model for a large range of overdensities.
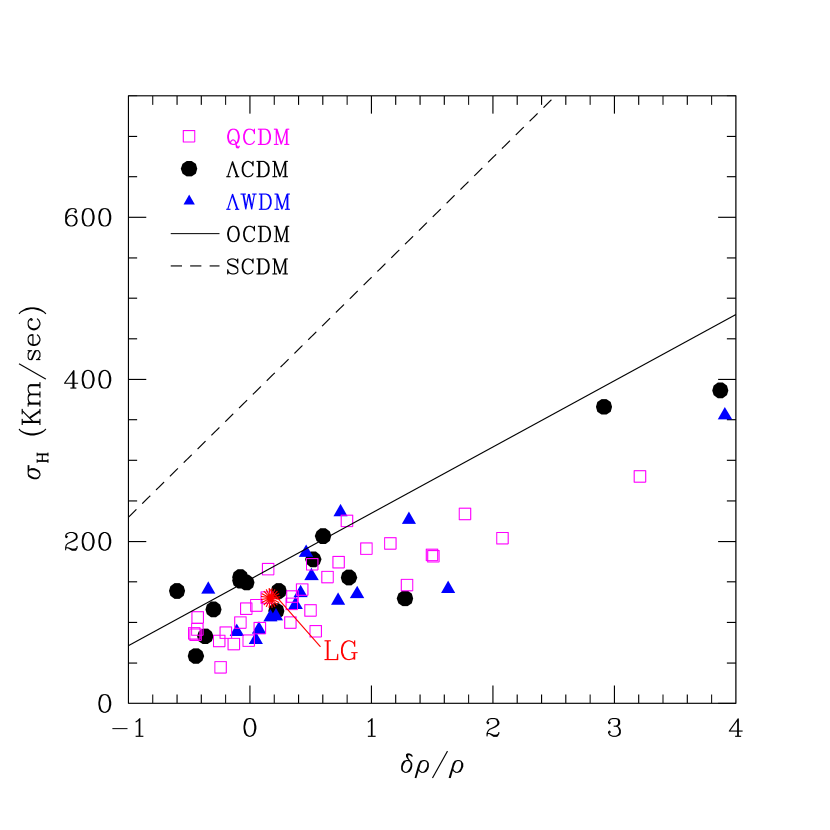
CDM and WDM give almost the same for the whole range of overdensities. The QCDM model produces a colder Hubble flow, as better shown in Fig. 4.
In Fig. 3 we show the comparison between low and high resolution simulations. As expected, the high resolution run has a higher value of at small scales, due to the fact that we are able to resolve the inner structure of the more massive haloes (corresponding to galaxy groups) around the LGs. The velocity dispersion is lower on scales Mpc. This could be related to the smaller box size that reduces the effect of the large-scale structure. Nevertheless, both simulations agree within the 1 error bars showing that the effect of substructure is small.
As shown by G97, the velocity dispersion around the Hubble flow depends strongly on the local overdensity. This can be determined for the Local Group using the complete catalogue of IRAS galaxies. The current best estimate based on IRAS galaxies is for a top-hat sphere of radius 500 km/s (Strauss 1996, private communication). Hudson (1993) uses a compilation of optical galaxy surveys to study the local density field and within the same volume he finds an overdensity of . The agreement between the optical and IRAS surveys is encouraging and indicates that the Local Group resides in a region of the Universe of almost average density.
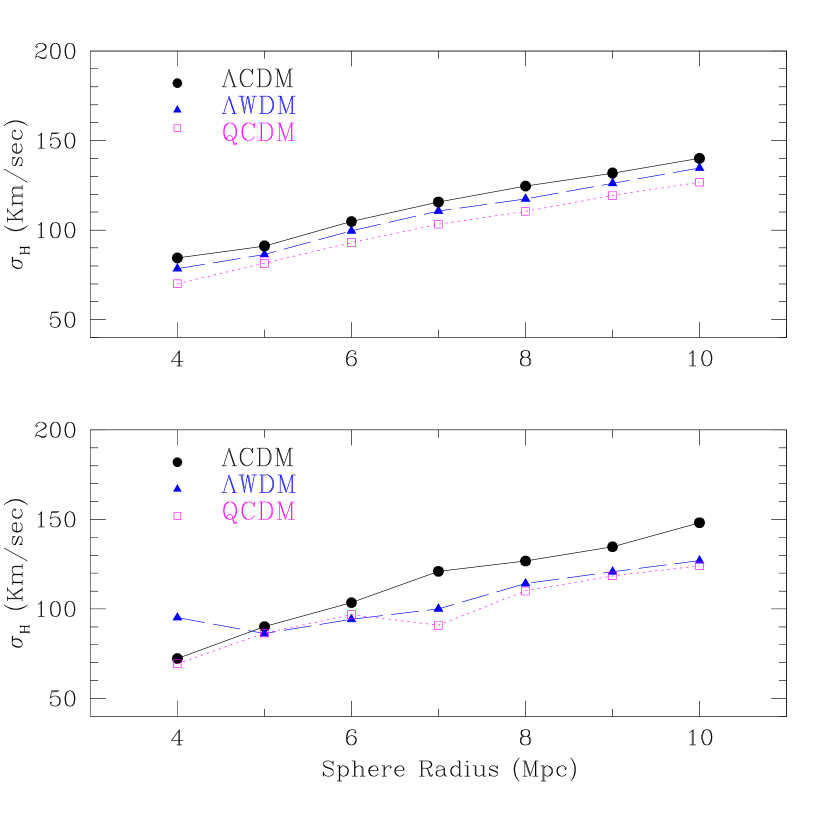
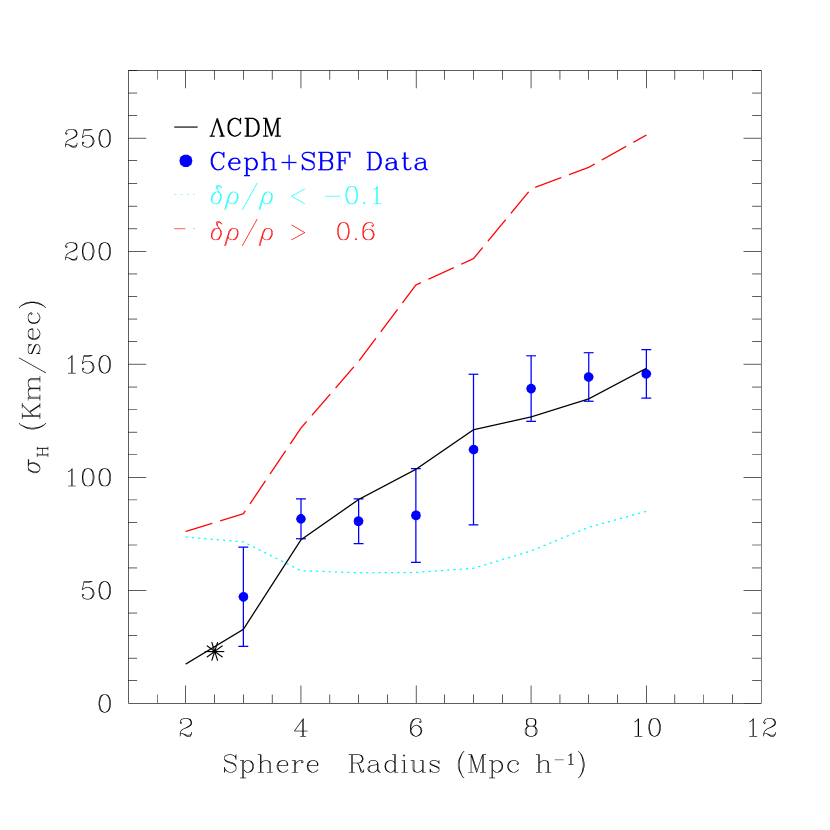
If simulated LGs are selected in regions with a local overdensity between , both the normalization and the shape of the vs relation are well reproduced (see Fig. 5) – a remarkable success for flat, -dominated models.
The WDM performs equally well (cf Fig. 4, the higher value of at very small scales is of small statistical significance), indicating that it is the presence of a cosmological constant, which is the most important ingredient, rather than the details of the power spectrum at subgalactic scales. This is further supported by the QCDM simulation, which produces a Hubble flow colder than in both models at all scales. That seems to indicate that a longer period of dark energy dominance has the capability to produce a colder Hubble flow, in agreement with the theoretical expectations by Baryshev et al. (2001) and section 3). Comparing our analysis to the results of G97, it appears that only DE-dominated models are able to satisfy at the same time small and large scale structure constraints and generate a substantial number of simulated LGs with comparable to the observed values. Also, LGs in LC(W)DM cosmologies fail to have in the correct range if their local overdensity is too high or too low, as shown in Fig. 5.
How are important the details of the mass distribution around the LG other than the average density on a few Mpc scale? Klypin et al. (2003a) obtained a cold Hubble flow around a simulated region that replicated the mass distribution inferred from a redshift survey of the local Universe. Their simulation assumed a CDM cosmology. Their work was based on one constrained simulation of our local environment, our LG samples were selected using some simple selection environment criteria like the absence of nearby massive groups or the presence of a rich cluster within 5–12 Mpc. However, no substantial difference was found between the typical in the different subsamples depending on the presence of nearby clusters.
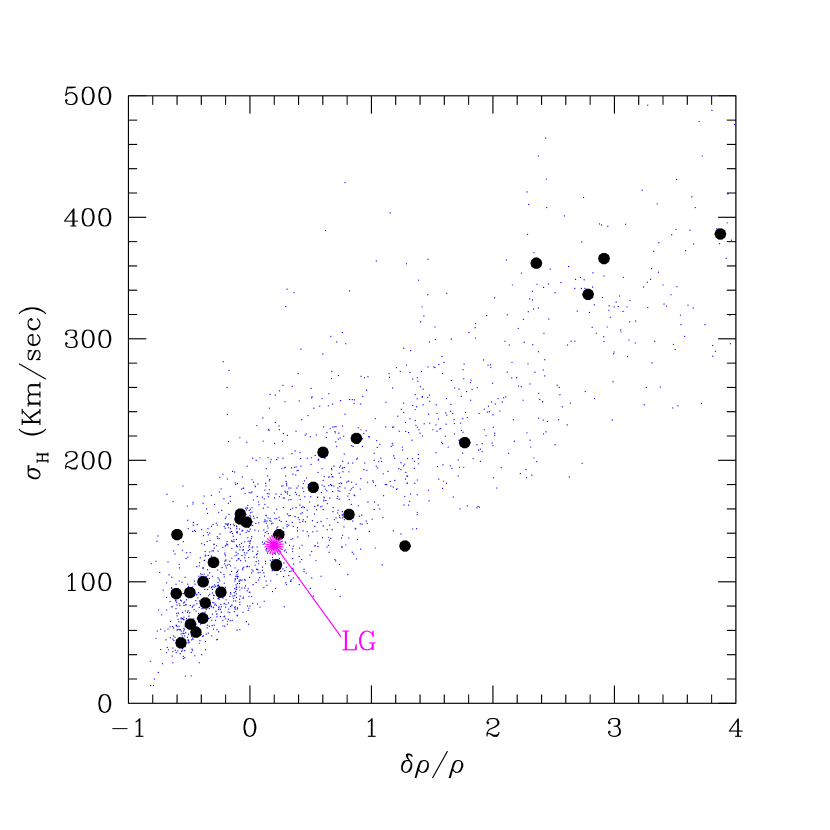
To further test the hypothesis that a special local mass distribution is necessary for a cold Hubble flow, we repeated our analysis for a much larger sample of Milky Way (MW) sized field haloes, with no special selection criteria. Results are shown in Fig. 6. A generic sample of MW-sized field haloes shows values of in the correct range if the local environment density is around average. This shows that the Local Group environment and details of its mass distribution are not special in any significant way and that in DE-dominated cosmologies a small is a general characteristic of the environment around field galaxies.
7 Conclusions
Observational evidence at large and intermediate scale points to a flat, -dominated CDM Universe. The coldness of the Hubble flow provides another, independent test at intermediate scales, where different kinds of dark matter and energy could play a significant role in shaping the local dynamics.
In this paper we have tested the predictions from cosmological models now strongly supported by observational evidence against a new, robust estimate of the Local Group in spheres of increasing radius up to 10 Mpc based on a sample of nearby galaxies.
We have shown that simulations are able to successfully reproduce the observed cold Hubble flow around field galaxies only in a flat, DE () dominated cosmology and only in environments where the local density measured on a scale of a few Mpc is close to the average one. The inclusion of a warm dark matter component does not change this result significantly, as removal of small-scale power does not play a major role.
We have also shown that (quintessence models) where the era dominated by dark energy begins earlier, produce an Hubble flow marginally colder than CDM.
This is in agreement with the theoretical expectation (see section 3 and also Baryshev et al. 2001, Chernin et al. 2004) that the coldness of the local Hubble flow follows from the fact that a galaxy’s peculiar velocity decreases via adiabatic cooling if it spends a sufficient time in the dark energy dominated region where linear perturbations decay. The presence of a dark energy field is then the key ingredient to explain the observed coldness of the local Hubble flow.
While the right cosmology and environmental density are crucial, the local dynamical criteria do not single out the LG from the generic population of field galaxies. A cold Hubble flow around Milky Way sized galaxies is equally common as in our LG subsample. This implies that the details of the mass distribution in our local environment, like the vicinity to larger clusters and/or voids and filamentary structures, do not play a major role in shaping its velocity field.
The environment of our Local Group provides a new, independent evidence for the existence of dark energy on scales of just few Mpcs, corroborating the evidence gathered from observations of distant objects and the early Universe.
Acknowledgments
The authors thank Jeff Gardner for the use of his SO halo finder and Anatoly Klypin for the use of the ART code for the QCDM run. We also thank Tom Quinn, Ben Moore, Joachim Stadel, James Wadsley and Vandana Desai for useful discussions. FG is Brooks Fellow. FG was supported in part by NSF grant AST-0098557. Computations were carried out at CINECA and ARSC supercomputing centers. CH acknowledges financial support from the Swedish Research Council Vetenskapsrådet.
References
- [1] Axenides, M. & Perivolaropoulos L. 2002, PhRvD 6517301A
- [2] Balbi, A. et al. 2000, ApJL, 545, L1
- [3] Baryshev, Yu.V., Chernin, A.D. & Teerikorpi, T. 2001, A&A 378, 279
- [4] Bode, P., Ostriker, J. P., & Turok, N. 2001, ApJ, 556, 93
- [5] Cole, S., Lacey, C. G., Baugh, C. M., & Frenk, C. S. 2000, MNRAS, 319, 168
- [6] Chernin, A.D. 2001, Physics-Uspekhi 44, 1153
- [7] Chernin, A.D., Teerikorpi, P. & Baryshev, Y. 2003 AdSpR, 31, 459
- [8] Chernin, A.D. et al. 2004, A&A, 419, 19
- [9] Dai, Z. G., Liang, E. W. & Xu, D. 2004, ApJL, 612, 110
- [10] Davis, M., Efstathiou G., Frenk, C.S., White S. D. M. 1985, ApJ, 292, 371
- [11] de Bernardis, P., et al. 2000, Nature, 404, 955
- [12] de Block, J.G. & Bosma, A. 2002, A&A, 385, 816
- [13] De Lucia G., Kauffmann G., Springel V., White S. D. M., Lanzoni B., Stoehr F., Tormen G., Yoshida N., 2004, MNRAS, 348, 333
- [14] Diemand, J., Moore, B. & Stadel, J. 2004a, MNRAS, 533, 624
- [15] Diemand, J., Moore, B. & Stadel, J. 2004b, MNRAS, 352, 535
- [16] Dodelson, S. & Widrow, L. 1994 PhRevL. 72, 17D
- [17] Dolgol, A.D., & Hansen, S.H. 2002 APh, 16, 339 D
- [18] Eke, V., Cole, S. & Frenk, C.S, 1996, MNRAS, 282, 263
- [19] Ekholm, T., Baryshev, Y., Teerikorpi, P., et al., 2001, A&A 368, L17
- [20] Freedmann, W.L., Madore, B., Gibson, B.K., et al. 2001, ApJ 553, 47
- [21] Ghigna S., Moore B., Governato F., Lake G., Quinn T., Stadel J., 2000, ApJ, 544, 616
- [\citeauthoryearGiraud1986] Giraud E., 1986, A&A 170, 1
- [22] Governato, F., Moore, B., Cen, R., Stadel, J., Lake, G. & Quinn, T. 1997, NewA, 2, 91
- [23] Hansen, S.H., Lesgourgues J., Pastor, S. & Silk, J. 2002, MNRAS, 333, 544
- [24] Jenkins, A. et al 1998, ApJ, 499, 201
- [25] Karachentsev, I.D. et al. 2002, A&A, 389, 812
- [26] Karachentsev, I.D., Chernin, A.D. & Teerikorpi, P. 2003a, Ap, 46, 399
- [27] Karachentsev, I.D. et al. 2003b, A&A, 389, 479
- [28] Klypin A., Gottlöber S., Kravtsov A. V., Khokhlov A. M., 1999, ApJ, 516, 530
- [29] Klypin, A., Hoffman, Y., Kravtsov., A. & Gottloeber, S. 2003a ApJ, 596, 19
- [30] Klypin, A., Macciò A.V., Mainini R., & Bonometto S.A. 2003b ApJ, 599, 31
- [31] Kogut, A. et al. 2003, ApJS, 148, 161
- [32] Kravtsov, A., Klypin, A. & Khokhlov A., 1997 ApJ, 111, 73
- [33] Lahav O., Lilje P.B., Primack J.R., Rees M.J., 1991, MNRAS 251, 128
- [34] Mainini R., Macciò A.V. & Bonometto S.A. 2003 NewA, 8, 173
- [35] Moore, B., Governato, F., Quinn, T., Stadel, J. & Lake, G. (1998), ApJL, 499, L5
- [36] Moore B., Ghigna S., Governato F., Lake G., Quinn T., Stadel J., Tozzi P., 1999, ApJ, 524, L19
- [37] Mota, D.F. & van de Bruck, C. 2004 A&A, 421, 71
- [38] Nunes, N. & Mota, D.F. 2004, MNRAS submitted, astro-ph/0409481
- [39] Peebles, P.J.E. & Ratra, B. 2003 RvMP, 75, 559P
- [40] Peebles, P.J.E., 1980, The Large Scale Structure of the Universe. Princeton University Press, Princeton, NJ
- [41] Perlmutter, S., et al. 1999, ApJ, 440, L41
- [42] Press, W. H. & Schechter, P. 1974, ApJ, 187, 425
- [43] Reed, D. et al. 2003a, MNRAS 346, 565
- [44] Reed, D. et al. 2003b, MNRAS submitted, astro-ph/0312544
- [45] Riess, A. G., et al. 1998, AJ, 114, 722
- [46] Sandage, A., 1986, ApJ 307, 1
- [47] Sandage, A., Tamman, G.A. & Hardy, E. 1972 ApJ, 172, 253
- [48] Schlegel, D, Davis, M., Summers, F., Holtzman, J.A., 1994, ApJ 427, 527
- [49] Seljak, U. & Zaldarriaga, M., 1996 ApJ, 469, 437
- [50] Spergel, D.N. 2003, ApJS, 148, 175S
- [51] Stadel, J. 2001, PhD thesis, Univ. Washington
- [52] Swaters R.A, Madore, B.F., van den Bosh, F.C. & Balcells, M. 2003, ApJ 583, 732
- [53] Tegmark, M, Zaldarriaga, M. & Hamilton, A. 2001 PhRvD 63d3007
- [54] Teerikorpi, P., Gromov, A. & Baryshev, Yu. (2003) A&A 407, L9
- [55] Tonry, J.L., Dressler, A., Blakeslee, J.P., et al., 2001, ApJ, 546, 681
- [56] Tully, R.B., Shaya, E.J., Pierce, M.J., 1992, ApJS 80, 479
- [57] van den Bergh, S., 1999, A&ARv, 9, 273
- [58] Verde, L. et al. 2003, ApJS, 148, 195
- [59] Wang L., Steinhardt P.J., 1998, ApJ 508, 483
- [60] Willick, J.A, Courteau, S., Faber, S. M., Burstein, D.,Dekel. A. & Strauss, M., A. 1997, ApJS, 109, 333
- [61] Yahil, A., Tammann, G.A., Sandage, A., 1977, ApJ 217, 903
- [62] Yoshida N., Sokasian A., Hernquist L., Springel V., 2003, ApJ, 591, L1