The Halo, Hot Spots and Jet/Cloud Interaction of PKS 2153–69
Abstract
We report Chandra X-ray Observatory and 1.4 GHz Australian Long Baseline Array (LBA) observations of the radio galaxy PKS 2153–69 and its environment. The Chandra image reveals a roughly spherical halo of hot gas extending out to around PKS 2153–69. Two depressions in the surface brightness of the X-ray halo correspond to the large scale radio lobes, and interpreting these as cavities inflated with radio plasma we infer a jet power of . Both radio lobes contain hot spots that are detected by Chandra. In addition, the southern hot spot is detected in the 1.4 GHz LBA observation, providing the highest linear resolution image of a radio lobe hot spot to date. The northern hot spot was not detected in the LBA observation. The radio to X-ray spectra of the hot spots are consistent with a simple power law emission model. The nucleus has an X-ray spectrum typical of a type 1 active galactic nucleus, and the LBA observation shows a one-sided nuclear jet on scales. Approximately northeast of the nucleus, X-ray emission is associated with an extra-nuclear cloud. The X-ray emission from the cloud can be divided into two regions, an unresolved western component associated with a knot of radio emission (in a low resolution map), and a spatially extended eastern component aligned with the pc-scale jet and associated with highly ionized optical line-emitting clouds. The X-ray spectrum of the eastern component is very soft ( for a power law model or for a thermal plasma). The LBA observation did not detect compact radio emission from the extra-nuclear cloud. We discuss both jet precession and jet deflection models to account for the progressively increasing position angle from the northern hot spot to the western component of the jet/cloud interaction region to the direction of the pc-scale jet. In the precession model the particle beam impacts the western region while the radiation beamed from the nucleus photoionizes the eastern region and is scattered into our line of sight by dust giving rise to the polarized optical emission and possibly the soft X-ray emission. If the X-ray emission from the eastern region really is dust-scattered nuclear radiation, it would be the first detection of such emission from an external galaxy. The nearby galaxy MRC 2153–699 is also detected by Chandra.
Subject headings:
galaxies : active — galaxies : individual (PKS 2153–69) — galaxies : jets — magnetic fields — X-rays : galaxies — cosmic rays1. Introduction
The morphology of a typical radio galaxy is strongly influenced by interactions between the relativistic jet that originates at its nucleus and material in the interstellar and intergalactic media. This appears true at all stages of radio galaxy evolution. In the GHz Peaked Spectrum and Compact Steep Spectrum objects, in many cases thought to be radio galaxies in the early stages of evolution (Snellen et al. 2003), interactions between their jets and their nuclear environment have been observed (e.g. O’Dea et al. 2002). In the more mature, low-power FR-I type radio galaxies, entrainment of material by a relativistic jet has been suggested as the mechanism responsible for their expanding, decelerating jets and center-brightened radio lobes (e.g. Bicknell 1994). In contrast, in the higher-power FR-II radio galaxies, interactions between the jets and the intergalactic medium terminate the jets in spectacular lobe hot spots, giving these radio galaxies their characteristic edge-brightened large-scale morphologies (i.e. Carilli et al. 1991; Perley et al. 1997).
The jets themselves, and the interaction regions, produce emission via both thermal and non-thermal mechanisms over a wide range of spatial scales, from sub-pc to Mpc. Much of the detailed physics pertaining to relativistic jets in radio galaxies is still uncertain (De Young 2004) and the complexity of the physics involved in interactions between these jets and their environments is underscored by a number of recent theoretical and numerical simulation studies (e.g. Hughes et al. 2002).
With these considerations in mind it is immediately apparent that high spatial resolution, multi-wavelength observations of radio galaxies are a prerequisite for detailed investigations of the physical processes involved. The benefits of high spatial resolution, multi-wavelength observational studies of radio galaxies are illustrated by recent work on the nearby radio galaxies Pictor A (Wilson et al. 2001; Perley et al. 1997) and Centaurus A (Hardcastle et al. 2003).
PKS 2153–69 is one of the few nearby and powerful radio galaxies, a transition FR-I/FR-II object (Fosbury et al. 1998) at a redshift of (Tadhunter et al. 1988). The proximity of PKS 2153–69 ( closer than Pictor A) makes it an ideal object in which to study a relativistic jet and its relationship to its environment. As well as the strong radio lobe hot spots typical of FR-II radio galaxies, PKS 2153–69 also contains one of the best examples of an interaction between a relativistic jet and an extra-nuclear cloud of gas (Tadhunter et al. 1987, 1988; Fosbury et al. 1998, 1990; di Serego Alighieri et al. 1988). Radio and optical imaging by Fosbury et al. (1998) and VLBI observations by Tingay et al. (1996) have provided good evidence that a jet originating at the nucleus of the host galaxy impacts a cloud of gas in the outskirts of the galaxy, possibly the remnant of a merging galaxy. Near the interaction site, an optically emitting cloud (line and continuum) with a complex morphology and ionization structure is seen.
In this paper we present observations that address the twin goals of multi-wavelength coverage and improved spatial resolution. First, comprehensive Chandra X-ray imaging observations of PKS 2153–69 are presented, including analyses of the major X-ray emitting regions of the system: the hot halo, the nucleus, the jet/cloud interaction, and the lobe hot spots. Second, high spatial resolution radio observations (VLBI) are presented that are targeted to the aforementioned regions of interest. In particular, we present the highest linear resolution observation of a radio galaxy lobe hot spot yet produced.
We attempt to produce a coherent physical picture of the jet interaction regions in this radio galaxy by considering the Chandra X-ray data, the VLBI data, archival HST data, and other published data.
2. Observations
2.1. X-ray
PKS 2153–69 was observed by the Chandra X-ray observatory on 2001-08-02 for 14 ks. The nucleus was placed at the aim-point of the ACIS-S detector, and CCDs 2, 3, 5, 6, 7 and 8 were active, in the standard full-frame mode with a frame-time of . The observation was mildly affected by background flares that increased the background count rate to approximately 4/3 the quiescent rate. Since most of the X-ray emitting regions are small we chose not to remove the periods of high background since this would significantly degrade the signal-to-noise ratio. Data were extracted using CIAO 3.0.2 with CALDB 2.26, and analyzed using XSPEC 11.3.0. The degradation of the low energy response of ACIS due to molecular contamination is taken into account using the latest CIAO tools. The Chandra astrometry is excellent and the position of the X-ray nucleus differs from the position of the radio nucleus quoted by Fosbury et al. (1998) by only . When overlaying the radio maps of Fosbury et al. (1998) on our Chandra images we have aligned the brightest pixel in the radio map with the brightest pixel in the Chandra image.
2.2. Radio
PKS 2153–69 was observed with three elements of the Australian Long Baseline Array (LBA) on 2003 February 15: the 22 m Mopra telescope, three of the six 22 m antennas of the Australia Telescope Compact Array (ATCA) tied together as a phased array, and the 64 m Parkes telescope. The observation was conducted over a 6 hour period, the data recorded using the S2 system (Wietfeldt et al. 1996) consisting of dual polarization 16 MHz bands centered at 1400 MHz. Each 16 MHz band was 2-bit sampled, giving an aggregate recorded data rate of 128 Mbps.
The recorded data were shipped to the LBA correlator (Wilson et al. 1996) and correlated using a 5 second integration time and 32 frequency channels across each 16 MHz band. The cross polarization products were not correlated. The synthesized beam, using uniform weighting, gives a restoring beam for imaging of approximately 90 mas 150 mas at a position angle of .
Once correlated, system temperatures and antenna gains were applied to the data in AIPS111The Astronomical Image Processing Software (AIPS) has been developed and is maintained by the National Radio Astronomy Observatory, which is operated by Associated Universities, Inc., under cooperative agreement with the National Science Foundation, to calibrate the visibility amplitudes. Adjustments to the calibration were derived from a short observation of a strong unresolved source (PKS B1921293) and applied to the PKS 2153–69 data. The data were then fringe-fitted in AIPS, each polarization independently. The residual delays and rates were applied to the data before the data were exported to disk. The data were not averaged in time or frequency and all 32 of the 0.5 MHz frequency channels were retained and multi-frequency synthesis techniques are used in the imaging process.
The strong and compact source at the nucleus of the radio galaxy (the phase tracking center used at the correlator) was imaged in DIFMAP (Shepherd 1997), following editing of the data and averaging in time over a 10 second timescale. With only three antennas in the array only phase self-calibration was possible.
The self-calibrated data following imaging of the nuclear radio source were imported into the MIRIAD processing software (Sault et al. 1995). In MIRIAD, a model of the nuclear source was produced in the () plane and was subtracted from the data. Then the data were edited so that the phase-tracking center was shifted, entailing an appropriate re-calculation of () coordinates. Three shifted datasets were produced in this way. The first of the shifted datasets placed the phase-tracking center on the brightest part of the southern lobe of the radio galaxy (the southern lobe hot spot). The second shifted dataset placed the phase-tracking center at the northern lobe hot spot. Finally, the third shifted dataset was centered at the location that marks the point of interaction between the northern jet and a cloud of gas in the host galaxy. The coordinates of these three new phase-tracking centers were estimated from the published ATCA images of Fosbury et al. (1998). In this way, images of these three regions could be formed by Fourier inversion and deconvolution.
2.3. Archived Hubble Space Telescope Image
A Hubble Space Telescope (HST) F606W image of PKS 2153–69 was obtained from the HST archive. This is the same image as presented in the optical/radio comparison of PKS 2153–69 in Fosbury et al. (1998). The HST image was initially cleaned of cosmic rays using the Figaro task bclean. The coordinate system of the HST image was then shifted to align the brightest pixel (; ) with the brightest radio and X-ray pixels (; ).
3. Morphology
3.1. Hot Halo and Radio Lobes
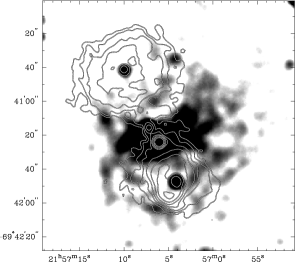
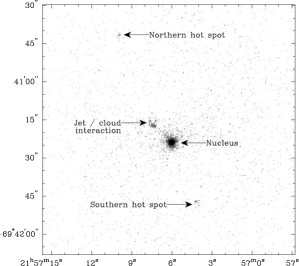
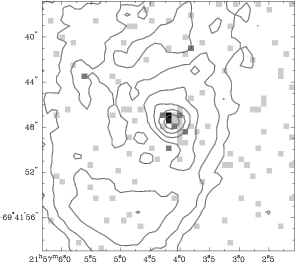
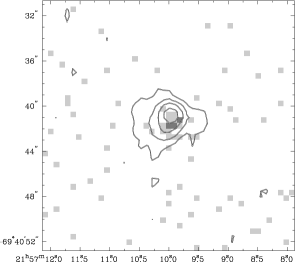
The large scale 0.5 – 7 keV X-ray and 4.7 GHz radio morphologies of PKS 2153–69 are shown in Fig. 1. The radio map shows two lobes, each of which contains a hot spot. The X-ray image shows a halo of hot gas extending out to a radius comparable to that of the radio lobes, approximately . There are depressions in the X-ray surface brightness at the location of the radio lobes suggesting that the radio plasma has inflated cavities in the inter-galactic medium. The southern cavity is completely embedded in the halo gas but the northern cavity appears to have “broken out” of the halo to the northeast and may be less well confined by the halo gas. A higher resolution X-ray image is shown in Fig. 2, and the highlighted regions are discussed below.
3.2. Nucleus
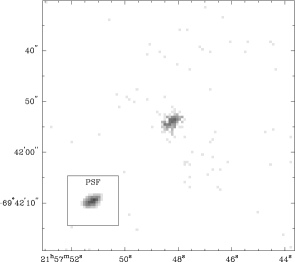
The VLBI observation (Fig. 3) shows that the nuclear radio source consists of a strong unresolved component (the core) and a weaker extension along position angle (the jet). Assuming the jet is continuous and has a spectral index of (), the flux ratio between the jet and counter jet is:
| (1) |
from which we derive:
| (2) |
for the pc scale jet, where is the velocity of the material in the jet and the angle between the jet and the line of sight.
The X-ray nucleus is also spatially extended toward the northeast on a much larger scale (Fig. 4). A more quantitative description of the X-ray morphology of the nucleus is difficult because the ACIS image suffers from pile-up, having an observed count rate of cts .

3.3. Jet/Cloud Interaction Region
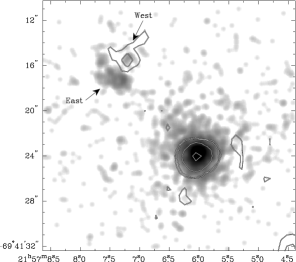
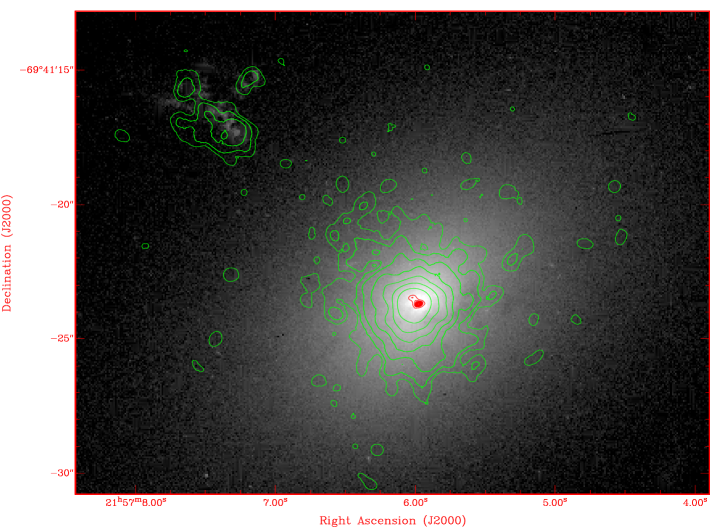
Approximately northeast of the nucleus there are a series of clouds that lie roughly along the position angle of the VLBI jet. The X-ray emission from the clouds can be divided into two regions (Fig. 4). Firstly, centered at a nuclear distance of along P.A. there is a region of X-ray emission that is spatially resolved, with an extent of along the jet direction and an extent of transverse to the jet direction. We shall refer to this region as the eastern component of the jet/cloud interaction region. Secondly, at a nuclear distance of along P.A. (Fig. 4) there is a compact source of X-ray emission. We shall refer to this region as the western component of the jet/cloud interaction region. To test whether the western region is resolved by Chandra we consider the counts within a radius circle and a surrounding annulus of inner radius and outer radius . The region of the annulus that overlaps the eastern component is excluded, and the counts in the remainder of the annulus are scaled to account for the lost area. The background count rate due to the diffuse halo is estimated from a region at a similar nuclear distance to the east of the nucleus. We find that of the counts above the diffuse background level come from within of the western region. This is comparable to that expected for a soft X-ray point source (), so the western component is consistent with being an unresolved point source superimposed on diffuse halo emission. An optical image of the nucleus and jet/cloud interaction region taken with HST is shown in Fig. 5, with contours of Chandra X-ray emission and VLBI 1.4 GHz radio emission overlaid. The HST image (Fig. 5; Fosbury et al. 1998) shows optical emission from a number of filamentary clouds in the region associated with the X-ray emission. Ground-based optical spectra of these filaments show emission lines from a range of very highly ionized ions including strong [Fe X] (Tadhunter et al. 1987, 1988; di Serego Alighieri et al. 1988; Fosbury et al. 1990, 1998). Fosbury et al. (1998) detect radio emission from the western component associated with the unresolved X-ray emission (Fig. 4). Our VLBI observation did not detect any radio emission from the jet/cloud interaction region with a upper limit of 3 mJy/beam.
3.4. Southern Hot Spot
At a nuclear distance of along P.A. (Fig. 6) X-ray emission is seen to approximately coincide with the radio emission from the southern hot spot, although there is a tentative suggestion that the peak of the X-ray emission is slightly closer to the nucleus than the peak of the radio emission (the offset is only Chandra pixel and is at the limit of Chandra’s astrometric accuracy). The VLBI observation detected significant emission from the southern lobe hot spot (Fig. 7). The compact radio emission at the southern lobe hot spot can be adequately represented in the image plane by three circular Gaussian components, separated by approximately 400 mas, one component with a FWHM of 140 mas and a total flux density of 35 mJy, the second component with a FWHM of 220 mas and a total flux density of 65 mJy, and the third component with a FWHM of 100 mas and a total flux density of 10 mJy. The VLBI image of the southern lobe hot spot shown in Fig. 7 is the highest linear resolution image of a radio galaxy lobe hot spot ever produced, to the best of our knowledge. Previously Perley et al. (1997) imaged the western hot spot of Pictor A with the VLA at a wavelength of 2 cm, giving a best angular resolution of 90 mas. The best angular resolution of Fig. 7 is also 90 mas (at a wavelength of 20 cm however), giving a linear resolution approximately better than the Pictor A hot spot since PKS 2153–69 is approximately closer than Pictor A.

3.5. Northern Hot Spot
At a nuclear distance of along P.A. (Fig. 8) faint X-ray emission is seen to approximately coincide with the radio emission from the northern hot spot, although there is a tentative suggestion that the peak of the X-ray emission is slightly closer to the nucleus than the peak of the radio emission, as was the case for the southern hot spot (and also at the limit of Chandra’s astrometric accuracy). Our VLBI observation did not detect any radio emission from this region with a upper limit of 3 mJy/beam. If we assume that the northern lobe hot spot has a similar size and structure as the southern lobe hot spot, we estimate that an upper limit to the total flux density of the compact emission from the northern lobe hot spot is approximately 25 mJy.
4. X-ray Spectra
The extraction regions for the sources and backgrounds are given in Table 1. Any emission which is unrelated to the region of interest was excluded.
| Region | Aperture for | Radius/radii | Range of P.A. | Aperture for | Radius/radii | Range of P.A. |
|---|---|---|---|---|---|---|
| sourceaaAll apertures are centered on the nucleus. | of source | for source | backgroundaaAll apertures are centered on the nucleus. | of background | for background | |
| aperture | aperture | aperture | aperture | |||
| Halo | CirclebbNuclues, jet/cloud interaction region and hot spots omitted. | All | AnnulusccTwo bright point sources omitted. | Inner – | All | |
| (§4.1) | Outer – | |||||
| Nucleus | Circle | All | Annulus | Inner – | All | |
| (§4.2) | Outer – | |||||
| Jet/Cloud | AnnulusddDoes not include the unresolved western component of the jet/cloud interaction region. | Inner – | AnnulusddDoes not include the unresolved western component of the jet/cloud interaction region. | Inner – | ||
| Interaction Region – | Outer – | Outer – | ||||
| Eastern (§4.3) | ||||||
| Jet/Cloud | AnnuluseeDoes not include the eastern component of the jet/cloud interaction region. | Inner – | AnnuluseeDoes not include the eastern component of the jet/cloud interaction region. | Inner – | ||
| Region – | Outer – | Outer – | ||||
| Western (§4.3) |
4.1. Hot Halo
4.2. Nucleus
The nuclear spectrum suffers from the effects of pile-up which are corrected using the routine of Davis (2001) that is available in XSPEC (Arnaud 1996). The spectrum is well described by a power law model with photon index and a 2 – luminosity of absorbed by the Galactic column (see Table 2). This is typical of a “type 1” active galaxy or quasar.
| Region | Model | Parameter | Normalization 22Astronomy Department, University of Maryland, College Park, MD 20742 | Unabsorbed flux | Unabsorbed luminosity | /dof | ||
|---|---|---|---|---|---|---|---|---|
| [] | [] | |||||||
| 0.5 – | 2 – | 0.5 – | 2 – | |||||
| Halo | MEKAL | |||||||
| metallicity | 44.4/60 | |||||||
| Nucleus | PL | 117.7/129 | ||||||
| Jet/cloud (E) | MEKAL | |||||||
| plus PL | 33Adjunct Astronomer, Space Telescope Science Institute, 3700 San Martin Drive, Baltimore, MD 21218 | 3.5/5 | ||||||
4.3. Jet/Cloud Interaction Region
If the spectrum of the extended eastern component is modeled as a power law absorbed by the Galactic column we find that the spectrum is very soft with , although this gives a poor fit with a /dof of 10.5/6. A thermal plasma of solar abundance absorbed by the Galactic column provides a slightly better description of the spectrum with and a /dof of 9.8/6. The poor value of the thermal plasma model is a result of the spectrum being slightly harder than the model, with excess flux around (there are too few counts to model the spectrum above ). An excellent description of the spectrum is obtained if a power law of photon index is added to the thermal plasma model, giving a /dof of 3.5/5 (see Table 2 and Fig. 9). The power law component accounts for approximately 18 per cent of the unabsorbed 0.5 – flux. We do not have sufficient S/N to strongly constrain this hard component, but a power law of photon index is equivalent to a very hot bremsstrahlung component. Thus, an equally good description of the spectrum is obtained by replacing the power law component with a second, high temperature thermal plasma (). Attempting to model the spectrum as a sum of two power law components absorbed by the Galactic column gives an unacceptable /dof of 10.5/4 with significant systematic residuals below where the thermal plasma model has strong iron L shell emission lines. We conclude that the X-ray emission from the extended eastern component of the jet/cloud interaction region may originate from a thermal plasma with , with a weaker high temperature or non-thermal component. An alternative interpretation, discussed in Section 5.4, is that the X-rays from this eastern component are dust-scattered radiation of a blazar X-ray beam from the nucleus. This beam would be directed at the eastern part of the cloud. However, we continue here our discussion of the thermal plasma interpretation.
Assuming the eastern component arises from shock heating of a cold gas cloud we can estimate the shock velocity. The Rankine-Hugoniot shock jump conditions (Landau & Lifshitz 1959) give a shock velocity of
| (3) |
where is the mean mass per particle in units of the proton mass, and we have assumed a fully ionized gas and solar abundances. For a post-shock temperature of we estimate a shock velocity of .

The unresolved western component of the jet/cloud interaction region is too faint to obtain its X-ray spectrum directly, but we can form a hardness ratio based on the number of counts in a soft band (), and the number of counts in a hard band (), given by . We find . If we assume the spectrum is a power law absorbed by the Galactic column this corresponds to . The error bars on and quoted here (and in subsequent sections dealing with hardness ratios) denote the 90 per cent confidence interval assuming independent Poisson statistics for and . If the spectrum is a power law of photon index absorbed by the Galactic column the flux density is at (see Table 3). If, on the other hand, the spectrum is a thermal plasma this hardness ratio corresponds to a temperature of , with the same flux density.
| Region | ||
|---|---|---|
| (Hz) | () | |
| Jet/cloud (west) | 17.4 | |
| Northern hot spot | 17.4 | |
| Southern hot spot | 17.4 |
4.4. Northern and Southern Hot Spots
Neither hot spot has sufficient counts to obtain an X-ray spectrum. We can, however, determine their hardness ratios using the technique and hard and soft bands described in Section 9. We find that the northern hot spot has which, for a power law model absorbed by the Galactic column, corresponds to . The flux density at 1 keV assuming such a spectrum is (see Table 3). Similarly, we find that the southern hot spot has which, for a power law model absorbed by the Galactic column corresponds to . The flux density assuming such a spectrum is (see Table 3).
4.5. The Nearby Galaxy MRC 2153–699
We also detect X-ray emission from the nucleus of the radio galaxy MRC 2153–699 that lies almost to the east of PKS 2153–69 (Fig. 10). The spectrum of MRC 2153–699 is reasonably well described () by an absorbed () power law () with an observed 1 – 5 keV X-ray flux of . Its redshift and therefore luminosity are unknown, although it has been identified with a magnitude galaxy (Jones & McAdam 1992), and imaged in the radio by Fosbury et al. (1998).
5. Discussion
5.1. Hot Halo
The hot halo has a radius of approximately , a temperature of , an electron number density of and a pressure dyn cm-2. The electron density is calculated using the emission measure of the X-ray thermal plasma model and assuming the halo is a uniform density spherical cloud. The total mass of halo gas is , which is probably only a small fraction of the gravitating mass in the halo. If we assume that the depressions in the X-ray emitting halo corresponding to the radio lobes are cavities filled with relativistic radio plasma we can estimate the power of the jet. The sound speed in the halo is . The southern lobe has a radius of , and the southern hot spot is from the nucleus. Using the sound crossing time, , from the nucleus to the southern hot spot as a characteristic timescale we estimate the jet power required to inflate the southern cavity to be , where is the volume of the cavity. Since there are two cavities the total jet power is , which is a factor of below the X-ray luminosity of the nucleus (in the 0.5 – 10 keV band).
5.2. Northern and Southern Hot Spots
The spectral energy distribution of the northern hot spot is shown in Fig. 11. The northern lobe hot spot was not detected in our VLBI observation with an estimated upper limit to the total flux density of the compact emission of approximately 25 mJy (see section 3.5). The more diffuse 4.7 GHz radio emission associated with the northern hot spot has a flux density of 210 mJy and a spectral slope of (the spectral indices measured from the lower resolution radio maps should be interpreted with caution because the observations were not made with matched arrays; Fosbury et al. 1998). A power law model provides a good description of the spectrum, although if the emitting region is spatially unresolved its 1.4 GHz radio flux density should be just below the upper limit.

The spectral energy distribution of the southern hot spot is shown in Fig. 12. The 1.4 GHz flux density of the brightest knot in our VLBI image of the southern hot spot is 65 mJy, which is significantly lower than the 4.7 GHz flux density of 560 mJy reported by Fosbury et al. (1998). This difference in flux densities is just due to the significant difference in beam sizes. If the X-ray emission is associated with the compact knots in the VLBI image we find that a power law model provides an excellent description of the spectrum, with a spectral slope of which is equal to the radio spectral slope estimated by Fosbury et al. (1998). The 1.4 GHz radio to X-ray spectral slope is .

5.3. The jet/cloud interaction
As shown in Figs. 4 and 5, the jet/cloud interaction region in PKS 2153–69 has a complex multi-wavelength structure. The eastern component of the region (Figs. 4 and 5) consists of an ensemble of highly ionized filamentary clouds, with the highest ionization clouds closest to the nucleus (Tadhunter et al. 1988). Spectra of these clouds also reveal the presence of a blue polarized continuum that may be scattered light from the active nucleus (Villar-Martín et al. 2001; Fosbury et al. 1998). In Section 4.3 we concluded that the X-rays observed from the eastern component may come from a thermal plasma with , plus some additional weaker high temperature or non-thermal emission. An alternative, discussed in Section 5.4, is that the X-rays, like the optical continuum, are light from the “blazar” nucleus which has been scattered by dust into our line of sight. The VLBI jet (Section 3.2) is seen to be highly aligned with the set of clouds that make up the eastern component (Tingay et al. 2002, 1996).
The western component of the interaction region (Fig. 5) is dominated by a feature that has a red optical continuum, in contrast to the blue continuum of the eastern component. Radio emission has been observed coincident with the western component by Fosbury et al. (1998) and here we have reported the detection of X-ray emission (Section 4.3), although it is unclear if this emission is thermal or non-thermal in nature. The position angle connecting the nucleus and the western component is approximately less than the position angle of the VLBI jet direction that intersects the center of the eastern component (Fosbury et al. 1998).
Confronted with these facts, can we plausibly identify the region within the ensemble of clouds where the primary jet interaction occurs?
For a start, it appears unlikely that the radio jet has an opening angle that encompasses the entire cloud complex, both the eastern and western components. The opening angle of the nuclear jet, from VLBI Space Observatory Program observations, is very small, less than a few degrees (Tingay et al. 2002). Also, the diameter of the jet at the southern lobe hot spot is presumably less than the measured diameter of the hot spot itself, approximately 200 pc. Therefore, it is likely that the primary site of interaction will be confined to only a small part of the cloud complex. It is likely that many shocks exist within the cloud complex as a result of the jet interaction (Bicknell et al. 1998) and it may be these secondary shocks that are powering the thermal X-ray emission throughout the region.
Previously, it has been suggested that the red continuum of the western component is radiation from a foreground star (di Serego Alighieri et al. 1988). However, the existence of both radio and X-ray emission coincident with this component almost certainly marks it as integral to the cloud complex. Villar-Martín et al. (2001) give an alternative explanation for the red continuum: they suggest that it results from large dust grains scattering red light from the active nucleus, the small dust grains in this component having been destroyed by shocks in a jet/cloud interaction. According to this explanation, the blue continuum of the eastern component is a result of scattering of blue light from the nucleus by small dust grains that are preserved because the eastern component is not as heavily shocked as the western component. Identification of the western component as the primary jet interaction site, via this argument, is consistent with the presence of radio synchrotron emission (increased synchrotron emissivity due to enhanced electron energy and compressed magnetic field in the shocked region) and X-ray emission. Fig. 13 shows the radio to X-ray spectrum for the western component. This spectrum could be plausibly fitted with a power law with the spectral slope given by Fosbury et al. (1998), and an additional optical component of red light from the nucleus scattered by large dust grains (Villar-Martín et al. 2001). There is also thermal X-ray emission from a hot plasma (see Section 4.3). The scattered optical and thermal X-ray emission dominate, and are at least an order of magnitude stronger than the synchrotron emission extrapolated to optical and X-ray wavelengths.


However, there is a problem with identifying the western component as the primary jet interaction site. All VLBI imaging observations of the nuclear radio jet show that it is highly aligned with the eastern component, not the western component. Further, the strongest X-ray emission from the cloud complex comes from the eastern component. The radio to X-ray spectrum of the eastern component is shown in Fig. 14. A solution to this problem might be that radiation beamed from the nucleus along the VLBI jet direction is being scattered by dust into our line of sight giving rise to the observed optical and X-ray emission. We consider this possibility below.
5.4. Dust Scattering
The eastern component of the jet/cloud interaction region is illuminated by radiation beamed along the VLBI jet direction from the nucleus, and some of this radiation may be scattered by dust into our line of sight. The polarized, blue optical continuum is thought to be the result of dust scattering (Villar-Martín et al. 2001), and it is possible that the X-ray emission is also the result of dust scattering. If the radiation beamed from the nucleus has a BL Lac spectrum the ratio of the optical to X-ray flux densities seen by the cloud will be approximately to (Fossati et al. 1998). The differential scattering cross section for blue light is (Draine 2003) for , where denotes per Hydrogen nucleon. Here we have averaged the results for the Milky Way and the LMC plotted in Fig. 3 of Draine (2003). The differential scattering cross section for 0.45 keV X-rays is for , where is the scattering angle and the exponent has been estimated from Fig. 8 of Draine & Tan (2003). These scattering cross sections assume a Milky Way distribution of dust grain sizes and composition. The observed ratio of the optical to X-ray flux density of the eastern component is approximately , and this constrains the scattering angle since
| (4) |
giving for , respectively. Given the uncertainties in the spectral energy distribution of the radiation beamed from the nucleus, the distribution of dust grain sizes and the scattering angle it may be that the X-ray emission from the eastern component represents dust scattering of nuclear light. However, the predicted X-ray intensity is only comparable to that observed if is only a few degrees and there is no evidence that the radio axis of PKS 2153–69 is at such a small angle to the line of sight. If the X-rays are dust scattered, this cloud in PKS 2153–69 would be the first example of this process in an extragalactic context.
5.5. Electron Scattering
Radiation beamed from the nucleus towards the eastern component of the jet/cloud interaction region may be electron scattered into our line of sight as long as the scattering medium is highly ionized, so that soft X-ray absorption is negligible, and has a sufficiently large column density. We consider electron scattering to be unlikely, however, because the spectrum of the eastern region of the jet/cloud interaction region () is much softer and clearly not the same as the spectrum of the nucleus (). The cloud complex might see a much softer spectrum than we do, which is possible if soft X-rays from the nucleus are heavily obscured in our direction but propagate freely to the scattering cloud. The X-ray spectrum of the nucleus, however, does not show additional absorption in excess of the Galactic column, so it is unlikely that there is such an obscured soft X-ray source in the nucleus.
5.6. Jet Precession
A solution to the problem of having two different sites of interaction within the cloud (one for the radiation beam and one for the particle beam) is jet precession. If the jet is slow () and the jet precesses across the cloud complex, a time delay between the photon beam from the nucleus and the particle beam reaching a given part of the cloud complex will exist. Such a scenario may explain the fact that the western component has radio, optical, and X-ray emission consistent with a jet/cloud interaction region, while the eastern component has a high degree of ionization (photoionization from the beamed nuclear radiation, plus a possible contribution from any secondary shocks in the cloud due to the interaction in the western component), and scattered nuclear continuum light.
For this hypothesis to be viable, the jet precession rate must be slow enough that, at present, the direction of the nuclear jet (which is presumed to align with the nuclear photon beam and hence with the photoionized eastern component of the cloud complex) is only 15 – 20∘ in projection from the direction between the nucleus and the western component of the cloud complex, where the jet’s interaction with the cloud is presumed to take place. The light travel time between the nucleus and the cloud complex is approximately years ( is the angle between the jet and our line of sight). During this time the nuclear jet can only have changed its true orientation by less than a few degrees (the angular extent of the eastern cloud as seen from the nucleus), in order to remain in near alignment with the eastern component, giving a rate of change for the jet orientation of ∘ yr-1. Thus, at this rate of change, the jet material that is currently impacting the western component of the cloud system was ejected from the nucleus at least years ago. The inferred speed of the jet is therefore c (averaged over the journey from the nucleus to the cloud system). The jet speed inferred from equation 2 is higher than this for some values of , but at its origin in the nucleus the jet may well be faster than it is several kpc away at the clouds, due to deceleration.
Also the sense of the jet precession (from western to eastern component), if mirrored on the opposite side of the nucleus, follows a curved feature evident in the radio emission that ends at the current terminus of the southern jet in an active lobe hot spot (as seen from the VLBI images). Alternatively this curved feature in the southern lobe could be interpreted as backflow from the lobe hot spot. The jet precession hypothesis predicts that the current nuclear counter-jet (not visible due to beaming effects — see equation 2) should not align with the southern lobe hot spot but should be pointed somewhat to the west of the hot spot. If we assume that the nuclear counter-jet is diametrically opposed to the observed nuclear jet (which is likely given that this is the case for every counter-jet yet observed) then the ATCA images of Fosbury et al. (1998) agree with the prediction. The counter-jet position angle would then be approximately greater than the position angle joining the nucleus and the southern lobe hot spot (Fosbury et al. 1998). At a jet speed of 0.5c, this 19∘ offset represents a jet orientation rate of change very close to that estimated for the northern jet at the cloud complex, and in the same sense. The P.A. of the northern hot spot with respect to the nucleus is lower than the P.A. of the jet/cloud interaction site (the western component) giving an overall “S-shape” to the radio source.
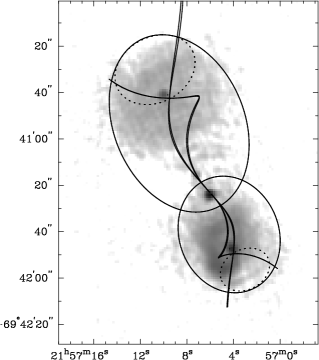
We can extend this argument to the position of the northern hot spot, taking into account the finite jet speed, light travel time and projection effects. Our model consists of symmetric back-to-back ballistic jets moving at constant speed and precessing at a rate with the precessing jet direction forming a cone of half-opening angle . The symmetry axis of the cone is inclined at an angle to our line of sight. The radio lobes are approximated by spheroids and the hot spots are assumed to lie on the surfaces of the spheroids. An additional parameter is the present day azimuthal phase of the jet . Given an inclination and a cone half-opening angle we can solve for , and from trigonometric and light travel time considerations. For all possible values of and we compare the predicted jet path with the observed hot spot positions and pick solutions that have the smallest deviation. There is not a unique solution for and so we choose the one with the largest given the VLBI beaming constraints. These precession solutions for both possible values of and both positive and negative , are shown in Fig. 15. In this model , , and the current inclination angle of the pc-scale jet to our line of sight is . Two solutions have precession rates of ∘ yr-1 and two have ∘ yr-1, where positive implies precession in a clockwise sense. The slower precession rates give the “straighter” curves in Fig. 15, and are in good agreement with the precession rates expected from the jet orientation rates of change estimated above and the geometry adopted for the precession model.
5.7. Jet Deflection
The idea of jet precession, as outlined in the previous section, seems to plausibly explain a great many of the observed features of PKS 2153–69 at X-ray, radio, and optical wavelengths. Previously, Tingay (1997) suggested that the radio morphology of PKS 2153–69 is affected by deflection of the northern jet at the site of the jet/cloud interaction, causing the observed difference between the nuclear jet position angle and the position angle joining the nucleus and the northern lobe hot spot. For the reasons stated above, we feel that jet precession gives a better overall explanation of the multi-wavelength source structure, but we briefly revisit the alternative jet deflection explanation, using the previously unavailable constraints from the X-ray observations.
Under this interpretation, the jet from the nucleus must be deflected through (projected onto the plane of the sky) by the cloud before continuing on to the northern hot spot (Tingay 1997; Tingay et al. 2002). Using some of our measured quantities it is possible to make an estimate of the jet speed at the cloud complex, following the calculations of Bicknell et al. (1998) and Kadler et al. (2003). Using the expressions for the jet power in Bicknell et al. (1998) we estimate a jet power, (assuming , the ratio of monochromatic power at frequency to total jet flux, lies in the range , and the radio flux density at 1.4 GHz is half of the total flux density of the entire source at 1.4 GHz, to reflect the power in only the northern jet). This compares to the erg/s estimated in Section 5.1. The jet speed can then be estimated as,
| (5) |
where is the X-ray luminosity associated with the cloud complex ( between 0.5 and 7 keV), is the shock velocity (which we will take to be the shock velocity of [equation 3] in the eastern part of the cloud complex assuming a thermal interpretation of its X-ray emission) and is described and calculated in Bicknell et al. (1998) for a non-relativistic jet, depending on the jet Mach number, , and the jet deflection angle, . For PKS 215369, taking (Tingay et al. 1996) and , we estimate that .
It is interesting to compare these mildly relativistic jet speeds with the estimate made by Tingay et al. (1996) starting from the assumption of a relativistic jet at the clouds, resulting in . The calculation of Tingay et al. (1996) does not use the X-ray emission as a constraint on the jet energetics (because no suitable observations were available at that point) and considers simple oblique shocks in a relativistic jet.
6. Conclusions
In this paper we present the results of Chandra and 1.4 GHz LBA observations of the radio galaxy PKS 2153–69 and its environment. Our conclusions are summarized below.
1. The Chandra image reveals a roughly spherical halo of hot gas extending out to around PKS 2153–69 with a temperature of , a 0.5 – 2 keV luminosity of and a total gas mass of (the total gravitating mass is likely much larger). Two depressions in the surface brightness of the X-ray halo correspond to the large scale radio lobes, and assuming these are cavities inflated by the jet we infer a total jet power (both sides) of .
2. Both the northern and southern lobe hot spots are detected by Chandra. In addition, the southern hot spot is detected in the 1.4 GHz VLBI observation providing the highest linear resolution image of a radio lobe hot spot to date. The northern hot spot is not detected in the VLBI observation.
3. The X-ray spectrum of the nucleus is well described by a power law of photon index absorbed by the Galactic column, with a 2 – 10 keV X-ray luminosity of . This photon index is typical of a type 1 active galaxy. The 1.4 GHz VLBI image of the nucleus shows a jet on scales along a P.A. of . The absence of a detectable counter-jet constrains the jet speed () and inclination angle to be on pc scales.
4. Approximately northeast of the nucleus, at a position angle intermediate between that of the northern hot spot and the direction of the nuclear jet, X-ray emission is detected from an extra-nuclear cloud. The X-ray emission from the cloud can be divided into two regions, an unresolved western component associated with a knot of radio emission, and a spatially resolved eastern component associated with highly ionized optical line-emitting clouds. The radio spectrum of the western component is consistent with synchrotron emission, with the optical continuum being predominantly red light scattered from nuclear light impinging on the cloud by large dust grains and the X-ray emission being from a hot thermal plasma. The X-ray emission of the eastern component has a 0.5 – 2 keV luminosity of and is very soft ( or ). The eastern component is probably being photoionized by radiation beamed from the nucleus with the polarized blue optical continuum and soft X-ray emission being beamed radiation from the nucleus scattered into our line of sight by dust in the clouds. The interpretation of this soft X-ray emission as dust-scattered nuclear light is speculative and appears to require that the radio axis of PKS 2153–69 is within several degrees of our line of sight. If correct, this is the first detection of dust-scattered X-rays in an extragalactic object. The 1.4 GHz VLBI observation did not detect compact radio emission from the extra-nuclear cloud.
5. We account for the progressive increase of P.A. from the northern hot spot to the western region of the extra-nuclear cloud to the pc-scale radio jet in terms of a jet precession model in which the particle beam interacts with the western component of the jet/cloud interaction region and the radiation beam interacts with the eastern component. The jet speed is estimated to be and the precession rate to be ∘ yr-1. The model is consistent with the location of the southern hot spot, which gives the source an overall “S-shape”. We discuss the alternative possibility of jet deflection.
6. X-ray emission from the nearby radio galaxy MRC 2153-699 is detected in the Chandra image.
Our findings are consistent with and complimentary to the presentation of the X-ray observations in a preprint by Ly et al. (2004) that appeared during the refereeing of our paper.
7. Acknowledgments
We thank R. Fosbury for providing electronic copies of his radio maps. This work was supported by NASA through contract NAS8-01129 and grants NAG8-1027 and NAG5-13065, the Chandra Fellowship Award Number PF3-40026 issued by the Chandra X-ray Observatory Center which is operated by the Smithsonian Astrophysical Observatory for and on behalf of the NASA under contract NAS8-39073, and by a grant from the Research and Development Grants Scheme of the Swinburne University of Technology. The Australia Telescope is funded by the Australian Commonwealth Government for operation as a national facility managed by the CSIRO.
References
- Arnaud (1996) Arnaud, K. A. 1996, in ASP Conf. Ser. 101: Astronomical Data Analysis Software and Systems V, Vol. 5, 17
- Bennett et al. (2003) Bennett, C. L., Halpern, M., Hinshaw, G., Jarosik, N., Kogut, A., Limon, M., Meyer, S. S., Page, L., Spergel, D. N., Tucker, G. S., Wollack, E., Wright, E. L., Barnes, C., Greason, M. R., Hill, R. S., Komatsu, E., Nolta, M. R., Odegard, N., Peiris, H. V., Verde, L., & Weiland, J. L. 2003, ApJS, 148, 1
- Bicknell (1994) Bicknell, G. V. 1994, ApJ, 422, 542
- Bicknell et al. (1998) Bicknell, G. V., Dopita, M. A., Tsvetanov, Z. I., & Sutherland, R. S. 1998, ApJ, 495, 680
- Carilli et al. (1991) Carilli, C. L., Perley, R. A., Dreher, J. W., & Leahy, J. P. 1991, ApJ, 383, 554
- Davis (2001) Davis, J. E. 2001, ApJ, 562, 575
- De Young (2004) De Young, D. S. 2004, to appear in “X-Ray and Radio Connections”, eds. L. Sjouwerman and K. Dyer
- di Serego Alighieri et al. (1988) di Serego Alighieri, S., Courvoisier, T. J.-L., Fosbury, R. A. E., Tadhunter, C. N., & Binette, L. 1988, Nature, 334, 591
- Dickey & Lockman (1990) Dickey, J. M. & Lockman, F. J. 1990, ARA&A, 28, 215
- Draine (2003) Draine, B. T. 2003, ApJ, 598, 1017
- Draine & Tan (2003) Draine, B. T. & Tan, J. C. 2003, ApJ, 594, 347
- Fosbury et al. (1990) Fosbury, R. A. E., Di Serego Alighieri, S., Courvoisier, T. J.-L., Snijders, M. A. J., Tadhunter, C. N., Walsh, J., & Wilson, W. 1990, in Evolution in Astrophysics: IUE Astronomy in the Era of New Space Missions, 513–516
- Fosbury et al. (1998) Fosbury, R. A. E., Morganti, R., Wilson, W., Ekers, R. D., di Serego Alighieri, S., & Tadhunter, C. N. 1998, MNRAS, 296, 701
- Fossati et al. (1998) Fossati, G., Maraschi, L., Celotti, A., Comastri, A., & Ghisellini, G. 1998, MNRAS, 299, 433
- Hardcastle et al. (2003) Hardcastle, M. J., Worrall, D. M., Kraft, R. P., Forman, W. R., Jones, C., & Murray, S. S. 2003, ApJ, 593, 169
- Henriksen et al. (1981) Henriksen, R. N., Vallee, J. P., & Bridle, A. H. 1981, ApJ, 249, 40
- Hughes et al. (2002) Hughes, P. A., Miller, M. A., & Duncan, G. C. 2002, ApJ, 572, 713
- Jones & McAdam (1992) Jones, P. A. & McAdam, W. B. 1992, ApJS, 80, 137
- Kaastra (1992) Kaastra, J. S. 1992, in Internal SRON-Leiden Report, updated version 2.0
- Kadler et al. (2003) Kadler, M., Ros, E., Kerp, J., Falcke, H., Zensus, J. A., Pogge, R. W., & Bicknell, G. V. 2003, New Astronomy Review, 47, 569
- Landau & Lifshitz (1959) Landau, L. D. & Lifshitz, E. M. 1959, Fluid mechanics (Course of theoretical physics, Oxford: Pergamon Press, 1959)
- Liedahl et al. (1995) Liedahl, D. A., Osterheld, A. L., & Goldstein, W. H. 1995, ApJ, 438, L115
- Ly et al. (2004) Ly, C., De Young, D., & Bechtold, J. 2004, ArXiv Astrophysics e-prints, astro-ph/0409272
- Mewe et al. (1985) Mewe, R., Gronenschild, E. H. B. M., & van den Oord, G. H. J. 1985, A&AS, 62, 197
- Mewe et al. (1986) Mewe, R., Lemen, J. R., & van den Oord, G. H. J. 1986, A&AS, 65, 511
- O’Dea et al. (2002) O’Dea, C. P., de Vries, W. H., Koekemoer, A. M., Baum, S. A., & Mack, J. 2002, in Revista Mexicana de Astronomia y Astrofisica Conference Series, 196–202
- Perley et al. (1997) Perley, R. A., Röser, H., & Meisenheimer, K. 1997, A&A, 328, 12
- Sault et al. (1995) Sault, R. J., Teuben, P. J., & Wright, M. C. H. 1995, in ASP Conf. Ser. 77: Astronomical Data Analysis Software and Systems IV, 433
- Shepherd (1997) Shepherd, M. C. 1997, in ASP Conf. Ser. 125: Astronomical Data Analysis Software and Systems VI, 77
- Snellen et al. (2003) Snellen, I. A. G., Mack, K.-H., Schilizzi, R. T., & Tschager, W. 2003, Publications of the Astronomical Society of Australia, 20, 38
- Tadhunter et al. (1987) Tadhunter, C. N., Fosbury, R. A. E., Binette, L., Danziger, I. J., & Robinson, A. 1987, Nature, 325, 504
- Tadhunter et al. (1988) Tadhunter, C. N., Fosbury, R. A. E., di Serego Alighieri, S., Bland, J., Danziger, I. J., Goss, W. M., McAdam, W. B., & Snijders, M. A. J. 1988, MNRAS, 235, 403
- Tingay (1997) Tingay, S. J. 1997, A&A, 327, 550
- Tingay et al. (1996) Tingay, S. J., Jauncey, D. L., Reynolds, J. E., Tzioumis, A. K., Migenes, V., Gough, R., Lovell, J. E. J., McCulloch, P. M., Costa, M. E., Preston, R. A., & Harbison, P. 1996, AJ, 111, 718
- Tingay et al. (2002) Tingay, S. J., Reynolds, J. E., Tzioumis, A. K., Jauncey, D. L., Lovell, J. E. J., Dodson, R., Costa, M. E., McCulloch, P. M., Edwards, P. G., Hirabayashi, H., Murphy, D. W., Preston, R. A., Piner, B. G., Nicolson, G. D., Quick, J. F. H., Kobayashi, H., & Shibata, K. M. 2002, ApJS, 141, 311
- Villar-Martín et al. (2001) Villar-Martín, M., De Young, D., Alonso-Herrero, A., Allen, M., & Binette, L. 2001, MNRAS, 328, 848
- Wietfeldt et al. (1996) Wietfeldt, R. D., Baer, D., Cannon, W. H., Feil, G., Jakovina, R., Leone, P., Newby, P. S., & Tan, H. 1996, IEEE Transactions on Instrumentation and Measurement, 45(6), 923
- Wilson & Ulvestad (1982) Wilson, A. S. & Ulvestad, J. S. 1982, ApJ, 263, 576
- Wilson et al. (2001) Wilson, A. S., Young, A. J., & Shopbell, P. L. 2001, ApJ, 547, 740
- Wilson et al. (1996) Wilson, W., Roberts, P., & Davies, E. 1996, in Proceedings of the 4th APT Workshop, ed. E. King, 16