X-ray Observations of the Bright Old Nova V603 Aquilae
Abstract
We report on our Chandra and RXTE observations of the bright old nova, V603 Aql, performed in 2001 April, supplemented by our analysis of archival X-ray data on this object. We find that the RXTE data are contaminated by the Galactic Ridge X-ray emission. After accounting for this effect, we find a high level of aperiodic variability in the RXTE data, at a level consistent with the uncontaminated Chandra data. The Chandra HETG spectrum clearly originates in a multi-temperature plasma. We constrain the possible emission measure distribution of the plasma through a combination of global and local fits. The X-ray luminosity and the spectral shape of V603 Aql resemble those of SS Cyg in transition between quiescence and outburst. The fact that the X-ray flux variability is only weakly energy dependent can be interpreted by supposing that the variability is due to changes in the maximum temperature of the plasma. The plasma density is likely to be high, and the emission region is likely to be compact. Finally, the apparent overabundance of Ne is consistent with V603 Aql being a young system.
1 Introduction
Cataclysmic variables (CVs) are interacting binary systems in which a white dwarf primary accretes from a Roche-lobe filling, late-type secondary (see Warner 1995 for a comprehensive review). In the majority of CVs, the magnetic field of the primary is not strong enough to control the accretion flow. In such systems (non-magnetic CVs), accretion proceeds via a Keplerian disk, which radiates half the available potential energy mostly in the optical and UV. The other half of the potential energy is in principle available to power the boundary layer between the disk and the white dwarf (Patterson & Raymond, 1985a, b). It is the likely source of X-rays that are observed in nearby non-magnetic CVs, since the accretion disk is not hot enough to be a significant source of X-rays. There are, however, important questions regarding the validity of this simple interpretation. X-ray observations are an essential tool that may help advance our understanding of the accretion onto the white dwarfs in CVs in general, and the nature of the boundary layer in particular.
A subset of CVs have been discovered as classical novae. These eruptions are due to thermonuclear runaway of hydrogen-rich material accreted on to the primary of a CV. V603 Aql was the brightest classical nova of the 20th century during its eruption (as Nova Aquilae 1918). Classical novae are spectacular laboratories of thermonuclear reactions, and make some notable contributions to the chemical evolution of the interstellar medium. However, the outburst characteristics, such as the energetics, the duration, and nucleosynthesis yields, all depend on the details of the accretion processes in quiescence, including their quiescent mass accretion rate (). This is an important motivating factor in attempting to learn as much about the nova systems in quiescence.
Various authors have claimed V603 Aql to be magnetic; however, none of these claims have been verified by later, more sensitive, observations. The claim of periodicity in polarization by Haefner & Metz (1985) has been disproved by more sensitive observations by Cropper (1986) and by Naylor et al. (1996). Although there is a real modulation of the X-ray flux with a 60 minute timescale in in the Einstein data (Udalski & Schwarzenberg-Czerny, 1989), this modulation is neither persistent nor periodic, hence V603 Aql should be considered a non-magnetic CV (Borczyk et al. 2003; §4.1).
V603 Aql is the brightest old (=quiescent) nova in the optical, UV and X-ray wavelengths. It is also relatively nearby; Hubble & Duncan (1927) have estimated a distance of 360 pc using the expansion parallax method. The statistical error is negligible in this estimate, although there is a systematic error due to departure from spherical symmetry in nova ejecta (Wade et al., 2000). Harrison & Gerz (1988) estimate = 430 pc using the correlation between the absolute magnitude and the rate of decline of classical novae ( = 8 days; Dürbeck 1988). At such a distance, Hipparcos parallax measurement does not lead to a more precise estimate ( = 237 pc; Dürbeck 1999). In this paper, we adopt the Hubble & Duncan (1927) value of 360 pc as the fiducial distance.
V603 Aql is also a permanent superhumper showing both positive and negative superhumps (Patterson et al, 1997; Patterson, 1999), suggesting a well-established disk with high simultaneously undergoing apsidal and nodal precessions. Ferland et al. (1982) inferred a total disk luminosity of 1035 ergs s-1 from UV data, requiring g s-1. V603 Aql has been observed in X-rays with Einstein, EXOSAT ROSAT PSPC, ASCA, and RXTE. Drechsel et al. (1983) found the source to be 3 times brighter in Einstein IPC in their observation ( 0.7 ct s-1, 1981 March) than in 1979 Oct ( 0.3 ct s-1). Drechsel et al. (1983) also inferred a very hard (kT20 keV) spectrum from IPC and MPC data, and a total flux of L egs s-1, a conclusion that we now consider suspect (§3.1). Note that even this luminosity can be generated by an accretion rate onto the white dwarf () of g s-1, much lower than that inferred from the accretion disk data.
V603 Aql is the second brightest non-magnetic CV observed with ASCA (Baskill et al., 2004), which makes it a prime candidate for detailed X-ray spectroscopy. In this paper, we present the result of our Chandra X-ray Observatory High Energy Transmission Grating (HETG) observation of V603 Aql, with contemporaneous monitoring campaign using RXTE. We also briefly describe archival ASCA and RXTE data on V603 Aql.
2 Observations
V603 Aql was observed with ASCA (Tanaka et al., 1994) during 1996 October 8–10 over a period of approximately 34 hrs. After standard screening, we have extaracted 64 s bin light curves in 2 bands (2 keV and 2 keV) as well as over the entire ASCA energy range (0.5–10 keV), combining data from all 4 instrument. We have also extracted 2 spectra, one for the 2 GISs combined and the other for the 2 SISs combined, and associated response files. This observation is also featured by Baskill et al. (2004), who have analyzed the complete set of ASCA observations of non-magnetic CVs.
V603 Aql was observed 3 times with RXTE (Bradt et al., 1993) during 1998 December 5–7, each over a period of 6–7 hours, and over 52 hours of total elapsed time. We have analyzed only the data obtained with the Proportional Counter Array (PCA; Jahoda et al. 1996), which consists of 5 Proportional Counter Units (PCUs). We have applied the standard screening criteria, after which we have accumulated 41 ksec of exposure. The background was estimated using the faint source model using calibration file dated 2003 March 30.
We have observed V603 Aql with Chandra (Weisskopf et al., 2002) using the High Energy Transmission Gratings (HETG; Markert et al. 1994) and with the ACIS-S CCD array as detector (Garmire et al., 2003) on 2001 April 19/20 over a span of 18 hrs. Because Chandra is in a high orbit, there were no interruptions during the observation, resulting in an exposure of 63.5 ksec. We have used the pipeline-produced evt2 and pha2 files and used CIAO 3.0.2 with caldb 2.26 to generate the response file, which includes a calibration of the contaminant on the ACIS detector. We have combined 1st orders of High Energy Grating (HEG) data into one spectral file, with the response file appropriately combined; similarly for Medium Energy Grating (MEG) data, with the 1st orders combined. This observation was previously included in a comparative study of Chandra HETG spectra of 7 CVs (Mukai et al., 2003).
Near the time of the Chandra observation, we have monitored V603 Aql with RXTE. We have obtained twenty short observations over 2001 April 17 through 22, each resulting in a typical exposure time of 2–3 ksec, for a total of 55.4 ksec of good time. For these as well as for the 1998 RXTE observations, light curves are presented in the form of cts s-1 per PCU, since variable numbers of PCUs were active at any given time. In addition, for the 2001 observations, we have excluded the data taken with PCU0, as the propane leak in this detector makes background subtraction problematical111See http://rxte.gsfc.nasa.gov/docs/xte/oldnews/pcu_0.html..
3 Analysis and Results
3.1 Contamination in Non-imaging X-ray Data
V603 Aql is located in a crowded region near the Galactic plane (at , ). Background subtractions for RXTE PCA data are performed using a model that accounts for the time-variable particle background and for the average, high-latitude, cosmic X-ray background. Galactic diffuse emission remains in the “background subtracted” data, as well as any specific X-ray sources that are in the field-of-view. The latter includes the supernova remnant Kes 79 (Seward et al., 2003), 53.8′ away, consisting of a thermal shell and a soft, central point source. This source is probably too soft and too distant to have a significant impact. More worrisome is the recurrent transient X-ray pulsar, GS 1843+009 (Israel et al. (2001) and references therein), located 52.2′ away from V603 Aql. During an outburst, this pulsar can be much brighter than V603 Aql, particularly at high energies since GS 1843+009 is a hard source, and can strongly contribute to the counts of non-imaging observations aimed at V603 Aql.
It is quite possible that the Einstein MPC data, taken in 1981 March and is reported by Drechsel et al. (1983), were strongly contaminated by GS 1843+009, which was unknown at the time (its discovery was in 1988; Koyama et al. 1990). Note that the MPC has a relatively wide (1.5∘ FWHM) filed-of-view and there are no contemporary all-sky monitor data. The high apparent ratio of MPC to IPC count rates (3.24/0.71) and the hard spectral shape inferred from the MPC data are both incompatible with our findings below. Either V603 Aql was in a different state in 1981 March, or the MPC data were contaminated by a hard source, such as GS 1843+009. We have extracted the MPC data from HEASARC and searched for the 29.5 s spin period of GS 1843+009; although we do not see the period, this unfortunately still allows the possibility of a significant contamination by this pulsar, since the pulse fraction of GS 1843+009 is unusually small (4% peak-to-peak; Koyama et al. 1990).
RXTE PCA is less susceptible to contamination by this source, because of its narrower field-of-view (1∘ FWHM). Moreover, we have checked RXTE ASM data to ensure that, at the time of these RXTE observations, GS 1843+009 was not in an active state. Although we cannot exclude contamination at a low level by GS 1843+009 or another source, it probably is not a major concern.
However, the PCA data are contaminated by the apparently diffuse, “Galactic Ridge” X-ray emission (Warwick et al., 1985; Valinia & Marshall, 1998). From Figure 1 of Warwick et al. (1985), we estimate a 2–6 keV flux of the Ridge of order 7 ergs s-1cm-2 per EXOSAT ME beam (45′ FWHM) near V603 Aql. Taking into account the larger beam size of RXTE PCA (1∘ FWHM), we expect of order 2 cts s-1 per PCU from the Ridge in the observations of V603 Aql222Similarly, the Ridge definitely contributed significantly to the observed Einstein MPC count rate. However, the Ridge spectrum is quite similar to that of V603 Aql, so a contribution from GS 1843+009 remains a likely possibility.. Although the average spectrum of the Ridge has been precisely characterized, the fact that there are at least two components whose relative importance is a function of Galactic coordinates (Valinia & Marshall, 1998) makes it difficult to subtract the Ridge contamination with confidence. In the rest of this work, we will use the RXTE data primarily to discuss the short timescale, relative variability of V603 Aql.
3.2 Variability
Despite the above considerations, the long-term variability of V603 Aql is well established through imaging observations (Orio et al., 2001), for example by the different count rates recorded by the ROSAT PSPC. Here we investigate short-term (5 days or less) variabilites using ASCA, RXTE, and Chandra data.
We present the 64 s bin ASCA light (0.5–10 keV) in Figure 1. A significant variability is obvious: although the average count rate is 2.22 ct s-1, values ranging from 0.1 to 7.0 ct s-1 (64 s bins, all 4 instruments and all photon energies combined) are seen. Despite the strong variability, there is no single stable period in this data (Baskill et al., 2004). We have also investigated the energy dependence of this variability. In Figure 2, we plot the softness ratio (counts below 2 keV divided the 2–10 keV counts) against the 2–10 keV count rate. Except at the lowest count rates, this plot is relatively flat, and shows a slight softening trend when the count rate is lower. This rules out changes in photoelectric absorption, which would predict a strong hardening at lower count rates, as a major cause of variability.
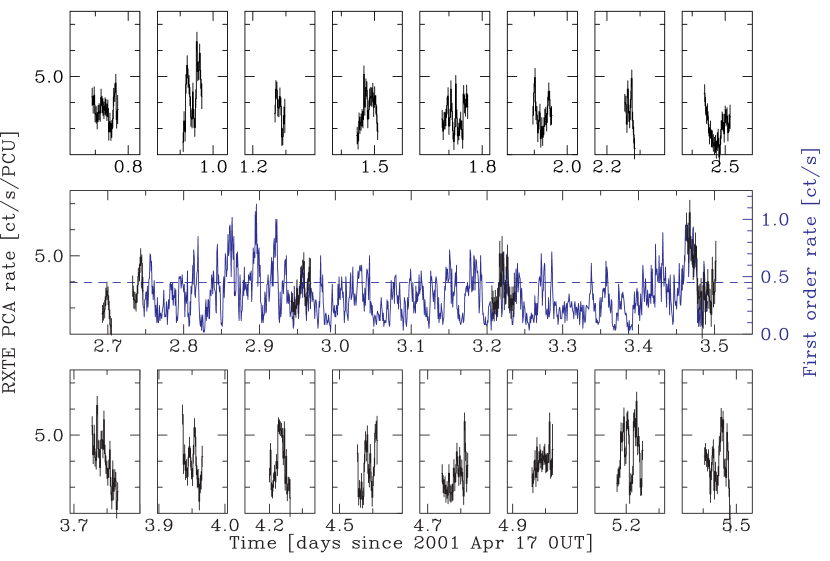
We present the light curve of the 1998 RXTE observations in Figure 3. As the light curve contains counts due to the Galactic Ridge, we have chosen 2.0 (the estimated Ridge contribution) as the origin of the Y axis. With this offset, the high level of variability is apparent, including a large flare-like event at the beginning of the first observation.
Although not the main strength, the Chandra HETG/ACIS-S observation provides an uninterrupted light curve of V603 Aql. Because the zeroth order (undispersed) image is heavily affected by pile-up, we restrict our analysis to the first order photons. We have combined the HETG 1st order light curve and the 2001 PCA light curves into a single figure (Figure 4). Of the 20 separate RXTE pointings, 4 overlapped in time with the Chandra observation. The middle panel shows the light curves of V603 Aql during this interval, both using the HETG (blue) and the PCA (black), the latter plotted with the 2 ct s-1 per PCU offset as before. These two light curves overlap closely. This suggests that our estimate of the Galactic Ridge contribution to the PCA data is a reasonable one. Moreover, any energy dependence of the variability must be small, since the two instruments are sensitive to different energy ranges.
To investigate the energy dependence of the variability further, we have extracted spectra from the Chandra HETG (MEG) data from the high and low states, defined as when the total 1st order count rate was higher than/lower than 0.45 ct s-1 (as shown by the dashed line in the middle panel of Figure 4). This ratio is shown as a function of the wavelength in Figure 5 in the 1.5–17.2Å (0.72–8 keV) range. We confirm the ASCA result (Figure 2) of mild energy dependence. With this definition of high and low states, the high state spectrum is somewhat harder: a linear fit to the trend suggests high/low ratio is 20% higher at 8 keV than at 1 keV. We reach a similar conclusion from the energy independence of the variability in the RXTE PCA data (without subtracting the Galactic Ridge, whose precise spectrum at the location of V603 Aql is uncertain). This suggests again that the variability of V603 Aql is only mildly energy dependent, and also that the spectra of V603 Aql and of the Galactic Ridge are similar, barring an unfortunate coincidence.
We present the power spectra (using the definition of Scargle 1982) from the 1998 and 2001 observations in Figure 6. Baskill et al. (2004) contains a corresponding power spectrum plot from the ASCA observation. We confirm their finding that there is no coherent periodicity in the X-ray data of V603 Aql. In particular, the power spectrum of the Chandra data does not suffer from the aliasing problem that plagues low Earth orbit satellite data, and thus the multiple peaks seen in the bottom panel between 0.2–0.5 mHz (periods in the 2000–5000 s range) must be taken at face value. That is, V603 Aql shows strong variability on these timescales, which however is not due to a single, coherent period.
In addition, we have attempted to verify the tentative detection of power at 60 hrs (Orio et al., 2001) using the 2001 RXTE campaign, but failed to do so. This is in part due to the the combination of the powers at higher frequencies (0.2–0.5 mHz) and our sampling pattern. We also note that the earlier claim was based on ROSAT data, which leaves open the possibility of a soft X-ray absorption event that would be undetectable with RXTE. Finally, the highest peak in the Chandra power spectrum corresponds to a period of 25,000 s. This is a significant fraction of the duration of our Chandra data, so we caution against overinterpreting this peak.
3.3 Spectroscopy
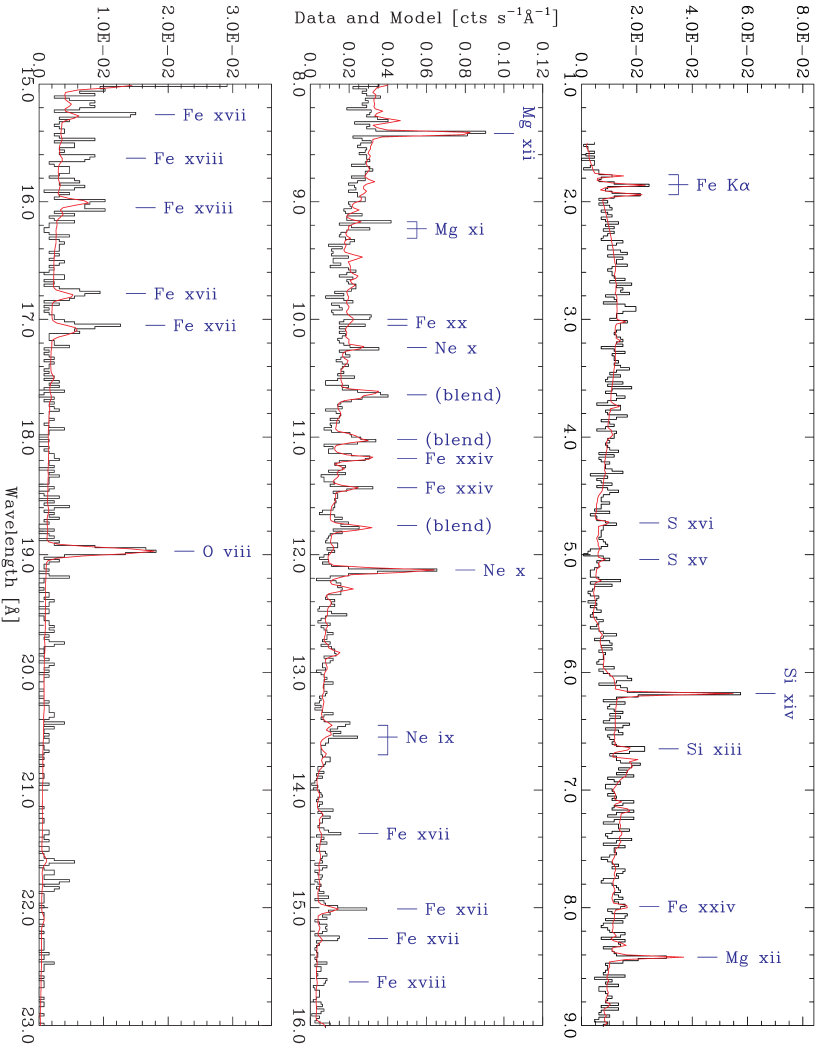
We show the average Chandra HETG/ACIS spectrum of V603 Aql in Figure 7. The line-rich nature of its spectrum is obvious. The He-like and cold Fe K lines are strongly detected, as well as a weaker H-like Fe K. The H-like lines of Si, Mg, Ne and O are prominent, while their He-like counterparts are detected but significantly weaker. In addition, many Fe L-shell lines are detected in the 10–17 Å range. This overall appearance is that of an X-ray emission from multi-temperature, collisionally excited plasma, as was noted earlier by Mukai et al. (2003).
We have analyzed this spectrum using two complementary methods. In one, we have characterized individual lines through local fits, using an unabsorbed power law continuum and Gaussian lines. In the second method, we have performed a global fit using the variable abundance version of the cooling flow model (vmkcfl) with the Gaussian broadening function (gsmooth), as well as an additional Gaussian representing the fluorescent Fe line at 6.4 keV.
In principle, we can derive several quantities from the global fit. Chief among them are the maximum temperature of the plasma, the global mass accretion rate, and the various elemental abundances. We do not detect a significant interstellar absorption; in fact, our upper limit ( cm-2) is considerably smaller than the value of 6–8 cm-2 inferred from ROSAT PSPC data by Orio et al. (2001). This may indicate a possible problem with the calibration of contaminant for Chandra HETG/ACIS-S data, which would be a source of systematic errors in the low energy results, both from global and local fits. We also obtain only an upper limit for the minimum temperature, . The fact that the model is pegged at its hard lower limit (0.0808 keV) suggests the limitation in the grid of models, in addition to the lack of sensitivity of HETG to such low temperature components, may be playing a role. The maximum temperature is found to be 20.3 keV. As for the abundance values, we only report our results for Ne and Fe, two elements that are clearly non-solar relative to the fiducial values of Anders & Grevesse (1989). Other abundances are consistent with solar, although the best-fit values may deviate from 1.0 by 0.1 or more. The accretion rate of the plasma that is emitting the observed X-rays is determined to be 8.00 M⊙ yr-1 for the assumed distance of 360 pc. We present a summary of the global fit results in Table 2, with formal 90% confidence errors, and further consider the reliability and the implications of this procedure in §4.2 below.
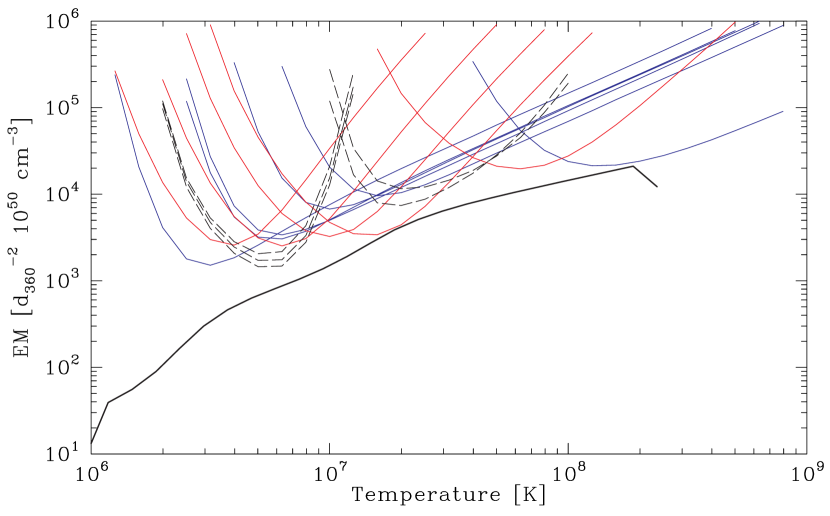
We list all the lines that are confidently detected in Table 3. For each line, we list the probable identification, observed wavelength, the velocity width, and the photon flux according to the local fit. These lines are also labelled in Figure 7. The measured flux of a line can be combined with the theoretical curve of its emissivity in a collisionally excited plasma as a function of plasma temperature to draw a curve on the temperature – emission measure plane (Figure 8). For Ne and Fe, we have used the best-fit abundance values from the global fit in placing these curves. Any point on one of these curves represents the maximum emission measure a plasma of that temperature can have, before predicting more flux in that line than is observed. For multi-temperature plasma, emission measures must be summed at several discrete temperatures or integrated over the relevant range. This is analogous to the differential emission measure (DEM) distribution analysis favored for the study of stellar coronae (see, e.g., Griffiths & Jordan 1998). Note, however, we have not derived the true DEM distribution unambiguously. What we have done here is to constrain the shape of the DEM distribution from local fits, and to fit a discrete approximation of the DEM distribution appropriate for a isobaric cooling flow. Note also that our data for V603 Aql mixes lines from different elements, and lines of different types, and this complicates the interpretation. Nevertheless, we find it satisfactory that the line from the global fit parallels the locus defined by the series of parabola-like curves derived from individual line fluxes, with an appropriate offset (a factor of 4, which is roughly the number of temperature steps of the global model within the typical width of the parabola-like curves).
It is also possible to study selected lines in greater detail. In Figure 9, we present a close-up view of the Fe K region of the spectrum as observed with the HEG. The equivalent width of the fluorescent (6.4 keV, or 1.98Å) line is 150 eV, which is what is expected of reflection off a surface that subtends a 2 steradian as seen from the primary X-ray source, if the Fe abundance is roughly solar. In Figure 10, we present close-up views of the He-like triplet regions for Mg and Ne. In both cases, we detect lines near the expected wavelength of the forbidden component. However, there appears to be an offset. Given this, the possibility that these apparent detections are due to interlopers should be kept in mind. We place an upper limit to the flux of the forbidden component at laboratory wavelength of 2.8 photons cm-2s-1 for Mg XI and 3.0 photons cm-2s-1 for Ne IX, respectively. We explore the possible implications further in §4.4 below.
The line width is generally small. Most lines are consistent with a velocity width of order 200–300 km s-1. This is not surprising given the low inclination angle of V603 Aql (; Patterson et al 1993). The exceptions are the Fe fluorescent line and several observed lines that are likely to be blends.
Finally, we confirm that the same spectral model can be used to fit the ASCA spectra (those taken with GIS and with SIS) of V603 Aql. We obtain an acceptable fit just by adjusting the NH and the participating mass accretion rate. The former is likely due to calibration issues (both for ASCA and for Chandra), while the latter is not surprising, given the high level of variability known in this system. We obtain a participating mass accretion rate of M⊙ yr-1 during the ASCA observation. We can also fit the Ridge-contaminated RXTE data with the same model, again suggesting the close similarity between the spectra of V603 Aql and the Ridge, but we refrain from further interpretation due to this contamination problem.
4 Discussion
4.1 Confirmation of the non-magnetic nature of V603 Aql
Our analysis of X-ray curves fails to show a persistent periodicity. Although the power spectra of individual observations often show prominent peaks, there is no single period that appears in all observations. Instead, the power spectrum of our Chandra data show the simultaneous presence of many peaks. Moreover, the nature of X-ray variability in V603 Aql is atypical for an IP. If there is an energy dependence in the X-ray variability of V603 Aql, it is rather subtle; a strong energy dependence, on the other hand, is a common characteristic of IPs.
Combined with other recent X-ray results (Borczyk et al., 2003; Baskill et al., 2004), as well as non-detection of polarization (Cropper, 1986; Naylor et al., 1996), we affirm the conclusion that V603 Aql is a non-magnetic CV. The earlier results are likely correct in finding power at certain frequencies in the X-ray data, but are incorrect in interpreting the power spectrum as evidence of a single, coherent, underlying clock. We consider the nature of the hard X-ray variability further in §4.3 below.
4.2 Interpreting the Global Fit Results
Scientifically, the fact that we must assume a physical model for the X-ray emission in a global fitting approach is both its strength and its weakness. It allows physical interpretations of the fit results, on the one hand. On the other hand, the interpretations are only as good as the set of assumptions one has adopted. In our global fits, we have assumed a isobaric cooling flow with no additional heating or cooling mechanisms, absorbed only by the interstellar medium. Several authors have already explored alternative assumptions while analyzing the Chandra HETG data of other CVs (Perna et al., 2003; Homer et al., 2004). Moreover, we cannot rule out the more simple model in which the emission measure is a power law function of temperature (cevmkl model in xspec; see, for example, Baskill et al. 2004). As Figure 8 shows, the isobaric cooling flow model deviates only mildly from a power law above temperature of 3K, where the HETG data have good sensitivity. In this respect, we note that our best-fit global model fails to reproduce the observed Fe XVII line fluxes (Figure 7), and that a cevmkl model with a reduced O abundance is a viable model. Nevertheless, we discuss below our global fits using the isobaric cooling flow model, since it appears adequately to describe our data and has a physical interpretation.
The numerical complexity and the degeneracy of model parameters are further factors limiting what one can achieve with global fits. For example, the maximum temperature (kTmax) can only be constrained if the overall abundance is fixed at an assumed value. This is because, for the likely range of kTmax (10 keV), the hottest plasma contributes little line fluxes, and the continuum shape within the Chandra HETG band changes only moderately. The main effect of increasing kTmax is to reduce the equivalent widths of the lines, which can also result from lower abundances. We have therefore fixed the abundances to the solar values of Anders & Grevesse (1989), with the exception of Ne and Fe. Moreover, we have not included reflection in our fits, since Chandra HETG has little sensitivity to reflected continuum, even though the strength of the 6.4 keV line indicates that reflection must be occurring in V603 Aql. Given these assumptions, kTmax is tightly constrained. Unlike in magnetic CVs, however, there is no obvious and simple relationship linking kTmax with the white dwarf mass; this would require a knowledge of exactly how the plasma is shocked in an accretion disk boundary layer.
The total mass accretion rate that participate in the cooling flow is well constrained, for the same solar abundance assumption, and for the assumed distance. However, as we discuss in §4.4, some of the lines have the potential as plasma diagnostics; the other side of the coin is that the cooling flow model fit, which does not account for effects of line opacity, photoexcitation etc., may not be completely reliable. Moreover, the lines may have variable widths and/or profiles, which could skew our fit results: physically, we expect the plasma to continue to decelerate as it cools, so the line width should be a function of the typical temperature needed to emit that line. We approximate this using the xspec convolution model, gsmooth, which allows the line width to be a function of the photon energy of that line. These obviously are not the same thing. However, the unconfused lines are marginally resolved at best in our data (see Table 3), so this is probably not a major concern.
With these caveats, the mass accretion rate in the cooling flow is tightly constrained in our global fit ( M⊙ yr-1 or g s-1). In addition, the observed luminosity in the 1.0–7.0 keV band is 1.88 ergs s-1, depending only on the assumed , and hence is more robust. That is, V603 Aql is hard X-ray luminous for a non-magnetic CV. In particular, V603 Aql is significantly more luminous than the dwarf nova Z Cam in outburst (6 ergs s-1; Baskill et al. 2001) or the inferred hard X-ray component of the nova-like system, UX UMa (1.26 ergs s-1; Pratt et al. 2004).
SS Cyg has a 3–20 keV luminosity of 3–9 ergs s-1 during the peak of normal outbursts (Wheatley et al., 2003; McGowan et al., 2004), again fainter than V603 Aql. SS Cyg, however, has been observed at X-ray luminosity comparable to that of V603 Aql: in the 1993 May ASCA observation obtained towards the end of an anomalous outburst (Nousek et al., 1994; Baskill et al., 2004) and transitions into and out of outburst (Wheatley et al., 2003; McGowan et al., 2004). Thus, SS Cyg has three main X-ray/optical states. In the presumed order of increasing mass accretion rate onto the white dwarf, these are: the quiescence, the transition, and the outburst peak. Of these three, V603 Aql resembles the transition most closely, in terms of its X-ray luminosity and its X-ray spectrum. The lack of detection of soft X-rays (i.e., the high energy end of the expected EUV/soft X-ray blackbody like component that would escape interstellar absorption) in V603 Aql (Orio et al., 2001) is also consistent with this analogy. Arguing against this is the high optical/UV luminosity (1035 erg s-1; Ferland et al. 1982) of its accretion disk.
The observed X-ray luminosity is less than one per cent of the observed UV luminosity. If the UV luminosity of V603 Aql indeed represents the accretion luminosity of its disk, the resemblance to the transition in SS Cyg must be a coincidence, and over 99% of the expected luminosity of the boundary layer remains unobserved. If this luminosity is radiated from the white dwarf surface, this must cover a large fraction of the white dwarf surface to have escaped detection: 1035 erg s-1 radiated from 5% of the area of a 6,000 km radius white dwarf would have an effective temperature of 25 eV, and would have been detectable as a bright, soft X-ray component, even with a column of N cm-2. At =20 eV, this is not necessarily the case (most of the emission is in the EUV and can be hidden by the interstellar absorption), but the area must be 15% of the white dwarf surface. Thus, the standard picture of Patterson & Raymond (1985b) with an optically thick boundary layer producing EUV emission, with an optically thin hard X-ray emission near its surface, is a valid model for V603 Aql as long as detailed models allow such a boundary layer to cover a large fraction of the white dwarf surface.
We believe it is appropriate to question if all the observed UV luminosity is directly from viscous heating in the accretion disk. Borczyk et al. (2003) note that the apparent correlation (with little or no time lag) between the X-ray and UV fluxes may indicate that a fraction of the UV flux is due to reprocessing of X-ray photons. For this to be the case, we must postulate a luminous EUV component that varies in phase with the observed hard X-rays, because the luminosity of the latter is clearly insufficient to power the UV component. The hot white dwarf may also contribute non-negligible EUV flux in this regard. Our understanding of when and how nuclear burning terminates in classical novae is still rather vague (see, e.g., Orio et al. (2001)), and little is known about the post-nova cooling. If the entire photosphere of the white dwarf in V603 Aql is hot, though less so than in super-soft source stage of classical novae, its photospheric emission can be hidden more easily than a soft X-ray component from a boundary layer. The difficulty with this picture is that one would expect the photospheric EUV luminosity of a white dwarf to be constant, which is a significant difficulty in explaining the strong UV variability333On the other hand, we also expected the photospheric supersoft emission in immediate post-novae to be constant, which have been proved incorrect in two recent novae, V1494 Aql (Drake et al., 2003) and V4743 Sgr (Ness et al., 2003)..
If the correlated X-ray/UV variability in V603 Aql is confirmed, then the accretion rate inferred from the UV luminosity may be an overestimate, regardless of what we might eventually conclude about the nature of the irradiating source. In any case, the resemblance between the X-ray behaviors of V603 Aql and SS Cyg in outburst transition requires an explanation. Further observations of the overall energy balance of SS Cyg during transition may prove useful in this regard.
4.3 The nature of the short time scale variability
We have argued earlier that the rapid X-ray variability of V603 Aql is not due to photoelectric absorption. There is, however, one parameter in the cooling flow model that can explain the type of variability observed: kTmax. When it is higher, the continuum is stronger and somewhat harder; when lower, weaker and somewhat softer444This does not contradict the earlier statement that the continuum shape does not strongly constrain kTmax. The continuum shape can only constrain kTmax to within 10 keV, while the line to continuum ratio can constrain it to better than 1 keV, if the overall abundances are fixed.. In magnetic CVs, such changes would be unphysical, since the accretion flow is radial and kTmax is strongly tied to the white dwarf mass. In a non-magnetic CV, however, the shock geometry is complex and three dimensional, and we know of no reason why the shock geometry, hence kTmax, cannot vary with a timescale of 10s of minutes. On the other hand, this timescale is too long to be intrinsic to the boundary layer; some external mechanism to drive such a change is probably necessary. A search for similar X-ray variability in other non-magnetic CVs, such as SS Cyg during transition, would be worthwhile.
This timescale, however, is similar to that seen in the UV spectroscopy of V603 Aql (Prinja et al., 2000). Based on the detection of episodic UV absorption lines, they suggested the presence of a time-variable wind in V603 Aql. This may be another symptom of the underlying mechanism that causes the X-ray variability. This is consistent with the fact that UV flux appears to be correlated with X-ray intensities (Borczyk et al., 2003).
4.4 Plasma Diagnostics
The detection of individual lines opens up the possibility to use selected line ratios as diagnostics of the temperature and the density of the emitting plasma. The first thing to note is that the high ratio of H-like to He-like line fluxes is a natural consequence of multi-temperature plasma, since H-like lines are typically emitted over a wider range of temperatures than are the He-like lines (see Figure 8).
A casual glance at the He-like triplets of Mg and Ne (Figure 10) suggests that the forbidden component may be present, which would prove a relatively low density (n cm-3), and hence a large (comparable to, or larger than, the white dwarf) volume. However, we caution against this interpretation for several reasons. First, the observed wavelengths are not exactly at the laboratory wavelengths of the forbidden transitions, even though the resonant lines are exactly where they are supposed to be. This suggest either the identification is incorrect, or that the forbidden component originates in a material with different kinematic properties. Second, observed fluxes in the He-like triplets of Ne and O are much higher than those of the best-fit cooling flow model (Figure 7). This suggests the possibility of a second component.
The third reason is that the strength of the fluorescent Fe K line (equivalent width 150 eV) is consistent with reflection from the white dwarf surface and/or the inner disk (Done & Osborne, 1997) that subtends 2 steradians, as seen from the X-ray emitter. This strongly suggests that the emitting region is compact. The likely volume of such a compact boundary layer (much less than that of the white dwarf) and the emission measure estimates (Figure 8) require that the emission region must be of very high density. For a boundary layer covering 1% of the surface area of a white dwarf (with radius, , of 6,000 km), and height 0.1, to have an emission measure of cm-3, the density must be cm-3.
In fact, the lack of forbidden components of Mg XI and Ne IX at rest wavelengths (see §3.3) is consistent with this interpretation. The ratio /(+) is measured to be 0.44 for Mg XI and 0.16 for Ne IX, taking the upper limit for the flux and the lower limits for and . This implies density greater than cm-3 (Porquet & Dubau, 2000), and can be much higher.
What about the Fe L diagnostics (Mauche et al., 2001, 2003)? Of the Fe XVII lines, the 17.05Å line appears to be strongly detected, while the 17.10Å line is not confidently detected. Within the limited S/N of our data, this is consistent with high density or significant photoexcitation. As for the Fe XXII lines near 11.8Å the S/N of our data is not high enough to allow reliable use of this diagnostic, given the need to first separate the Fe XXII 11.78Å line from the Fe XXIII 11.74Å line.
4.5 Abundances
Our analysis suggests that the accreting gas in V603 Aql has a high Ne abundance and a low Fe abundance, relative to the fiducial values of Anders & Grevesse (1989). However, note that the solar photospheric Fe abundance more recently derived by Lodders (2003) is approximately 60% that of Anders & Grevesse (1989). Thus, whether the Fe abundance of V603 Aql is solar or sub-solar may well be a question of the Fe abundance in the Sun. However, the Ne overabundance of V603 Aql appears genuine, regardless of which solar values we adopt.
V603 Aql appears to differ from other CVs for which abundance anomalies have been reported (see, for example, Mauche et al. 1997; Gänsicke et al. 2003 and references therein), since these concern mostly carbon and nitrogen. These measurements refer to the abundances of the accreting material, hence those of the outermost region of the secondary. The anomalies are likely caused by an episode of CNO cycle in these binaries, perhaps in the secondary which was once more massive (Gänsicke et al., 2003). Although further nuclear evolution can in principle alter the Ne abundance, this presumably would have been preceded by the CNO cycle. Since the NV 1240 line is seen to be weak (Ferland et al., 1982), the CNO cycle and further nuclear evolution does not appear to be a viable explanation for the Ne overabundance in V603 Aql.
An alternative explanation for the CNO abundance anomaly is that the secondary is contaminated by the ejecta from novae in which CNO cycle occurred (Gänsicke et al., 2003). This idea can in principle be extended to explain the Ne abundance of V603 Aql, since approximately a third of all classical novae are thought to harbor an O-Ne-Mg white dwarf, as evidenced by the high Ne abundances in their ejecta (Starrfield et al., 1986; Politano et al., 1995). However, what we observe is not the material of the underlying white dwarf, nor is it the deeper layers of the accreted envelop that is enriched by dredge-up. Instead, the observed X-rays are emitted above the primary surface by the accreting material. Thus, for this mechanism to work, the white dwarf material must first be ejected in nova eruptions, accreted by the secondary, then transferred back onto the white dwarf. This requires a much higher overabundance of Ne in the nova ejecta than what we observe in the Chandra data. According to the analysis of Pottasch (1959), however, the Ne abundance of the V603 Aql shell was 1/7,000, or 1.4 by number. This value is between the Solar value of Anders & Grevesse (1989) (1.23) and our X-ray fitting result (1.75). We therefore conclude that this is not a viable mechanism for the observed Ne overabundance.
This suggests that the V603 Aql system was born with a higher then solar Ne abundance due to Galactic chemical evolution, implying that it is either young, or it originated closer to the Galactic center (see, e.g., Chiappini et al. 1997). Given the location of V603 Aql very near the Galactic mid-plane ( at a distance of 360 pc), the former interpretation is certainly plausible. It is also consistent with the proposition that there are two population of classical novae, one young and fast (V603 Aql being a prominent example), the other older and slower (Della Valle et al., 1992). Abundance measurements of other old novae may provide a way to test whether there indeed are two distinct populations.
5 Conclusions
We have presented our analysis of Chandra, RXTE, and archival X-ray observations of V603 Aql. It is among the X-ray brightest CV and displays a line-rich X-ray spectrum. However, it is likely that non-imaging X-ray data of V603 Aql are contaminated by the Galactic Ridge as well as nearby, unrelated sources. On V603 Aql itself, our findings can be summarized as follows.
(1) It is a highly variable X-ray source. However, we find no indications of a single, coherent period, and confirm that V603 Aql is a non-magnetic CV.
(2) The X-ray spectrum of V603 Aql is from a multi-temperature, collisionally ionized plasma. Specifically, we find that the cooling flow model provides an adequate framework for physical interpretation.
(3) The spectrum and the luminosity of V603 Aql resembles those of SS Cyg in transition, even though the UV luminosity of V603 Aql is very high. This is a clue that must be taken into account in any detailed physical models of the X-ray emission mechanism in non-magnetic CVs.
(4) The weak energy dependence of the X-ray flux variations in V603 Aql can be explained as due to changes in the maximum temperature of the multi-temperature plasma. The physical cause of such changes is unknown, but we note the accretion disk wind in V603 Aql appears to be modulated on a similar timescale.
(5) There are complications that make the plasma diagnostics less clear-cut than we would like. The preponderance of evidence points towards a high density, compact emission region compatible with the accretion disk boundary layer.
(6) We detect an apparent overabundance of Ne in the accreting matter. This is best explained as due to V603 Aql being a young binary.
References
- Anders & Grevesse (1989) Anders, E. & Grevesse, N. 1989, Geochimica et Cosmochimica Acta 53, 197
- Baskill et al. (2001) Baskill, D.S., Wheatley, P.J. & Osborne, J.P, 2001, MNRAS, 328, 71
- Baskill et al. (2004) Baskill, D.S., Wheatley, P.J. & Osborne, J.P. 2004, MNRAS, in press
- Borczyk et al. (2003) Borczyk, W., Schwarzenberg-Czerny, A. & Szkody, P. 2003, A&A, 405, 663
- Bradt et al. (1993) Bradt, H.V., Rothschild, R.E. & Swank, J.H. 1993, A&AS, 97, 355
- Chiappini et al. (1997) Chiappini, C., Matteucci, F. & Gratton, R. 1997, ApJ, 477,765
- Cropper (1986) Cropper, M. 1986, MNRAS, 222, 853
- Della Valle et al. (1992) Della Valle, M., Bianchini, A., Livio, M. & Orio, M. 1992, A&A, 266, 232
- Done & Osborne (1997) Done, C. & Osborne, J.P. 1997, MNRAS, 288, 649
- Drake et al. (2003) Drake, J.J., Wagner, R.M., Starrfield, S., Butt, Y., Krautter, J., Bond, H.E., Della Valle, M., Gehrz, R.D., Woodward, C.E., Evans, A., Orio, M., Hauschildt, P., Hernanz, M., Mukai, K., Truran, J.W. 2003, ApJ, 584, 448
- Drechsel et al. (1983) Drechsel, H., Rahe, J., Seward, F.D., Wang, Z.R. & Wargau, W. 1983, A&A, 126, 357
- Dürbeck (1988) Dürbeck, H.W. 1988, Astrophysical Letters, 27, 286
- Dürbeck (1999) Dürbeck, H.W. 1999, IBVS, 4731
- Ferland et al. (1982) Ferland, G.J., Lambert, D.L., McCall, M.L, Shields, G.A. & Slovak, M.H. 1982, ApJ, 260, 794
- Gänsicke et al. (2003) Gänsicke, B.T., Szkody, P., de Martino, D., Beuermann, K., Long, K.S. Sion, E.M.Knigge, C., Marsh, T. & Hubeny, I. 2003, ApJ, 594, 443
- Garmire et al. (2003) Garmire, G.P., Bautz, M.W., Ford, P.G., Nousek, J.A. & Ricker, G.R. 2003, SPIE, 4851, 28
- Griffiths & Jordan (1998) Griffiths, N.W. & Jordan, C. 1998, ApJ, 497, 883
- Haefner & Metz (1985) Haefner, R. & Metz, K. 1985, A&A, 145, 311
- Harrison & Gerz (1988) Harrison, T.E. & Gehrz, R.D. 1988, AJ, 96, 1001
- Homer et al. (2004) Homer, L., Szkody, P., Raymond, J.C., Fried, R.E., Hoard, D.W., Hawley, S.L., Wolfe, M.A., Tramposch, J.N. & Yirak, K.T. 2004, ApJ, 610, 991
- Hubble & Duncan (1927) Hubble, E. & Duncan, J.C. 1927, ApJ, 66, 59
- Israel et al. (2001) Israel, G.L., Negueruela, I., Campana, S., Covino, S., Di Paola, A., Maxwell, D.H., Norton, A.J., Speziali, R., Verrecchia, F. & Stella, L. 2001, A&A, 371, 1018
- Jahoda et al. (1996) Jahoda, K., Swank, J.H., Giles, A.B., Stark, M.J., Strohmayer, T., Zhang, W. & Morgan, E.H. 1996, in EUV, X-ray and Gamma-Ray Instrumentation for Astronomy VII, ed O.H. Siegmund (Bellingham, WA: SPIE), 59
- Koyama et al. (1990) Koyama, K., Kawada, K., Takeuchi, Y., Tawara, Y., Ushimaru, N., Dotani, T. & Takizawa, M. 1990, ApJ, 356, L47
- Lodders (2003) Lodders, K. 2003, ApJ, 591, 1220
- Markert et al. (1994) Markert, T.H., Canizares, C.R., Dewey, D., McGuirk, M., Pak, C.S. & Schattenburg, M.L. 1994, SPIE, 2280, 168
- Mauche et al. (1997) Mauche, C.W., Lee, Y.P. & Kallman, T.R. 1997, ApJ, 477, 832
- Mauche et al. (2001) Mauche, C.W., Liedahl, D.A. & Fournier, K.B. 2001, ApJ, 560, 992.
- Mauche et al. (2003) Mauche, C.W., Liedahl, D.A. & Fournier, K.B. 2003, ApJ, 588, L101
- McGowan et al. (2004) McGowan, K.E., Priedhorsky, W.C. & Trudolyubov, S.P. 2004, ApJ, 600, 343
- Mukai et al. (2003) Mukai, K., Khan, S.M., Kinkhabwala, A., Paerels, F. & Peterson, J.R. 2003, ApJ, 586, L77
- Naylor et al. (1996) Naylor, T., Koch-Miramond, L., Ringwald, F.A. & Evans, A. 1996, MNRAS, 282, 873
- Ness et al. (2003) Ness, J.-U., Starrfield, S., Burwitz, V., Hauschildt, P., Wichmann, R., Drake, J.J., Wagner, R.M., Bond, H.E., Krautter, J., Orio, M., Hernanz, M., Gehrz, R.D., Woodward, C.E., Butt, Y., Mukai, K., Balman, S., Truran, J.W. 2003, ApJ, 594, L127
- Nousek et al. (1994) Nousek, J.A., Baluta, C.J., Corbet, R.H.D., Mukai, K., Osborne, J.P. & Ishida, M. 1994, ApJ, 436, L19
- Orio et al. (2001) Orio, M., Covington, J. & Ögelman, H. 2001, A&A, 373, 542
- Patterson (1999) Patterson, J. 1999, in “Disk Instabilities in Close Binary Systems,” eds. S. Mineshige & J.C. Wheeler, Universal Academy Press, 61
- Patterson & Raymond (1985a) Patterson, J. & Raymond, J.C. 1985a, ApJ, 292, 535
- Patterson & Raymond (1985b) Patterson, J. & Raymond, J.C. 1985b, ApJ, 292, 550
- Patterson et al (1993) Patterson, J., Thomas, G., Skillman, D.R. & Diaz, M. 1993, ApJS, 86, 235
- Patterson et al (1997) Patterson, J., Kemp, J., Saad, J., Skillman, D.R., Harvey, D., Freid, R., Thorstensen, J.R. & Ashley, R. 1997, PASP, 109, 468
- Perna et al. (2003) Perna, R., McDowell, J., Menou, K., Raymond, J. & Medvedev, M.V. 2003, ApJ, 598, 545
- Politano et al. (1995) Politano, M., Starrfield, S., Truran, J.W., Weiss, A. & Sparks, W.M. 1995, ApJ, 448, 807
- Porquet & Dubau (2000) Porquet, D. & Dubau, J. 2000, A&AS, 143, 495
- Pottasch (1959) Pottasch, S. 1959, AnAp, 22, 412
- Pratt et al. (2004) Pratt, G.W., Mukai, K., Hassall, B.J.M., Naylor, T. & Wood, J.H. 2004, MNRAS, 348, 49
- Prinja et al. (2000) Prinja, R.K., Knigge, C., Ringwald, F.A. & Wade, R.A. 2000, MNRAS, 318, 368
- Scargle (1982) Scargle, J.D. 1982, ApJ, 263, 835
- Seward et al. (2003) Seward, F.D., Slane, P.O., Smith, R.K. & Sun, M. 2003, ApJ, 518, 4114
- Starrfield et al. (1986) Starrfield, S., Sparks, W.M. & Truran, J.W. 1986, ApJ, 303, L5
- Tanaka et al. (1994) Tanaka, Y., Inoue, H., & Holt, S. S. 1994, PASJ, 46, L37
- Udalski & Schwarzenberg-Czerny (1989) Udalski, A. & Schwarzenberg-Czerny, A. 1989, Acta Astron, 39, 125
- Valinia & Marshall (1998) Valinia, A. & Marshall, F.E. 1998, ApJ, 505, 134
- Wade et al. (2000) Wade, R.A., Harlow, J.J.B. & Ciardullo, R. 2000, PASP, 112, 614
- Warner (1995) Warner 1995, Cataclysmic Variables (Cambridge: Cambridge Univ. Press)
- Warwick et al. (1985) Warwick, R.S., Turner, M.J.L., Watson, M.G. & Willingale, R. 1985, Nature, 317, 218
- Weisskopf et al. (2002) Weisskopf, M.C., Brinkman, B., Canizares, C., Garmire, G., Murray, S. & Gan Speybroeck, L.P. 2002, PASP, 114, 1
- Wheatley et al. (2003) Wheatley, P.J., Mauche, C.W. & Mattei, J.A. 2003, MNRAS, 345, 49


| Observatory | Observation ID | Date | Exposure | Average Count Rate |
|---|---|---|---|---|
| (ksec) | (ct s-1) | |||
| ASCA | 34013000 | 1996 October 8–10 | 38(GIS)/ 43(SIS) | 2.22 (total) |
| RXTE | 30025-01aaFull Observation IDs are 30025-01-01-00, 30025-01-01-01, and 30025-01-01-02. | 1998 December 5–7 | 41 (total) | 3.00bbPer PCU. Includes contribution from the Galactic Ridge, estimated to be 2 ct s-1 per PCU. |
| RXTE | 60013-01ccFull Observation IDs are of the form 60013-01-nn-00, where nn is in the range 01 to 20. | 2001 April 17–22 | 55.4 (total) | 3.25bbPer PCU. Includes contribution from the Galactic Ridge, estimated to be 2 ct s-1 per PCU. |
| Chandra | 1901 | 2001 April 19/20 | 63.5 | 0.33dd1st orders combined. |
| NH | kTmin | kTmax | NeaaAbundances, relative to solar values of Anders & Grevesse (1989) | FeaaAbundances, relative to solar values of Anders & Grevesse (1989) | bbParticipating mass accretion rate, for a fiducial distance of 360 pc (Hubble & Duncan, 1927). |
|---|---|---|---|---|---|
| cm-2 | 0.14 keV | 20.3 keV | 1.42 | 0.62 | 8.00 M⊙ yr-1 |
| Line ID | Wavelength | Width | Flux |
|---|---|---|---|
| (Å) | (km s-1) | (10-6 photons cm-2s-1) | |
| Fe XXVI 1.78 | 1.774 (1.767–1.787) | 1150 (3050) | 12.5 (4.9–24.2) |
| Fe XXV 1.86 | 1.855 (1.851–1.860) | 550 (2250) | 24.3 (15.2-40.3) |
| Fe Fluorescent | 1.939 (1.933–1.945) | 1520 (770–2680) | 20.9 (12.5-31.3) |
| S XVI 4.73 | 4.732 (4.713–4.738) | 160 (660) | 5.9 (2.6-10.1) |
| S XV 5.04 | 5.043 (5.034–5.048) | 0 (800) | 4.9 (2.8–10.5) |
| Si XIV 6.18 | 6.182 (6.180–6.184) | 300 (180–430) | 19.3 (16.4–22.7 ) |
| Si XIII 6.65 | 6.651 (6.647–6.659) | 460 (230–970) | 12.0 (8.7–15.7) |
| Fe XXIV 7.99 | 7.981 (7.976–7.990) | 370 (10–750) | 3.8 (2.0–6.0) |
| Mg XII 8.42 | 8.420 (8.418–8.422) | 280 (200–400) | 18.0 (15.3-21.1) |
| Mg XI 9.17 | 9.170 (9.167–9.175) | 0 (180) | 5.7 (4.0–8.4) |
| Mg XI 9.23 | 9.230 (9.220–9.237) | 0 (180) | 2.8 (1.2–5.2) |
| Mg XI 9.31 ?aaFlux at the rest wavelength of the forbidden Mg xi is photons cm-2s-1 | 9.335 (9.326–9.340) | 0 (600) | 3.2 (1.1–5.9) |
| Fe XX 10.00 | 9.978 (9.975–9.988) | 0 (370) | 6.6 (4.1–9.6) |
| Fe XX 10.05 | 10.051 (10.041–10.061) | 0 (360) | 2.8 (1.1–5.7) |
| Ne X 10.24 | 10.245 (10.240–10.254) | 0 (340) | 6..4 (3.6–9.7) |
| BlendbbBlend of Fe XIX 10.64 and Fe XIX 10.65? | 10.644 (10.637–10.653) | 660 (480–990) | 24.0 (18.0–30.8) |
| BlendccBlend of Fe XXIII 11.02 and Fe XXIV 11.03? | 11.019 (11.010–11.029) | 590 (350–820) | 18.7 (13.4–25.1) |
| Fe XXIV 11.18 | 11.177 (11.170–11.183) | 400 (230–690) | 16.1 (11.4–21.9) |
| Fe XXIV 11.43 | 11.439 (11.429–11.440) | 0 (280) | 10.1 (6.8–15.3) |
| BlendddBlend of Fe XXIII 11.74 and Fe XXII 11.77? | 11.756 (11.737–11.773) | 820 (510–1280) | 15.4 (8.3–23.8) |
| Ne X 12.13 | 12.135 (12.132–12.139) | 270 (120–360) | 45.6 (36.2–53.4) |
| Ne IX 13.45 | 13.439 (13.431–13.445) | 220 (100–380) | 19.8 (14.2–30.7) |
| Ne IX 13.55eePossibly blended with Fe,XIX 13.52 | 13.531 (13.516–13.544) | 800 (580–1130) | 37.3 (27.2–48.3) |
| Ne IX 13.70 ?ffFlux at the rest wavelength of the forbidden Ne ix is photons cm-2s-1 | 13.744 (13.730–13.756) | 70 (570) | 7.5 (2.5–12.3) |
| Fe XVII 14.37 | 14.360 (14.355–14.368) | 0 (280) | 8.8 (4.7–16.1) |
| Fe XVII 15.01 | 15.009 (15.001–15.014) | 270 (10–480) | 46.3 (23.7–48.9) |
| Fe XVII 15.26 | 15.260 (15.256–15.267) | 0 (190) | 15.5 (11.3–26.5) |
| Fe XVIII 15.63 | 15.623 (15.607–15.641) | 300 (100–630) | 8.0 (4.4–20.7) |
| Fe XVIII 16.05 | 16.035 (15.996–16.054) | 760 (460–1040) | 31.3 (19.2–45.4) |
| Fe XVII 16.78 | 16.780 (16.764–16.789) | 370 (260–650) | 30.6 (19.2–44.0) |
| Fe XVII 17.05 | 17.061 (17.052–17.071) | 440 (340–650) | 49.9 (35.5–67.1) |
| O VIII 18.97 | 18.964 (18.958–18.970) | 330 (270–430) | 144.2 (115.6–169.3) |