A Far Ultraviolet Spectroscopic Survey of Luminous Cool Stars
Abstract
FUSE ultraviolet spectra of 8 giant and supergiant stars reveal that high temperature (3105K) atmospheres are common in luminous cool stars and extend across the color-magnitude diagram from Car (F0 II) to the cool giant Tau (K5 III). Emission present in these spectra includes chromospheric H-Ly, Fe II, C I, and transition region lines of C III, O VI, Si III, Si IV. Emission lines of Fe XVIII and Fe XIX signaling temperatures of 107K and coronal material are found in the most active stars, Cet and 31 Com. A short-term flux variation, perhaps a flare, was detected in Cet during our observation. Stellar surface fluxes of the emission of C III and O VI are correlated and decrease rapidly towards the cooler stars, reminiscent of the decay of magnetically-heated atmospheres. Profiles of the C III (977) lines suggest that mass outflow is underway at T80,000 K, and the winds are warm. Indications of outflow at higher temperatures (3105K) are revealed by O VI asymmetries and the line widths themselves. High temperature species are absent in the M-supergiant Ori. Narrow fluorescent lines of Fe II appear in the spectra of many giants and supergiants, apparently pumped by H Ly-, and formed in extended atmospheres. Instrumental characteristics that affect cool star spectra are discussed.
1 Introduction
The structure of the outer atmospheres of cool giant and supergiant stars can reveal the evolution of magnetic activity as atmospheres expand, stars lose angular momentum, and arguably dynamo heating decreases, as stars become cooler and more luminous. The existence of hot material and its relation to winds and mass loss can be addressed with far ultraviolet spectra obtained with the Far Ultraviolet Spectroscopic Explorer (FUSE) satellite (Moos et al. 2000) because they probe both the presence of high temperature plasma and the dynamics of the atmosphere. Two well-recognized examples of these extremes are represented by the Sun (possessing a hot, fast, low mass flux wind) and the supergiant Ori (possessing a cool, slow, high mass flux wind). However identifying the connecting links between these two types of atmospheres, perhaps represented in part by the hybrid stars (Hartmann et al. 1980, Reimers et al. 1996), can be addressed by FUSE spectra. Thus, far ultraviolet spectra can be used to build a comprehensive picture of the heating and dynamics of the outer atmospheres of cool stars.
Ultraviolet measurements with the International Ultraviolet Explorer (IUE) laid the foundations for characterization of cool star atmospheres (cf. Jordan & Linsky 1989; Dupree & Reimers 1989); the Hubble Space Telescope (HST) has focused principally on individual objects (cf Ayres et al. 1998, McMurry & Jordan 2000, Carpenter et al. 1999, Robinson et al. 1998, and Lobel & Dupree 2001). FUSE complements IUE and HST because coverage of shorter wavelengths (912–1180) gives access to the strong O VI resonance emission formed at temperatures K providing a diagnostic of temperatures higher than normally available in the near ultraviolet; and line profiles provide clues to heating and atmospheric dynamics. This spectral region also contains fine structure transitions of Fe XVIII and Fe XIX that enable detection of a hot corona and its dynamics and extend the temperature coverage by more than an order of magnitude to 7106K in addition to allowing velocity and profile measurements. A summary of the major atomic transitions specifically considered here is contained in Table 1
Eight luminous stars: Ceti (HD 4128), Ori (HD 39801), Tau (HD 29139), Car (HD 45348), Gem (HD 62509), 31 Com (HD 111812), Dra (HD 159181), Aqr (HD 209750) were selected by the Cool Stars team on the FUSE satellite in order to obtain far UV spectra of objects of various effective temperatures, degree of activity, and luminosity (see Fig. 1). Parameters of these stars are given in Table 2. Analysis of these spectra is presented here. A complementary paper on the survey of cool dwarf stars with FUSE is reported by Redfield et al. (2002).
2 Observations and Data Reduction
The FUSE instrument and its calibration are discussed in Moos et al. (2000) and Sahnow et al. (2000). FUSE has 4 co-aligned prime focus telescopes that feed light to four Rowland spectrographs. Two of the spectrograph gratings are coated with LiF and two with SiC (Moos et al. 2000), enabling full (and redundant, in some regions) coverage of the FUSE wavelength range: 905Å–1179Å. The spectral segments are denoted by the grating coating and telescope (e.g. LiF1, LiF2 and SiC1, SiC2) and by the detector (A or B). The monochromatic spectral resolving power of FUSE is 200002000 (FUSE Observers Guide V4.0) or 15 km/s. With good signal-to-noise in a line profile, and the oversampling of the FUSE spectrum, the position of a spectral line can be determined to about 2 km s-1.
All spectra were obtained through the large aperture of FUSE (denoted LWRS, a 30 arcsecond square); Tau was also observed through the 4 20 arcsecond square medium aperture (MDRS) in order to minimize airglow contamination. Details of the FUSE observations are noted in Table 3. Spectra were reduced with the FUSE CalFUSE v2.0.5 pipeline, except CalFUSE v2.4 was used for Tau in the LWRS aperture. To combine exposures, individual subexposures for a single telescope/detector combination (i.e. LiF1A, SiC2A etc.) were co-added after alignment using cross correlation techniques. Restricted wavelength ranges for the cross correlation were chosen for each detector segment so as to avoid geocoronal emission and to perform the cross-correlation alignment on strong stellar features. Extractions of spectra obtained only during night time pointings were made for all targets in addition to the normal procedures of extracting ‘both’ spectra (both day and night combined).
Individual images were examined to ensure that exposures with burst characteristics were not included and the star was in the aperture in all channels. However it is difficult to identify placement in the MDRS aperture where the star may be close to the edge of the aperture (cf. also Redfield et al. 2002). Data from the large aperture, LWRS are used for flux measurements of all targets. Special attention was given to the SiC channels to verify that the target was in the aperture. The spacecraft guiding is maintained using the LiF1A channel, and the SiC channels can become misaligned. In several subexposures of Tau and Dra, the C III 977Å emission was not visible and we eliminated that subexposure from the summations (see Table 3 for a summary).
Another potential contaminant is scattered sunlight that can affect both the fluxes and profiles of the C III (977) and O VI (1032) transition. Comparison of day and night extractions can identify the presence of a solar component. Scattered sunlight is present in the Tau spectrum in the LWRS aperture, where the night time extractions were used for the SiC2A and LiF1A channels (see Table 3).
3 Wavelength Scale
The relative wavelength scale for each detector segment of each channel is determined by the CalFUSE pipeline and believed to be accurate to 3–4 pixels ( 0.025Å or 8 km s-1) over most of the detectors111See the FUSE Wavelength Calibration: A FUSE White Paper at http://fuse.pha.jhu.edu/analysis/calfuse_wp1.html. However the absolute velocity offset for each detector must be determined independently in each detector segment. Narrow interstellar absorption lines of C III (977) and C II (1036) can be identified in the spectra from the SiC2A and LiF1A channels respectively where they occur in the profiles of the stellar emission lines. Ultraviolet spectra from HST (STIS/GHRS) typically contain interstellar lines of low ionization species (C II, Si III, D I, O I, and Mg II) whose velocities are measured; these values are used to set the absolute wavelength scale of the FUSE spectra (see Table 4). Two stars, Aqr and Dra, show interstellar H2 near 1038, and interstellar C II (1036.34) can be identified in Aqr. However, in the LiF1A channels, 4 targets (31 Com, Gem, Ori and Tau) show no discernible interstellar feature and had to be treated differently. For Gem, several chromospheric lines [C II (1036.3367, short wavelength wing only), C II (1037.0182), S IV (1062.621), Si IV (1066.6094), and S IV (1072.9558)] were fit to Gaussian curves and assigned a photospheric velocity. The average offset for Gem was determined to be 0.0351Å0.008. The star 31 Com is more difficult because only 2 weak stellar S IV lines are available (1062.6166 and 1072.9954) that give offsets of 0.0571Å and 0.0099Å respectively – an uncomfortable spread of 13 km s-1. Having no other alternative, we take the average offset (0.0335Å) to set the absolute wavelength scale. For Ori and Tau, the CalFUSE 2.0.5 wavelength scale is adopted here.
FUSE channels at the longest wavelength (1100–1180) generally do not contain observable interstellar lines in the spectra of cool stars. In this case we resort to HST spectra obtained wtih the Space Telescope Imaging Spectrograph (STIS) or the Goddard High Resolution Spectrograph (GHRS). For the LiF 2A (and Lif1B) channel we adopt the HST/STIS/GHRS absolute wavelength offset by forcing agreement between the HST and FUSE wavelengths using C III 1176Å when observed in both spectra. Otherwise, we have forced the velocity of the ions observed in LiF2A (Si III, 1113.23 and Si IV, 1122.49) to match the same ion, Si III (1206) and Si IV (1394, 1401) observed with HST.
The velocity offsets necessary for alignment with previously observed interstellar line velocities are usually small. For 6 targets of this program (not including Tau and Ori), the corrections for the C III line (SiC 2A channel) ranged in absolute value from 4.4 to 29 km s-1 with an average of 11.5 km s-1. The LiF2A channel for the same 6 targets gave offsets ranging from 0.0335Å (9.7 km s-1) to +0.06873Å (17.5 km s-1) with an average of 0.0245Å (6.25 km s-1).
Comparison of the wavelength offsets obtained in this way were made with wavelengths of unblended O I airglow lines observed in the spectrum for several cases. Airglow lines typically vary in wavelength by 5 to 18 km s-1 from the offset determined by the interstellar features, so they can give a crude estimate of the absolute scale, but only to 10 km s-1. For Gem, the O I airglow gives an offset for SiC2A of +17.5 km s-1 as compared to the interstellar offset of 15.0 km s-1. In the LiF2A channel, the airglow values vary from 5 to 18 km s-1 different from the offsets determined by interstellar lines. Although lack of precision in the wavelength scale exists, this does not materially affect the line identifications and fluxes, or conclusions drawn from the analysis of line profiles.
4 Line Identifications
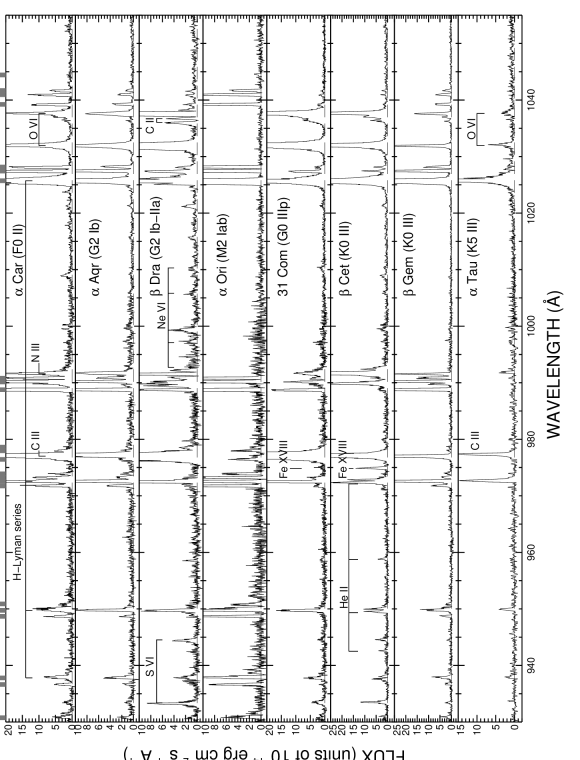
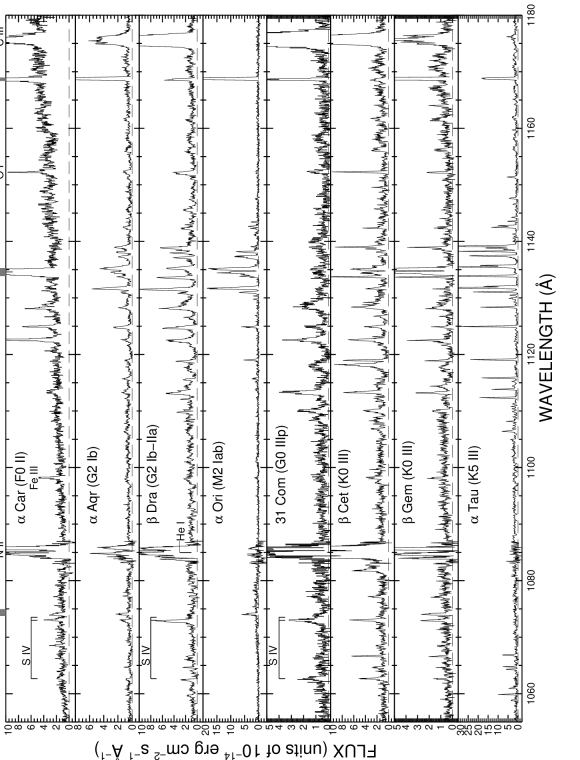
Line identifications were made by comparison to the solar spectrum (Curdt et al. 2001), and to other cool luminous stars observed by FUSE (Young et al. 2001; Ake et al. 2000). The highest ionization lines (Fe XVIII and Fe XIX) are discussed separately below. The strongest species are marked in Fig. 2 and 3. Every star, except for Ori exhibits emission from C III and O VI, indicating that temperatures at least as high as 3 105K are present assuming a collision-dominated thermal plasma. Emission from the Earth’s atmosphere (“airglow”) is identified using several spectra with long integrations on the sky.333We extracted a sky exposure of 58 ks from the LWRS from Observation P1100301; another airglow spectrum can be found on the FUSE website, http://fuse.pha.jhu.edu/analysis/airglow/airglow.html.
Fluxes were extracted (Table 5) for the strongest lines of C III (977 and 1176) and O VI (1032) by integrating directly over the line profiles. These fluxes agree with previous ORFEUS measurements (Dupree & Brickhouse 1998) of Aqr and Dra to within 6% on average; an exception is 1176 which is stronger in the FUSE spectrum of Aqr by a factor of 2.5. Such a large discrepancy is unexpected. Because the FUSE spectra for these 2 stars were taken through the large aperture, they are not subject to flux loss as found in some medium aperture spectra (Redfield et al. 2002). The supergiant Aqr exhibits periodic chromospheric variability (Rao et al. 1993), and variability in the Mg II flux (Brown et al. 1996), which may account in part for the discrepancy. Cool dwarf stars studied with FUSE (Redfield et al. 2002) also show discrepancies, on average of 20%, when compared to fluxes from ORFEUS.
Luminous cool stars show a distinct pattern of narrow emission lines near 1130–1140 first noted in the ORFEUS spectrum of TrA and ascribed to low-ionization states most probably fluoresced in the extended cool atmosphere (Dupree & Brickhouse 1998). It required the higher spectral resolution of FUSE to identify many of the emission lines as Fe II (Harper et al. 2001) that result from fluorescent decay of levels pumped by Lyman- (cf. Hartman & Johansson 2000). The targets in this survey also show many of the same narrow lines (see Fig 4).
Details of the Fe II line strengths are puzzling. Alpha Tau displays a strong Fe II spectrum where it appears that Fe II lines pumped by radiation close to the Ly- core (1.8Å) are present and strong, and lines pumped by more distant wavelengths are absent or weaker as suggested by Harper et al. (2001) based on a spectrum of TrA. The strong signature transitions of Fe II between 1131–1139Å support this conjecture. However the Fe II lines do not have similar relative strengths in other targets. Whereas 1131.594Å dominates in the spectrum of Tau, Ori, Dra, and Aqr, another transition of Fe II at 1138.941Å dominates in Gem and Cet, appears in Tau, Dra, and Aqr, but is very weak or absent in Ori. Moreover, the supergiant Ori has a more extensive atmosphere than the giant Tau, which would appear to enhance fluorescent processes, yet the fluoresced lines appear weaker in Ori than in Tau. Because the presence of the fluoresced lines depends on the intrinsic stellar Ly– profile shape, its flux, and the detailed atmospheric dynamics to enable the process, models specific to each star need to be constructed to interpret these spectra.
It is worth noting that the low background count rate of the FUSE detectors enables identification of weak emission features. As shown in Fig. 5, longward of the C III, 977 emission, the spectrum of Dra exhibits, no airglow, but an O I line at 977.62 that is fluoresced most probably by the C III transition itself through the stellar resonance O I transition at 976.45 with the same upper level (), overlapping the broad C III profile.
5 Coronal Lines
Two targets, Cet and 31 Com contain emission from high temperature coronal species: Fe XVIII and Fe XIX. This is not surprising since these very same ions have been identified in EUVE spectra of these stars (Sanz-Forcada et al. 2002). Similar transitions were found in the FUSE spectrum of Capella (Young et al. 2001) and other targets discussed by Redfield et al. (2003) including Cet and 31 Com. Coronal species are present in the near ultraviolet region covered by HST; these include Fe XII and Fe XXI (Jordan et al. 2001; Ayres et al. 2003).
5.1 Cet
Cet shows the highest excitation lines in the FUSE spectral region, namely Fe XVIII (974.86, ) and Fe XIX (1118.07, ) arising from transitions within the ground configurations of the atom. The observed wavelength of the Fe XVIII, 974.85 transition (corrected for the +12.3 km s-1 radial velocity of the star) agrees with the laboratory wavelength to 0.015Å and confirms that the feature corresponds to the photospheric velocity. The FWHM equals 0.290.02Å which is comparable to the thermal broadening expected in a plasma at T106.8K. The line flux is measured to be 3.60.4 10-14 erg cm-2s-1. These parameters, here measured from the photon (counts) spectrum confirm the values in Redfield et al. (2003). The Fe XIX transition appears blended with a broad C I multiplet that occurs from 1117.2 to 1118.5. The blend was deconvolved into a broad (FWHM= 1.4Å) and narrow (FWHM=0.33Å) component. Line center, corrected for the stellar radial velocity, and corrected by using the Si III transition at 1113.228 as a fiducial reference, occurs at 1118.081Å in agreement within 0.01Å with the laboratory value. The expected fluxes of Fe XVIII and Fe XIX from Ceti were predicted by using atomic emissivities from CHIANTI/APEC (Dere et al. 2001; Smith et al. 2001) and an emission measure distribution from iron lines measured in the EUVE spectrum in 2000 (Sanz-Forcada et al. 2002); the observed fluxes in FUSE spectra are stronger than the predictions by a factor of 1.7 for 974, and by a factor of 1.6 for 1118. The ratio of the fluxes of Fe XVIII/Fe XIX is predicted to be 974/1118=1.8, as compared to the measured value of 2.02, an amount that is within 12% of the prediction.
The agreement of the flux values, within a factor of 2 is considered acceptable, based on the uncertainties in atomic parameters, density effects, calibration errors, the interstellar absorption correction, and possible variations in the source itself. Because Cet became much more active in August 2000 as compared to the earlier EUVE observation in 1994 and displayed frequent flaring activity not found earlier (Ayres et al. 2001b; Sanz-Forcada et al. 2003), this activity may have continued through the FUSE observations in December 2000 although we have no direct evidence of continued activity. Certainly, a variation of a factor of two in highly ionized species is not surprising as has been noted earlier in Capella (Dupree & Brickhouse 1995). And it is also possible there are additional cascade contribution from higher levels of Fe XVIII and Fe XIX that are not included in the CHIANTI/APEC emissivities leading to an underestimate of the predicted value.
5.2 31 Com
It appears likely that Fe XVIII and Fe XIX are also present in the spectrum of 31 Com. 31 Com has a high surface flux of O VI and an emission measure distribution derived from EUVE spectra that mimics that of Ceti (Sanz-Forcada et al. 2002), except the coronal enhancement occurs at slightly higher temperatures. Using the EUVE emission measure distribution, the flux of Fe XVIII (974) is predicted to be 1.810-15 erg cm-2s-1 and Fe XIX (1118) is estimated as 1.6310-15 erg cm-2s-1. Although weak444In addition to intrinsic weakness, the Fe XVIII is affected by the C III 977Å broad wing which contributes to elevate the background. Taking the binned spectrum, we fit multiple Gaussian profiles to the C III wing, Fe XVIII, and nearby airglow lines as well as the linear continuum. The FWHM of the Fe XVIII emission was determined as 0.40Å, and so the summing of the spectrum was made to 1.65 which should include 90% of the line emission for the Fe XVIII feature. Fe XVIII is observed in the SiC2A channel with a flux of 4.610-15 erg cm-2s-1, a factor 2.5 times larger than predicted. The Fe XIX flux is difficult to measure because it is located in a complex of C I emission. To estimate the flux, we scaled the expected C I strength in the blended multiplet at 1118 in 31 Com from the adjacent C I multiplet near 1115 using the ratio measured in the quiet sun spectrum (Curdt et al. 2001). The cell center and network ratio differ only by 7%. Fe XIX observed in the LiF2A channel equals 6.6210-15 erg cm-2s-1. As in the case of Cet, the observed FUSE values are larger than predicted, in this case by a factor of 4. The flux ratio Fe XVIII/Fe XIX is predicted to be 1.1 as compared to the observed value of 0.7, representing a difference of a factor of 1.6. Such a discrepancy is not surprising considering the flux extraction procedure in addition to other uncertainties noted above.
6 Lyman Series Emission
All of the stars display a Lyman- emission feature at 1025. This is the strongest airglow line in the FUSE spectral range, and is present both in day and night spectra. Unfortunately the strong airglow has caused a drop in the gain of the detectors in this wavelength region when using the large aperture. Because the reported x-positions of the photons arriving on the detector are a function of the gain, the drop in gain (‘gain sag’) causes lower gain events to be incorrectly positioned (cf. The FUSE Instrument and Data Handbook, V. 2.1, Sec. 9.1.12). The tendency for photons to be moved to shorter wavelengths on the LiF1A detector, causes emission features to appear that can mimic actual stellar emission. The nature of the observed emission is revealed by inspection of the pulse height distribution of the feature in the raw data, and extraction of the spectrum with CalFUSE using various levels of the pulse height screening parameter. Emission features on the short wavelength side of Ly- in Fig. 6 become weaker when the pulse height threshold is raised. The FUSE project remedies the gain sag problem periodically, but it is usually present at some level making suspect the emission features that lie shortward of Ly-.
In most of our targets there is excess emission to the long wavelength side of Lyman- (Fig. 6). To identify the stellar emission in this complex feature, the profiles are compared to FUSE reference airglow spectra. An extended exposure on the “sky” was taken in August of 1999 yielding spectra through all FUSE apertures with no target in the field. Because this date was very early in the FUSE mission, the profiles are not affected by gain changes in the detectors. These spectra are available on the FUSE website, and the LiF1A spectra were scaled to the observed airglow profile in the target stars. Spectra from the LWRS were used for all stars, except for Tau where a MDRS spectrum was substituted. The profile of the Lyman- airglow emission is the same for both day and night extractions, although the flux level is lower in spectra obtained at night. While absorption by interstellar deuterium is expected at 1025.443, airglow in the large aperture contaminates this region. Spectra of Tau, taken through the medium aperture, do not have sufficient signal to detect D I absorption.
All of the targets except Ori have excess emission on the long wavelength side (Fig. 6) which arises from H I in the stellar chromosphere. Emission is expected and likely to be self-reversed because Lyman- is an optically thick chromospheric line. Additionally, motion in the atmosphere can create asymmetries in the profiles, and absorption by interstellar hydrogen can substantially change their appearance. It is not possible to draw conclusions about the intrinsic stellar line flux or shapes because of airglow contamination and instrumental effects. The H Ly- profile of Tau, because it was taken through the MDRS, reducing the airglow contamination, comes closest to sampling the stellar profile but the interstellar absorption at 30 km s-1 coupled with the stellar radial velocity of 54 km s-1 affects the central reversal. In spite of problems with the line core and blue wings, the extent of the H Ly- long wavelength emission wings indicates the width of the H-Ly profiles. The H Ly- stellar emission wings on the long wavelength side span a region 0.5 – 1.0Å. Because the H Ly- line width is about a factor of 1.4 broader than the H Ly- line in the Sun (Lemaire et al. 2002), it appears that sufficient flux is present in the stellar H Ly- wings to pump Fe II and cause fluorescence observed in the spectra shown in Fig. 4. The fact that Ori does not show any stellar emission in Ly- may provide the explanation for the weakness of the fluoresced Fe II emission line near 1135 noted earlier in Section 4.
7 Time Variation: Beta Ceti
One star in our sample, Beta Ceti, showed substantial flux variation during the exposure. Light curves (Fig. 7) were created by considering the raw, time-tag FUSE data. Each of the 10 Ceti exposures was combined into a single time-tag file using the TTAG_COMBINE routine in the FUSE software. The detector image from this combined data-set was inspected and an area bounding the emission line selected. Another area of the same size lying either above or below the spectrum was also selected to estimate the level of the detector background.
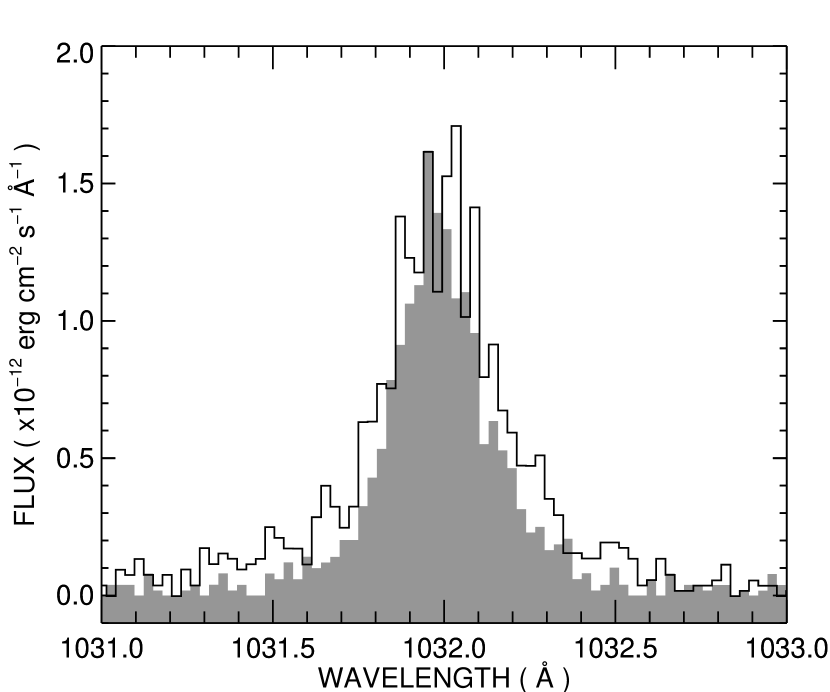
For each area, the number of photons arriving in 100 s time bins was determined throughout the observation. The O VI light curve was created from the LiF1A and LiF2B 1032 lines, while the C III light curve was created from the 977 lines in the SiC1B and SiC2A channels summed with the 1176 lines from the LiF1B and LiF2A channels.
The C III and O VI light curves show the same features, namely a rise in the fluxes of the lines by around 50% during the observation, followed by a fall to the original flux level at the beginning of the exposure. The rise and fall times are comparable at 20ks each. The increase in flux of the 1032 line is simply due to a broadening of the line profile as illustrated in Fig. 8. The flux at the center of the line remains constant, and the added emission arises at both high and low velocities from line center (Fig. 8). Three other flaring events observed in O VI with FUSE exhibited different profiles. AB Dor had a redshifted emission component in O VI that extended to 600 km s-1(Ake et al. 2000). During flares from AU Mic an enhanced core appeared in O VI, in addition to broad wings (in one flare) or red shifted emission (in another flaring event) (Redfield et al. 2002). Thus, this Cet event remains unique with its symmetric broadening and constant core.
Coronal emission in Cet measured with EUVE, exhibited flaring events during August 2000 (Ayres et al. 2001b; Sanz-Forcada et al. 2003), however they lasted longer than one day. Ceti is a slow rotator (= 4 km s-1; Fekel 1997) so the O VI enhancement does not appear related to the passage of active regions across the disk, and most likely represents a long chromospheric-transition region flaring episode.
Many stars exhibit rapid flux increases in transition region lines Si IV and C IV. However these flares typically have rise times, on the order of a few minutes or less [cf. the dwarf stars, AD Leo (Bookbinder et al. 1992), AB Dor (Gómez de Castro 2002), and AU Mic (Robinson et al. 2001)]. The active dwarf binary HR 1099 showed a rise time of about 1.5 hours in one event (Ayres et al. 2001a), but no events comparable to the 5.5 hr rise observed here. A RS CVn-type binary, And did undergo ultraviolet flaring (Baliunas et al. 1984) in an event that lasted for about 5 hours. Although most normal single giants have not shown transition region flaring, the bright giant Vel (K4Ib-II) and Ceti have exhibited coronal flare episodes lasting from minutes to days (Ayres et al. 1999, 2001b; Sanz-Forcada et al. 2002). It is plausible that the enhancement of Beta Cet in the transition region lines corresponds to such a coronal event detected in these other stars.
A few transition region line profiles have been measured during stellar flares but no consistent pattern emerges. The flare star AD Leo showed a substantial (up to 1800 km s-1) redshift in its C IV 1550 emission during a flare (Bookbinder et al. 1992). In HR1099, broad and narrow components of transition region lines of Si III, Si IV, C IV, and N V remained present, but the flux of one or the other component increased in flares (Ayres et al. 2001a). In AU Mic, a single broad line of Si IV appeared that alternately became shifted towards longer and shorter wavelengths during a flare (Linsky and Wood 1994). Another flare in AU Mic showed no change in the Si III line profile but simply a flux enhancement (Robinson et al. 1992). Line profiles during flares in the active rapidly rotating dwarf, AB Dor are not always the same, but frequently show redshifts (Gòmez de Castro 2002, Ake et al. 2000), although rapid broadening of the C IV lines to several hundred km s-1 is observed in the strongest flares. The broadening of the Beta Ceti profile is within the range of diverse profiles found in other stars during flares, but the rise time appears anomalously long.
8 Density Diagnostics
The FUSE region contains two strong transitions from C III, (977 and 1176), whose ratio is principally sensitive to electron density in optically thin plasmas over the range 108–1011 cm-3 (cf. Dupree et al. 1976). These transitions have been widely utilized in solar studies, and more recently in dwarf stars using FUSE spectra (see Redfield et al. 2002). However if one or both of the lines are optically thick, a simple ratio diagnostic can not be used. Signs of optical depth in the stellar 977 line were first noted in several targets from ORFEUS spectra indicated by anomalous widths and relative fluxes (Dupree & Brickhouse 1998). Spectra from HST and FUSE illustrate optical depth effects as well (DelZanna et al. 2002, Redfield et al. 2002). FUSE spectra of luminous stars reveal not only asymmetries in the 977 line (see Sec. 11.2 and Fig. 9), but signs of anomalous ratios among components of the 1176 multiplet too (see Fig 10). As compared to the profile in the quiet Sun, this multiplet is compromised by optical depth effects. The profiles of 1176 in the stars are generally not dominated by the central component (1175.709, ) of the six transitions forming the multiplet as they are in the Sun. The central transition shows the greatest effect of optical depth where, near the solar limb, it becomes weaker by as much as a factor of 2 (Doyle & McWhirter 1980). Only in the FUSE spectrum of Gem does the 1176 profile appear to be optically thin, however there are signs from profile fitting and bisections that the 977 transition in this star is not optically thin. We conclude that the 1176/977 multiplet ratio can not be applied to infer electron density in the chromospheres of these luminous stars.
The relative strengths of certain members of the 1176 multiplet can indicate electron density if they can be separated. The 2–2 transition (1175.709) is the strongest, and in the optical thin case, its ratio (or the ratio of the blend of 1175.709 [line d] and 1175.587 [line c]) relative to 1175.983 (line e) is sensitive to density over the range 108–10 cm-3. Excluding the strongest line from the multiplet, the ratio of 1175.983 (line e) to 1175.260 (line b), 1175.587 (line c) or 1176.367 (line f), could be used if sufficient signal is available; they are also sensitive to density between 108 and 1010 cm-3. Only Gem appears to have an optically thin multiplet in which these ratios can be used. Using a profile of 1176 from the combined LiF2A and LiF1b segments for Gem, we fit the six components of the multiplet simultaneously with Gaussians by adopting the laboratory wavelength separations and holding all lines in the multiplet to the same full width at half maximum. The line ratios, , , , and set a lower limit on the electron density of 109 cm-3 for a temperature T=80,000K using rates from CHIANTI (Young et al. 2003). Spectra with longer exposure times are needed to constrain a high density limit.
9 Profile-Fitting
Because some emission lines from cool stars do not appear gaussian in shape, a practice (Wood et al. 1997) has developed to invoke multiple gaussian components to characterize the line profiles. The C III (977) and O VI (1032) lines are the strongest stellar emission lines in these spectra and most amenable to multiple component fits. Our line-fitting procedure is applied directly to the spectrum of photon counts because this technique enables proper assessment of errors.
The reason for a preference for photon-fitting derives from the characteristics of the spectrum and the FUSE detectors. The background level of FUSE spectra is extremely low and, coupled with the intrinsically low continuum levels of cool stars, results in the spectra containing typically 0 to 2 counts per bin outside of emission lines and in extended line wings. Measurement errors for such low count levels are not distributed according to Gaussian statistics, and so the minimization of to derive emission line parameters is not appropriate for such spectra (e.g., Nousek & Shue 1989).
The method employed here is to minimize the -statistic (Cash 1979) which treats the statistics for small counts per bin data correctly. is defined as
| (1) |
where is the number of data-points, is the function fitted to the data (dependent on parameters ), and is the number of counts in bin . In the present case the emission lines are treated as a superposition of one or more Gaussians and a linear background. Both background and lines are fit simultaneously. Minimization of is performed using Powell minimization through a routine available in IDL (powell.pro). Results of the fits for C III 977 and O VI 1032, are discussed below.
9.1 C III, 977
The C III 977 line is affected by interstellar absorption or central reversals in several stars, and for these stars we omit from the fit those points affected by the absorption. The C III 977 transition is fit by a single Gaussian profile. All of these single gaussians are shifted to longer wavelengths which, if representing coherent mass motions in the atmospheres would suggest the presence of infalling material. If symmetric emission is simply shifted to longer wavelengths, the infalling emission region must arise from the whole atmosphere behaving coherently. Of course stars can have complex surface structures with an uneven distribution of regions of activity that produce departures from symmetry in the line profiles. In solar magnetic structures, a restricted emission region produces profiles characterized by red shifts in transition region lines (Doschek et al. 1976; Teriaca et al. 1999; Peter & Judge 1999),555The SUMER spectrograph on the ESA/NASA Solar and Heliospheric Observatory (SOHO) mission, used for most of these measurements, has lower spectral resolution than FUSE, – a 2-pixel element covers 0.09Å or R12,000 so that detailed shapes of the narrow solar emission line profiles can not be measured. although anomalous center-to-limb behavior suggests other mechanisms are present (Achour et al. 1995 and references therein). Dwarf stars also show redshifted emission in transition region lines (Wood et al. 1997; Redfield et al. 2002). In the luminous giant and supergiant stars observed with FUSE, it appears more likely to assume as a working hypothesis that there is opacity in the C III 977 line resulting from outflowing material and causing the appearance of a red shift. Radiative transfer effects (Hummer & Rybicki 1968) can cause the appearance of a red shifted profile resulting from increased opacity on the blue side of the line. Semi-empirical models of luminous stars have demonstrated such asymmetries in chromospheric line profiles (cf Lobel & Dupree 2001).
The presence of such opacity can be investigated by fitting a Gaussian profile only to the long wavelength wing of the line, eliminating from the fit, both the peak emission and the short-wavelength side of the line profile from the peak to 200 km s-1. These wing fits are also shown in Fig 9 and parameters listed in Table 6. The one-sided Gaussian fits predict a line center that is less than 5 km s-1 from the predicted photospheric velocity of all stars. The resultant fits are consistent with the idea that the observed profiles are asymmetric with the short wavelength side of the profile subject to absorption.
For several targets, it is useful to further characterize these line profiles using a bisection technique. The bisector of a symmetric emission line should remain at constant wavelength (or velocity) for all parts of the profile. To determine the bisectors, the profiles were smoothed, and cut into 25 segments, each of flux strength 1/25 of the profile peak. The weakest part of the profile ( 5 counts) was not included. The centroid of each segment was determined omitting regions crossing the interstellar absorption feature. The resulting bisectors of the C III 977 emission in 5 targets (Fig. 11) show that these profiles are not symmetric. Certain systematics are apparent from Fig. 11. Towards the base of the lines the bisector shifts toward negative velocities which could arise from geometric blocking by the stellar disk at high positive velocities and/or decreased wind opacity at high negative velocities causing line emission to appear. In 31 Com, the core of the 977 line itself appears asymmetric with enhancement at positive velocities, much like the O VI 1032 profile in Dra (see following text). Both profile fitting and bisectors suggest that opacity is present in the C III 977 profile in all targets except Tau where the signal is weak.
9.2 O VI, 1032
The O VI 1032.926 (Kaufman & Martin 1989) profile has extra emission in the wings of most targets, and as expected, 2 Gaussian curves appear to produce a better fit to the profile than a single curve (see Fig. 12 and Table 7). Centroids of the narrow and wide Gaussian appear coincident in Car and Dra, but they are separated in the remaining 4 targets where it can be measured. Three of these stars ( Gem, 31 Com, and Aqr) show a narrow component that is shifted to longer wavelengths than the wide component. Cet has the opposite shift: the narrow component is shifted to shorter wavelengths. The ratio of widths of wide:narrow vary between a factor of 1.7 to 2.9. The flux in the narrow component is generally larger by a factor of 1.1 to 2.6 than the flux in the broad component except for Car (0.94) and Aqr (0.40).
The physical interpretation of a 2 Gaussian fit to 1032 is not obvious (see Sec. 11.2). Fitting the long wavelength side of the profile with a single Gaussian is also shown in Fig. 12 and Table 8 with the exception of Tau. Evidence for absorption on the short wavelength side appears in all cases. A line bisecting the smoothed O VI, 1032 profile (Fig. 13 and Fig. 14) demonstrates asymmetries in all stars. The line cores also merit notice. Line center, where the optical depth is largest, might be expected to show the first signs of opacity. Beta Dra and 31 Com show the greatest velocity variation of the bisector at the peak of the profile. The cores are asymmetric with extra emission on the long wavelength side. We suggest this is another sign of opacity and outflow.
Information is provided by a direct comparison of members of the O VI multiplet. Since oscillator strengths of 1032/1037 are in the ratio 2:1, the 1032 line has a larger optical depth than 1037. Overlaying the actual 1032 profile (divided by 2) on the 1037 spectrum, we find the short wavelength wing of 1032 lies below the corresponding short wavelength side of the 1037 profile (except for Beta Dra which has substantial H2 absorption.) This lends additional support to the presence of opacity in O VI.
10 H2 Absorption
The weaker component of the O VI multiplet, 1037.617, is shown in Fig. 15. Nearby is C II emission. The scaling of the 2 Gaussian fits to the 1032 line, reduced by a factor of 2 representing the optically thin ratio, gives a reasonable fit to the 1037 emission although usually differs in detail. This procedure illustrates the presence of absorption by interstellar H2 near the 1037 line in the spectra of Dra and Aqr (Fig. 15). The corresponding H2 transitions are shown in the appropriate panels of Fig. 15. The position of H2 absorption was computed from the files made available by S. R. McCandliss as on the FUSE website (http://www.pha.jhu.edu/stephan/h2ools2.html), for a column density of 1018 cm2, T=100K, and b = 5 km s-1 (McCandliss 2003). It is not surprising that these 2 stars in our sample, being among the most distant, show evidence of absorption. These two stars are near the plane of our Galaxy and located in the single sector where absorption has been detected by FUSE in the spectra of white dwarfs between 100 and 200 pc distant (Lehner et al. 2003). Lehner et al. suggest that the in the local interstellar medium may occur as one large diffuse cloud, possibly an extended thin sheet.
11 Discussion
FUSE spectra show that warm atmospheres, with temperatures up to and including 300,000K (the temperature of formation of O VI) are present in all stars, except the M supergiant, Ori (see Fig. 1). Alpha Tau is particularly interesting because X-rays have not been detected from this star (Hünsch et al. 1996) yet there is clearly high temperature (3 105K) plasma in the atmosphere. By analogy with solar coronal holes, the coronal temperature could be less where the high speed wind originates and a high temperature stellar corona might not be present where there is a strong wind. The supergiant Ori is an obvious extreme example. In the Sun, the underlying energy flux is comparable between closed and open magnetic regions (Withbroe & Noyes 1977), but in open regions, the energy goes into driving the wind, and not into heating the atmosphere.
11.1 Systematic Flux Variations
The surface fluxes of the C III and O VI lines for each star were calculated using the Barnes-Evans relationship (Barnes, Evans, & Moffett 1978) between color and surface brightness. The surface fluxes decrease systematically towards lower effective temperatures (Fig. 16). The C III and O VI fluxes are tightly correlated (see Fig. 17) and, by contrast the X-ray flux exhibits more variation suggesting different heating mechanisms. The decay of the transition region lines appears similar to that of C IV in many giant stars, and distinct from the chromospheric Ca II behavior (Fig. 18). The rapid decay of the transition region emissions (C III, C IV, and O VI) with temperature is reminiscent of models of magnetic dynamo behavior (Rutten & Pylyser 1988; Dupree et al. 1999) in contrast to acoustic models (Buchholz et al. 1998).
The enhancement of surface emission of the transition lines in 31 Com, a rapidly rotating giant, over that in other giants is consistent with formation by a magnetic dynamo process which becomes vigorous in fast rotators.
11.2 Line Profiles
Displaced Gaussian profiles have been observed in transition region emission lines in the Sun (Doschek et al. 1976; Peter & Judge 1999; Teriaca et al. 1999), and a wide variety of cool stars (Wood et al. 1997; Redfield et al. 2003, and this paper). In the Sun, when observing a restricted atmospheric region ( 1–2 arcsec in size), gaussians shifted both to shorter and longer wavelengths are found. The source of the red-shifted emission has been attributed to many causes (unidirectional mass flows along magnetic loop structures, microflaring, heating effects etc.), but no definitive identification of the causes of the redshifts has emerged (Peter 2004).
The origin of the broad component in stellar line profiles of Si IV and C IV has been ascribed to microflare heating of the transition region (Wood et al. 1997) much as “explosive events” occur on the Sun. Additional evidence for this conjecture has been offered by the increase in the relative contribution of the broad component to the total flux accompanied by an increase in the C IV line flux and X-ray flux. This correlation suggested that enhanced heating contributes to the broad profile (Wood et al. 1997). The C III profiles studied here do not require two Gaussians (however their distinctive asymmetries are discussed below). Moreover, the 2 components of O VI do not behave similarly to C IV in all stars (see Fig. 19) and show no systematic dependence on activity level. Thus, for luminous stars the behavior of a broad component does not appear similar to that identified in dwarf stars (Redfield et al. 2002). If such a relationship exists, it appears to be confined to the Si IV and C IV lines, as found by Wood et al. (1997) and does not extend to lower or higher temperatures.
Detailed studies of the C IV profiles in the Sun show that 2-component fits are required only in the network regions, and not in the internetwork areas where 1 Gaussian suffices to match the profile. Moreover emission from explosive events or transient brightenings is not related to the broad wings in the Sun (Peter & Brković 2003). A remaining possibility to interpret 2-Gaussian fits appeals to the geometry of the transition region. Peter (2001) suggests that the broad wings on the solar disk originate from Alfvèn wave-heated coronal funnels that accelerate the solar wind. Such broad wings are very apparent when viewing sections of the solar corona along a line of sight that traverses a coronal hole where a fast acceleration occurs. Outflow velocities 200 km s-1 significantly broaden the line profile (Miralles et al. 2001).
The luminous stars in this survey have extended atmospheres due in part to their low effective gravity, and it appears possible that much of the line broadening may be attributed to extension and expansion. This was first suggested by the observation of broad emission lines in hybrid stars as measured with IUE (Hartmann et al. 1981).
Analysis of the line profiles for dynamical signatures offers an explanation. The shapes of emission line profiles can give clues to the atmospheric dynamics through the presence of line asymmetries. As Hummer & Rybicki (1968) first noted (and more recently Lobel & Dupree 2001), a differential expansion (or contraction) can cause red (or blue) asymmetries of the line profile. In complex multicomponent atmospheric modeling, when spatially averaging the contributions from many effectively-optically thin components, each with potentially different velocity structures, the resulting line profile will be an appropriately weighted sum of the contribution function of each component.
The opacity at line center, for a thermally broadened line is proportional to where, is the elemental abundance with respect to hydrogen; , the wavelength of the line; , the line oscillator strength; the mass of the atom; the temperature of formation; and is the column density of electrons over the line forming region. Although we do not yet have detailed models of the atmospheres of these stars, the atomic physics alone suggests that of the two major emission lines in the FUSE region, C III (977) and O VI (1032), the carbon line should have higher opacity (cf. Harper 2001 also). This amounts to a factor of 2.5 for values of alone. It is expected that the electron column density will be higher for the C III line forming region than for that of O VI since the emission measure distribution at C III temperatures exceeds that found at the higher temperatures of O VI (cf. Sanz-Forcada et al. 2003). Thus we might expect that the 977 profile would be more sensitive to dynamics.
Inspection of the C III line profiles (cf. Fig. 9) shows a broad line, usually crossed by interstellar absorption, that is clearly asymmetric, displaying a lower flux at negative velocities than at positive velocities. This is obvious in the spectra of Car, Aqr, Dra, and Tau. Similar (although less pronounced) asymmetries are found in the C III profiles of Cet and Gem as illustrated by the single Gaussian fits to the emission. In both stars the line is asymmetric, suggestive of excess opacity in the line at negative velocities. The 977 line from the fast rotating giant 31 Com possesses a FWHM 255 km s-1. The of this giant (57 km s-1, Strassmeier et al. 1994) is about half the observed line width, so clearly a line broadening mechanism in addition to rotation is present, perhaps extension of the atmosphere. The Gaussian fit to the long wavelength wing of the profile suggests that additional opacity is present in 31 Com.
The O VI 1032 profiles appear more symmetric than those of C III 977. This might be expected because the opacity is less than in the carbon resonance line. It is not straightforward to predict the effects of opacity on the line profile. A higher optical depth is expected near the line center simply because the absorption profile reaches a maximum; thus it is reasonable to expect the core to show signs of opacity.
All of the O VI lines (except for Tau which remains indeterminate because the count level is low) show an asymmetric profile. Two characteristics are apparent, irrespective of the absolute offset: three stars ( Dra, Cet, and 31 Com) show a positive shift at the top of the profile (similar to that found in C III 977) indicative of increased opacity on the short wavelength side. This is the signature of absorption produced by outward moving material in these stars.
All bisectors exhibit a shift to negative velocities towards the base. Two interpretations for this behavior appear plausible. Either the opacity in a wind decreases as the expansion velocity approaches 100 km s-1, or the extended stellar atmosphere blocks the extreme outward velocity of the atmosphere, creating a shift of the centroid to shorter wavelengths, or both.
Line widths are informative as well. Both Car and Aqr show exceptionally narrow core profiles, when compared to stars of similar luminosity, for instance Dra. And as discussed further in the following section, the O VI width in most objects is comparable to that of the C IV line.
11.3 Comparison with Ultraviolet Emission Lines
The FUSE spectra of O VI sample the highest temperature transition region lines for which many line profiles are available; the C III profile is the most sensitive to optical depth. It is of interest to trace the atmospheric dynamics by comparing emission from C IV, Si III, and Mg II to the FUSE profiles. Profiles of the supergiants Aqr and Dra are shown in Fig. 20. Whereas Aqr shows good agreement between the asymmetry of the C III (977) line and the Mg II, indicating outflow and absorption at velocities up to 100 km s-1or more, Dra spectra indicate that the outflow does not occur at the cooler levels of Mg II, but at the higher temperatures represented by C III. Variable opacity has been noted on the short wavelength side of the C IV line in Dra (Wood et al. 1997) which provides evidence for a wind at transition region temperatures. It is thought that Dra may be in a pre-hybrid phase. Alpha Aqr is a well-known ‘hybrid’ star where the wind is well developed and detectable throughout the atmosphere; supersonic acceleration has even been identified in the chromosphere (Dupree et al. 1992). The C IV and O VI line are similar in width in both supergiants and the asymmetry of the peak of the core emission persists in C III, C IV, and O VI in Dra. Comparison of profiles for the giant stars are shown in Fig. 21, Fig. 22 and Fig. 23. With the exception of Gem, the other giant stars, Cet, 31 Com, and Tau show opacity in the C III line which is frequently matched with a similar asymmetry in Mg II or Si III. Beta Gem is more like Dra with chromospheric infall indicated by the Mg II line shape. Since these spectra come from diverse sources, including IUE, HST/GHRS and HST/STIS, they have been scaled in flux and at times shifted to compare profile shapes.
It is puzzling that the O VI (1032) line widths are generally comparable to the C IV (1548) transitions and both are broadened in excess of pure thermal broadening. In the solar network, O VI is observed to be broader than the C IV line (Peter 2001), by a factor of 1.2 to 1.4; the non-thermal contributions are also higher in the Sun for O VI than C IV. The observed O VI line width of the core exceeds the thermal width expected at 3105K by factors of 3 or more. Clearly atmospheric extension, turbulence, and or opacity can affect these line profiles.
Could the character of the atmosphere change dramatically at the 200000K level from a relatively homogeneous outflow (indicated by the broad asymmetric C III profiles) to an atmosphere covered by magnetic loop structures signaled by the narrow redshifted C IV and O VI lines? We have no estimate of the densities in the regions forming C IV and O VI so it is unclear whether small scales are indicated (as they are for dense coronal material). Lower turbulent velocities and/or less geometrical broadening might be plausible in such structures although they are not required for confinement because thermal motion of material at the temperature of 3105K (18 km s-1) is an order of magnitude less than the escape velocity from giant stars (200 km s-1). As noted earlier, identifying the redshifted emission profiles of O VI with physical atmospheric downflows requires synchronous motion among all putative loops covering the giant or supergiant stars, or a judicious combination of many regions with individual dynamics that systematically produce a redshifted line. We can not firmly eliminate some distribution of emitting regions over the stellar surface that produces a red-shifted asymmetric emission line profile. However the identical nature of the C IV and O VI line profiles (measured at different times) suggests they are not dominated by transient active regions or varying downflow emission profiles.
Could wind opacity effects narrow the lines causing O VI and C IV to be less broad than C III? Without a detailed model, it is difficult to assess the relative opacities in the C IV and O VI transitions. A comparison of the quantity, using solar abundances suggests that C IV opacity values exceed O VI by 20%. However, luminous stars are evolved, and it is well known that the CN cycle depletes Carbon (enhancing Nitrogen). Although classical studies suggest that both carbon and oxygen are underabundant with respect to solar values (Luck & Lambert 1985), there is currently controversy about the difficult-to-measure oxygen abundances (Fulbright & Johnson 2003). The line shapes strongly suggest that opacity plays a role; clearly modeling is needed.
11.4 Relationship to Coronal Lines
Two or our targets show coronal line emission in the FUSE region, and others are X-ray sources. The FUSE spectra suggest that the coronal lines occur near photospheric radial velocities, and so do not participate in any outflow (also see Redfield et al. 2003). This is consistent with the fact that plasma at coronal temperatures (here 6) must be confined by magnetic fields in these stars. Such confinement was postulated when Fe XVIII and Fe XIX species were first identified as a stable feature in the EUVE spectra of the giant stars of Capella (Dupree et al. 1993; Young et al. 2001). Confinement is consistent with the small sizes inferred from the high densities of the coronal regions at these temperatures (Sanz-Forcada et al. 2003). These FUSE results suggest an inhomogeneous atmosphere in which small magnetic features at high temperature are anchored in the presence of a warm expanding atmosphere.
12 Conclusions
-
1.
The presence of warm 3105 K plasma, indicated by O VI emission appears ubiquitous and extends across the HR diagram. The K5 giant, Tau is the coolest giant to exhibit O VI known to date.
-
2.
The atmosphere of the M supergiant - Ori does not exhibit any C III or O VI emission suggesting maximum temperatures less than 80000K if collisionally dominated.
-
3.
The decay of stellar surface emission with decreasing temperature for both C III and O VI suggests that similar magnetic processes are responsible for these emissions.
-
4.
An outward acceleration of 80000K material, clearly indicated by the C III emission profiles occurs in all these stars from F0 II through K5 III ( Tau) clearly demonstrating the presence of a warm wind.
-
5.
The O VI 1032 emission gives some evidence also of wind opacity in most stars suggesting that warmer winds of 300000K may be present.
-
6.
Semi-empirically modeling of atmospheres and winds and of the emergent chromospheric and transition region line profiles is needed for luminous cool stars.
References
- (1) Achour, H., Brekke, P., Kjeldseth-Moe, O., & Maltby, P. 1995, ApJ, 453, 945
- (2) Ake, T., B., Dupree, A. K., Young, P. R., Linsky, J. L., Malina, R. F., Griffiths, N. W., Siegmund, O. H. W., & Woodgate, B. E. 2000, ApJ, 538, L87
- (3) Ayres, T. R., Brown, A., Harper, G. M., Osten, R. A., Linsky, J. L., Wood, B. E., & Redfield, S. 2003, ApJ, 583, 963
- (4) Ayres, T. R., Brown, A., Osten, R. A., Huenemoerder, D. P., Drake, J. J., Brickhouse, N. S., & Linsky, J. L. 2001a, ApJ, 549, 554
- (5) Ayres, T. R., Osten, R. A., & Brown, A. 1999, ApJ, 526, 445
- (6) Ayres, T. R., Osten, R. A., & Brown, A. 2001b, ApJ, 562, L83
- (7) Ayres, T. R., Simon, T., Stern, R. A., Drake, S. A., Wood, B. E. & Brown, A. 1998, ApJ, 496, 428
- (8) Ayres, T. R. et al. 1995, ApJS, 96, 223
- (9) Baliunas, S. L., Guinan, E. F., & Dupree, A. K. 1984, ApJ, 282, 733
- (10) Barnes, T. G., Evans, D. S., & Moffett, T. J. 1978, MNRAS, 183, 285
- (11) Beavers, W. I., & Eitter, J. J. 1986, ApJS, 62, 147
- (12) Bookbinder, J., Walter, F., & Brown A. 1992, ASP Conf. Ser. 26, Seventh Cambridge Workshop on Cool Stars, Stellar Systems, and the Sun, ed. M. Giampapa & J. Bookbinder, (San Francisco: ASP), 27
- (13) Brown, A., Deeney, B. D., Ayres, T. R., Veale, A., & Bennett, P. D. 1996, ApJS, 107, 263
- (14) Buchholz, B., Ulmschneider, P., & Cuntz, M. 1998, ApJ, 494, 700
- (15) Carpenter, K. C., Robinson, R. D., Harper, G. M., Bennett, R. D., Brown, A., & Mullan, D. J. 1999, ApJ, 521, 382
- (16) Cash, W. 1979, ApJ, 228, 939
- (17) Curdt, W., Brekke, P., Feldman, U., Wilhelm, K., Dwivedi, B. N., Schühle, U., & Lemaire, P. 2001, A&A, 375, 591
- (18) Del Zanna, G., Landini, M., & Mason, H. 2002, A&A, 385, 968
- (19) deMedeiros, J. R., & Mayor, M. 1999, A&AS, 139, 433
- (20) Dere, K. P., Landi, E., Young, P. R., & DelZanna, G. 2001, ApJS, 134, 331
- (21) Doschek, G. A., Bohlin, J. D., & Feldman, U. 1976, ApJ, 205, L177
- (22) Doyle, J. G., & McWhirter, R. W. P. 1980, MNRAS 193, 947
- (23) Drake, S. A., Brown, A., & Linsky, J. L. 1984, ApJ, 284, 774
- (24) Dring, A. R., Linsky, J., Murthy, J., Henry, R. C., Moos, W., Vidal-Madjar, A., Audouze, J., & Landsman, W. 1997, ApJ, 488, 760
- (25) Dupree, A. K., & Brickhouse, N. S. 1995, in IAU Symp. 176: Poster Proceedings, ed. K. G. Strassmeier, (Vienna: Institut für Astronomie Universität Vienna), 184
- (26) Dupree, A. K., & Brickhouse, N. S. 1998, ApJ, 500, L33
- (27) Dupree, A. K., Brickhouse, N. S., Doschek, G. A., Green, J. C., & Raymond, J. C. 1993, ApJ, 418, L41
- (28) Dupree, A. K., Foukal, P. V., & Jordan, C. 1976, ApJ, 209, 621
- (29) Dupree, A. K., & Reimers, D. 1989, in Exploring the Universe with the IUE Satellite, ed. Y. Kondo, (Boston: Kluwer), 321
- (30) Dupree, A. K., Whitney, B. A., & Avrett, E. H. 1992, in ASP Conf. Ser. 26, Seventh Cambridge Workshop on Cool Stars, Stellar Systems, and the Sun, ed. M. Giampapa & J. Bookbinder, (San Francisco: ASP), 525
- (31) Dupree, A. K., Whitney, B. A., & Pasquini, L. 1999, ApJ, 520, 751
- (32) Fekel, F. 1997, PASP, 109, 514
- (33) Fulbright, J. P., & Johnson, J. A. 2003, ApJ, 595, 1154
- (34) FUSE Observers Guide, V4.0 2002, ed. B. G. Andersson et al. (http://fuse.pha.jhu/edu/support/guide/guide_V4.0.html#INRES)
- (35) General Catalogue of Stellar Radial Velocities (GCRV), 1953, (Carnegie Institution: Washington), Publication 601.
- (36) Gómez de Castro, A. I. 2002, MNRAS, 332, 409
- (37) Harper, G. M. 2001, ASP Conf. Ser. 223, Eleventh Cambridge Workshop on Cool Stars, Stellar Systems, and the Sun, ed. R. J. García López, R. Rebolo, & M. R. Zapatero Osorio, (San Francisco: ASP), 368
- (38) Harper, G. M., Wilkinson, E., Brown, A., Jordan, C., & Linsky, J. L. 2001, ApJ, 551, 486
- (39) Hartman, H., & Johansson, S. 2000, ApJ, A&A, 359, 627
- (40) Hartmann, L., Dupree, A. K., & Raymond, J. C. 1980, ApJ, 236, L143
- (41) Hartmann, L., Dupree, A. K., & Raymond, J. C. 1981, ApJ, 246, 193
- (42) Hummer, D., G., & Rybicki, G. B. 1968, ApJ, 153, L107
- (43) Hünsch, M., & Schröder, K.-P. 1996, A&A, 309, L51
- (44) Hünsch, M., Schmitt, J.H.M.M., Schröder, K.-P., & Reimers, D. 1996, A&A, 310, 801
- (45) Hünsch, M., Schmitt, J.H.M.M., & Voges, W. 1998, A&AS, 127, 251
- (46) Johnson, H. L., Iriarte, B., Mitchell, R. I., & Wisniewskj, W. J. 1966, Comm. Lunar Plan. Lab., 4, 99
- (47) Jordan, C., & Linsky, J. L. 1989, in Exploring the Universe with the IUE Satellite, ed. Y. Kondo, (Boston: Kluwer), 259
- (48) Jordan, C., McMurry, A. D., Sim, S. A., & Arulvel, M. 2001, MNRAS, 322, L5
- (49) Kaufman, V., & Martin, W. C. 1989, J. Opt. Soc. Am., B6, 1769
- (50) Lemaire, P., Emerich, C., Vial, J.-C., Curdt, W., Schuhle, U., & Wilhelm, K. 2002, in Proc. SOHO-11: From Solar Minimum to Maximum, ESA SP-508, 219
- (51) Lehner, N., Jenkins, E. B., Gry, C., Moos, H. W., Chayer, P., & Lacour, S. 2003, ApJ, 595, 858
- (52) Linsky, J. L., & Wood, B. E. 1994, ApJ, 430, 342
- (53) Lobel, A. & Dupree, A. K. 2001, ApJ, 558, 815
- (54) Luck, R. E., & Lambert, D. L. 1985, ApJ, 298, 782
- (55) Marilli, E., Catalano, S., Freire Ferrero, R., Gouttebroze, P., Bruhweiler, F., & Talavara, A. 1997, A&A, 317, 521
- (56) Mazzotta, P., Mazzitelli, G., Colafrancesco, S., & Vittorio, N. 1998, A&AS, 133, 403
- (57) McCandliss, S. R. 2003, PASP, 115, 651
- (58) McMurry, A. D., & Jordan, C. 2000, MNRAS, 313, 423
- (59) Miralles, M. P., Cranmer, S. R., & Kohl, J. L. 2001, ApJ, 560, L193
- (60) Moos, W. H. et al. 2000, ApJ, 538, L1
- (61) Nousek, J. A. & Shue, D. R. 1989, ApJ, 342, 1207
- (62) Perryman, M. A. C. et al. 1997, A&A, 323, L49
- (63) Peter, H. 2001, A&A, 374, 1108
- (64) Peter, H. 2004, IAU Symp. 219, Stars as Suns: Activity Evolution, and Planets, ed. A. K. Dupree & A. O. Benz, (San Francisco: ASP) 575
- (65) Peter, H., & Brković, A. 2003, A&A, 403, 287
- (66) Peter, H., & Judge, P. G. 1999, ApJ, 522, 1148
- (67) Piskunov, N., Wood, B. E., Linsky, J. L., Dempsey, R. C., & Ayres, T. R. 1997, ApJ, 474, 315
- (68) Rao, L. M, Baliunas, S. L., Robinson, C. R., Frazer, J., Woodard, L., & Donahue, R. A. 1993, ASP Conf. Ser. 45, Luminous High Latitude Stars, ed. D. D. Sasselov, (San Francisco: ASP), 300
- (69) Redfield, S., & Linsky, J. 2004, ApJ, 602, 776
- (70) Redfield, S., Linsky, J. L., Ake, T. B., Ayres, T. R., Dupree, A. K., Robinson, R. D., Wood, B. E., & Young, P. R. 2002, ApJ, 581, 626
- (71) Redfield, S., Ayres, T. R., Linsky, J. L., Ake, T. B., Dupree, A. K., Robinson, R. D., & Young, P. R. 2003, ApJ, 585, 993
- (72) Reimers, D. 1977, A&A, 57, 395
- (73) Reimers, D., Hünsch, M., Schmitt, J. H. M. M., & Toussaint, F. 1996, A&A, 310, 813
- (74) Robinson, R. D., Carpenter, K. G., & Brown, A. 1998, ApJ, 503, 396
- (75) Robinson, R. D., Linsky, J. L., Woodgate, B. E., & Timothy, J. G. 2001, ApJ, 554, 368
- (76) Robinson, R. D. et al. 1992, ASP Conf. Ser. 26, Cool Stars, Stellar Systems, and the Sun, ed. M. S. Giampapa & J. A. Bookbinder, (San Francisco: ASP), 31
- (77) Rutten, R. G. M., & Pylyser, E. 1988, A&A, 191, 227
- (78) Sahnow, D. J. et al. 2000, ApJ, 538, L7
- (79) Sanz-Forcada, J., Brickhouse, N. S., & Dupree, A. K. 2002, ApJ, 570, 799
- (80) Sanz-Forcada, J., Brickhouse, N. S., & Dupree, A. K. 2003, ApJS, 145, 147
- (81) Schaller, G., Schaerer, D., Meynet, G., & Maeder, A. 1992, A&AS, 96, 269
- (82) Smith, R. K., Brickhouse, N. S., Liedahl, D. A., & Raymond, J. C. 2001, ApJ, 556, L91
- (83) Strassmeier, K. G., Washüttl, A., & Rice, J. B. 1994, IBVS, 3994, 1
- (84) Teriaca, L., Banerjee, D., & Doyle, J. G. 1999, A&A, 349, 636
- (85) Withbroe, G., & Noyes, R. W. 1977, ARAA, 15, 363
- (86) Wood, B. E., Linsky, J. L., & Ayres, T. R. 1997, ApJ, 478, 745
- (87) Young, P. R., Dupree, A. K., Wood, B. E., Redfield, S., Linsky, J. L., Ake, T. B., & Moos, H. W. 2001, ApJ, 555, L121
- (88) Young, P. R., DelZanna, G., Landi, E., Dere, K. P., Mason, H. W., & Landini, M. 2003, ApJS, 144, 135


| Ion | TransitionaaAtomic configuration expressed as lower level () – upper level () where emission corresponds to the transition . | Wavelength (Å) | Tformation (K)bbTemperatures correspond to the temperature of peak emission rate in a collisionally dominated plasma and were calculated with v.4 of the CHIANTI database (Young et al. 2003) using the ionization balance calculations of Mazzotta et al. (1998) and an electron density of 1010 cm-3. |
|---|---|---|---|
| Fe II | ccFe II emission in these stars results from fluorescent and cascade processes involving many configurations, and the temperature of ‘formation’ does not strictly apply since the population of levels is not linked to the local electron temperature. | 1106–1143 | 1.8 104 |
| C III | 2s22p 1S0 – 2s2p2 1P1 | 977.02 | 8.3 104 |
| C III | 2s2p 3P0,1,2 – 2p2 3P0,1,2 | 1176.ddThere are six components to this multiplet. | 8.3 104 |
| O VI | 2s 2S1/2 – 2p 2P3/2 | 1031.92 | 2.9 105 |
| O VI | 2s 2S1/2 – 2p 2P1/2 | 1037.61 | 2.9 105 |
| Fe XVIII | 2p5 2P3/2 – 2p5 2P1/2 | 974.86 | 6.6 106 |
| Fe XIX | 2p4 3P2 – 2p4 3P1 | 1118.07 | 7.9 106 |
| Star | HD | Sp. Type | Distance | V | VR | aaThe factor, , relates the flux observed at Earth to the stellar surface flux and with (mas) evaluated from the Barnes-Evans relationships Barnes et al. (1978). Numbers in parentheses denote the multiplying power of 10 in the value of . | vradbbvrad denotes the heliocentric radial velocity of the star (km s-1). | References |
|---|---|---|---|---|---|---|---|---|
| (pc) | (km s-1) | |||||||
| Cet | 4128 | K0 III | 29.4 | 2.02 | +0.72 | 6.74(15) | +13.4 | 1,2,3,5 |
| Tau | 29139 | K5 III | 20.0 | 0.86 | +1.23 | 3.09(14) | +54.0 | 1,2,3,4 |
| Ori | 39801 | M2 Iab | 131 | 0.42 | +1.64 | 5.31(13) | +21.0 | 1,2,3 |
| Car | 45348 | F0 II | 95.9 | 0.75 | +0.24 | 3.50(15) | +20.5 | 1,2,3 |
| Gem | 62509 | K0 IIIp | 10.3 | 1.15 | +0.75 | 2.69(15) | +2.81 | 1,2,3,4 |
| 31 Com | 111812 | G0 IIIp | 94.2 | 4.94 | +0.55 | 1.94(17) | 1.25 | 1,2,3,4 |
| Dra | 159181 | G2Ib–IIa | 110 | 2.79 | +0.68 | 1.60(16) | 21.6 | 1,2,3,4 |
| Aqr | 209750 | G2Ib | 230 | 2.95 | +0.66 | 2.01(16) | +6.8 | 1,3,5 |
Note. — Reference: (1) Perryman et al. 1997; (2) GCRV 1953; (3) Johnson et al. 1966; (4) deMedeiros & Mayor 1999; (5) Beavers & Eitter 1986.
| Star | HD | Sp. Type | Dataset | Obs. Date | Exposure () | Apert. |
|---|---|---|---|---|---|---|
| Cet | 4128 | K0 III | P1180501 | 2000 Dec 10 | 13.1 | LWRS |
| Ori | 39801 | M2 Iab | P1180901 | 2000 Nov 3 | 10.3 | LWRS |
| Tau | 29139 | K5 III | P1040901 | 2001 Jan 14 | 12.2aaThe SiC 1B channels were on the target for a total of 1790 s and the SiC 2A exposure totaled 3182 s. | MDRS |
| P2180601 | 2003 Sep 14 | 6.3 | LWRS | |||
| P2180602 | 2003 Sep 15 | 12.2 | LWRS | |||
| P2180603 | 2003 Sep 15 | 10.4 | LWRS | |||
| Car | 45348 | F0 II | P1180101 | 2000 Dec 11 | 5.6 | LWRS |
| P2180101 | 2001 Oct 25 | 5.9 | LWRS | |||
| P2180102 | 2001 Oct 26 | 10.7 | LWRS | |||
| Gem | 62509 | K0 IIIp | P1180601 | 2000 Nov 11 | 21.8 | LWRS |
| 31 Com | 111812 | G0 IIIp | P1180401 | 2001 Apr 20 | 12.2 | LWRS |
| Dra | 159181 | G2Ib-IIa | P1180301 | 2000 May 9 | 5.6 | LWRS |
| P2180301 | 2001 Jun 30 | 16.4bbSiC 1B channel: Exposure 3 (1635 s) was not on target. | LWRS | |||
| Aqr | 209750 | G2 Ib | P2180201 | 2001 Jun 16 | 34.3 | LWRS |
| P2180202 | 2001 Oct 7 | 10.5 | LWRS |
| Star | HD | Species | Note | ||
|---|---|---|---|---|---|
| (Å) | (km s-1) | ||||
| Ceti | 4128 | C II | 1334 | +5.8 | 1 |
| Si III | 1206 | +4.5 | 1 | ||
| D I | 1215 | +4.7 | 1 | ||
| O I | 1302 | +6.6 | 1 | ||
| +5.4 | |||||
| Tau | 29139 | Mg II | 2795 | –30. | 2 |
| O I | 1302 | –30. | 2 | ||
| Ori | 39801 | ||||
| Car | 45348 | H Ly- | 1215. | +25. | 3 |
| Gem | 62509 | Mg II () | 2800 | +26.1 | 4 |
| 31 Com | 111812 | Mg II | 2800 | –3.4 | 5 |
| Fe II | 2599 | –2.4 | 5 | ||
| D I | 1216 | –2.7 | 5 | ||
| C II | 1335 | –3.8 | 6 | ||
| O I | 1302 | –2.6 | 6 | ||
| –3.2 | |||||
| Dra | 159181 | Mg II | 2800 | –20. | 7 |
| Aqr | 209750 | Mg II | 2800 | –18 | 8 |
Note. — (1) Measured from STIS spectrum (2) Robinson et al. 1998. (3) Marilli et al. 1997. (4) Dring et al. (1997) find 2 interstellar components at +22.01.8 km s-1 and +33.21.8 km s-1, of which the 22 km s-1 cloud has a larger column density by a factor of 1.7; an average value, weighted by the column density is used, viz.: . (5) Values taken from Dring et al.; in agreement with independent determination by Piskunov et al. (1997). (6) Redfield & Linsky (2004). (7) Measured from GHRS spectra calibrated with Pt Lamp. (8) IUE spectra from Drake et al. (1984).
| Star | C III: 977bbMeasured from SiC2A channel. | C III: 1176ccMeasured from LiF2A channel. | O VI: 1032ddMeasured from LiF1A channel. A small background continuum was subtracted from the flux values, although the counts include the total of line plus continuum. | |||
|---|---|---|---|---|---|---|
| Flux | Counts | Flux | Counts | Flux | Counts | |
| Cet | 6.55(13) | 4503 | 3.12(13) | 4686 | 5.86(13) | 10044 |
| Tau | 7.00(14) | 284 | 4.91(14) | 518 | 3.34(14) | 372 |
| Car | 3.40(13) | 4220 | 1.30(13) | 6288 | 2.16(13) | 6949 |
| Gem | 2.90(13) | 3357 | 6.95(14) | 1780 | 1.07(13) | 3177 |
| 31 Com | 1.01(12) | 7141 | 5.65(13) | 8400 | 5.09(13) | 8959 |
| Dra | 1.52(12) | 18203 | 4.54(13) | 11694 | 8.03(13) | 24133 |
| Aqr | 2.77(13) | 6226 | 7.75(14) | 4233 | 1.04(13) | 6188 |
| Star | Gaussian Fit (single) | Gaussian Fit (long side) | ||||
|---|---|---|---|---|---|---|
| Velcenter | FWHM | FluxbbFluxes as measured from the Gaussian fit, should be used for relative contribution only. Numbers in parentheses denote the multiplying power of 10 in the flux value.Gauss. | Velcenter | FWHM | FluxbbFluxes as measured from the Gaussian fit, should be used for relative contribution only. Numbers in parentheses denote the multiplying power of 10 in the flux value.Gauss. | |
| () | () | () | () | () | () | |
| Cet | 15.63.1 | 1312 | 6.020.6(13) | 1.853.0 | 1432 | 7.980.8(13) |
| TauccSingle Gaussian fit to rebinned data. | 10.96.0 | 10010 | 5.700.6(15) | |||
| Car | 11.60.9 | 1803 | 3.600.4(13) | 2.602.5 | 1843 | 4.720.5(13) |
| Gem | 9.101.5 | 1062 | 2.750.3(13) | 0.281.5 | 1022 | 3.580.4(13) |
| 31 Com | 20.31.5 | 2504 | 1.040.1(12) | 4.302.0 | 2814 | 1.260.2(12) |
| Dra | 26.91.3 | 1903 | 1.960.2(12) | 2.804.0 | 2074 | 2.990.3(12) |
| Aqr | 57.52.1 | 1262 | 2.700.3(13) | 0.673.0 | 1572 | 8.520.9(13) |
| Star | 2-Gaussian Fit (narrow) | 2-Gaussian Fit (wide) | ||||
|---|---|---|---|---|---|---|
| Velcenter | FWHM | FluxbbFluxes as measured from the Gaussian fit, should be used for relative contribution only. Numbers in parentheses indicate the multiplying power of 10 in the flux value.Gauss | Velcenter | FWHM | FluxbbFluxes as measured from the Gaussian fit, should be used for relative contribution only. Numbers in parentheses indicate the multiplying power of 10 in the flux value.Gauss | |
| () | () | () | () | () | () | |
| Cet | 20.01.8 | 752 | 2.870.3(13) | 32.12.0 | 19110 | 2.580.3(13) |
| TauccThe O VI profile does not have sufficiently good statistics to attempt a 2 Gaussian profile fit. | 1.452.0 | 1826 | 2.470.2(14) | |||
| Car | 17.62.0 | 873 | 1.020.1(13) | 18.43.1 | 25315 | 1.090.1(13) |
| Gem | 0.1421.5 | 752 | 7.570.8(14) | 7.762.1 | 15715 | 2.960.3(14) |
| 31 Com | 6.771.5 | 1688 | 2.750.3(13) | 9.892.0 | 34420 | 2.290.2(13) |
| Dra | 15.22.0 | 1375 | 4.970.5(13) | 16.21.9 | 23915 | 2.950.3(13) |
| Aqr | 2.481.5 | 994 | 2.790.3(14) | 5.462.0 | 21010 | 6.910.7(14) |
| Star | Gaussian Fit (long side) | ||
|---|---|---|---|
| Velcenter | FWHM | FluxbbFluxes as measured from the Gaussian fit, should be used for relative contribution only. Numbers in parentheses indicate the multiplying power of 10 in the flux value.Gauss | |
| () | () | () | |
| Cet | 5.8510 | 1565 | 7.820.8(13) |
| Car | 1.9915 | 16710 | 3.530.4(13) |
| Gem | 7.556 | 1025 | 1.270.1(13) |
| 31 Com | 7.0215 | 24315 | 5.490.5(13) |
| Dra | 1.3810 | 1828 | 9.120.9(13) |
| Aqr | 8.108 | 1899 | 9.681.0(14) |