Discovery of a Be/X-ray Binary Consistent with the Position of GRO J2058+42
Abstract
GRO J2058+42 is a 195 s transient X-ray pulsar discovered in 1995 with BATSE. In 1996, RXTE located GRO J2058+42 to a 90% confidence error circle with a radius. On 20 February 2004, the region including the error circle was observed with Chandra ACIS-I. No X-ray sources were detected within the error circle, however, 2 faint sources were detected in the ACIS-I field-of-view. We obtained optical observations of the brightest object, CXOU J205847.5+414637, that had about 64 X-ray counts and was just outside the error circle. The optical spectrum contained a strong H line and corresponds to an infrared object in the 2MASS catalog, indicating a Be/X-ray binary system. Pulsations were not detected in the Chandra observations, but similar flux variations and distance estimates suggest that CXOU J205847.5+414637 and GRO J2058+42 are the same object. We present results from the Chandra observation, optical observations, new and previously unreported RXTE observations, and a reanalysis of a ROSAT observation.
binaries
1 Introduction
1.1 Be/X-ray binaries
The majority of the known accretion-powered pulsars are transients in binary systems with Be (or Oe) stars (Apparao, 1994; Coe, 2000). Be stars are main-sequence B stars showing emission in the Balmer lines (Porter & Rivinius, 2003; Slettebak, 1988). This line emission, and a strong infrared excess in comparison to normal stars of the same stellar type, is associated with circumstellar material which is being shed by the star into its equatorial plane. The exact nature of the mass loss process is unknown, but it is thought to be related to the rapid rotation, which is typically near or above 70% of the critical break-up velocity (Porter, 1996; Townsend, Owocki, & Howarth, 2004). Near the Be star the equatorial material probably forms a quasi-Keplerian disk (e.g., Quirrenbach et al., 1997; Hanuschik, 1996), believed to fuel the X-ray outbursts.
In the “normal” outbursting behavior (type I) of a Be/X-ray binary, series of moderate luminosity ( erg s-1) outbursts occur, with each outburst near the periastron passage phase of the system’s wide eccentric orbit (Stella et al., 1986; Bildsten et al., 1997). Some systems also show infrequent “giant” (type II) outbursts, with luminosities of erg s-1 or greater. In most systems there is no clear correlation between X-ray outbursts and optical activity within single outbursts. The X-ray activity however, follows the long-term optical activity cycle of the Be star, in the sense that no outbursts occur in periods where optical indicators of the Be star disk, such as emission, have disappeared. Periods of X-ray quiescence when the Be disk is present are also observed; these may be due to the truncation of the Be star disk well within the neutron star orbit (Negueruela & Okazaki, 2001; Negueruela et al., 2001).
1.2 GRO J2058+42
GRO J2058+42 was discovered as a 198 s pulsar with the Burst and Transient Source Experiment (BATSE) on the Compton Gamma Ray Observatory in 1995, during a giant outburst (Wilson et al., 1995, 1998). In the giant outburst, the pulsar spun-up from a period of 198 s to a period of about 196 s. The giant outburst was followed by a series of normal outbursts, spaced at 55-day intervals. For the first 11 normal outbursts, there was an alternating pattern in 20-50 keV pulsed flux (i.e. odd outbursts, counting from the giant outburst, were brighter than even outbursts). However, the All-Sky Monitor (ASM) on the Rossi X-ray Timing Explorer (RXTE), which observed the phase averaged flux in the 2-10 keV band for 10 of these outbursts, did not see such a pattern, suggesting that the pattern may have been caused by changes in the spectrum or pulsed fraction. Later, the outbursts continued, but the odd-even pattern stopped in the 20-50 keV pulsed flux. All of the outbursts showed frequency increases which, if attributed to mainly orbital effects, required an orbital period of 55 days (Wilson et al., 1998; Wilson, Finger, & Scott, 2000). The outburst behavior, specifically the giant outburst followed by a series of normal outbursts, suggested a Be star companion.
Initially, GRO J2058+42 was approximately located with BATSE (Wilson et al., 1995)
and with the Oriented Scintillation Spectroscopy Experiment (Grove, 1995). In
1996 November, scanning observations with the RXTE Proportional Counter Array
(PCA) further reduced the error region to a 90% confidence 4′ radius
error circle centered on ,
(Wilson, Strohmayer, & Chakrabarty, 1996). Castro-Tirado & Birkle (1996) reported two optical objects, with magnitudes
18.5 and 19.5, respectively, in the RXTE error circle at , and
, (J2000, uncertainty
) on October 15, 1996. However, we found no X-ray object at
either position with ROSAT or Chandra . The ROSAT HRI catalog, available
through HEASARC
(ROSATHRITOTAL)111http://heasarc.gsfc.nasa.gov/W3Browse/rosat/
roshritotal.html
and through MPE (1RXH catalog)222http://www.xray.mpe.mpg.de/cgi-bin/rosat/src-browser,
lists 7 sources in the ROSAT HRI field of view from a 1997 June 23 observation
centered on the RXTE position, but only 3 of these sources were unique and none
were within the RXTE error circle. Recently, Reig, Kougentakis, & Papamastorakis (2004) performed an
optical photometric and spectroscopic analysis of the field around GRO J2058+42
from the Skinakas observatory and suggested the star approximately located at
, (J2000) as its optical
counterpart.
In this paper we report on Chandra observations, archival and new RXTE observations, archival ROSAT observations, and give the details of the optical observations and analysis. The combination of archival and new X-ray and optical data allowed us to pin down the X-ray source and identify its likely optical counterpart with a moderately reddened Be star. We discuss the possible association between a Chandra source and GRO J2058+42.
2 GRO J2058+42 X-ray Observations with RXTE

Figure 1 shows all-sky monitor (ASM) data from the entire RXTE mission through 2004 July divided into 4 equal year intervals and epoch-folded using the empheris (Wilson, Finger, & Scott, 2000). From 1996-2002, GRO J2058+42 was detectable with the ASM from about 3-5 days before until about 6-8 days after the predicted outburst peak.
In early 1998, two outbursts of GRO J2058+42 were observed with the RXTE PCA and High Energy Timing Experiment (HEXTE). Fourteen observations were obtained from 1998 January 23 - February 24 and 13 observations from 1998 March 18-30. Details including start and stop times for each observation can be found through the HEASARC333http://heasarc.gsfc.nasa.gov. These observations spanned from about 16 days until 2 days before the outburst peak. Pulsations were detected from about 6.5 days before the peak until the observations ceased with r.m.s. pulsed fluxes of 0.2-1.4 mcrab over the full 2-60 keV PCA energy range.
We analyzed energy spectra from archival RXTE data for these two outbursts to
look for spectral variations with intensity. Previous efforts
(Wilson-Hodge, 1999; Wilson, Finger, & Scott, 2000) reported only on spectral analysis of the
brightest of these observations. We analyzed archival PCA Standard2 data and
HEXTE science event mode E_8us_256_DX1F data for all 27 of the observations,
using FTOOLs444http://heasarc.gsfc.nasa.gov/ftools version 5.3
(Blackburn, 1995) to generate spectra and response files. Background spectra
for the PCA observations were generated using the “faint” source models. In
XSPEC555http://heasarc.gsfc.nasa.gov/docs/xanadu/xspec/
index.html
version 11.3.1 (Arnaud, 1996), the fits included PCA data from 2.7-25 keV and
HEXTE data from 11-50 keV. All of the observations were well fitted with an
absorbed thermal Bremsstrahlung model (phabs666Abundances are given by
Anders & Grevesse (1989) and cross-sections by Balucinska-Church & McCammon (1992) with a new He cross-section
based on Yan et al. (1998) in the phabs model, used in fits to RXTE and Chandra data. Thompson scattering is not included in the phabs model.*bremss) with reduced values
in the range 0.8-1.3 for 126 degrees of freedom. More sophisticated models, such
as a power-law with a high-energy cutoff, were not used because the
Bremsstrahlung model adequately fit the data and provided a simple measure of
spectral hardness across all source intensities. The data were better fitted
with the Bremsstrahlung model than with a power-law at higher intensities.
Estimated 2-50 keV fluxes ranged from erg cm-2 s-1 to
erg cm-2 s-1. From about 8-9 days before the predicted peak,
the flux began to increase, rising above a few erg cm-2 s-1. The
spectra were well determined for fluxes above about erg cm-2 s-1,
from about 6.5 days before the predicted peak, when pulsations were also
detected. The absorption, , appeared to be constant with best fit
values in the range cm-2. The temperature, ,
increased as the intensity increased, with best fit values from
keV at erg cm-2 s-1 to keV at erg cm-2 s-1.
Because of the 1° FWHM field-of-view of the PCA, these spectra included emission from both GRO J2058+42 and the Galactic ridge. The diffuse emission from the Galactic ridge is not well described at high Galactic longitudes (for GRO J2058+42 ). In fact, the models of Valinia & Marshall (1998) and Revnivtsev (2003) predict a Galactic ridge flux of erg cm-2 s-1 (2-10 keV), taking into account GRO J2058+42’s galactic latitude (), an order of magnitude higher than our faintest flux measurements for the GRO J2058+42 region. The column density measured with RXTE was nearly an order of magnitude larger than the Galactic value of cm-2 calculated with Colden, the Galactic Neutral Hydrogen Density Calculator777http://asc.harvard.edu/toolkit/colden.jsp, based on Dickey & Lockman (1990), suggesting there was a significant column of material intrinsic to the GRO J2058+42 system.
In preparation for our Chandra observations, RXTE observed the GRO J2058+42 region in a series of 27 observations from 2003 December 18 - 2004 January 1, spanning from 6.5 days before until 7.5 days after the predicted peak and in a second series of five very short ( ks) observations from 2004 February 15-19, from 2.5 days before until 1.5 days after the predicted peak. Pulsations were not detected in any of the 2003-2004 observations at or above the previous minimum detection of an r.m.s. pulsed flux of 0.2 mcrab in the full 2-60 keV band. Most of the observations in 2003 December were short, ks. For the eight longer observations from 2003 December, with exposure times of 6-14 ks, we fitted 2.7-15 keV PCA data in XSPEC with an absorbed thermal Bremsstrahlung model, with fixed at cm-2, the best-fit value measured with Chandra (See Section 3.1.2). Best fit temperatures ranged from 3-5 keV and 2-10 keV fluxes from erg cm-2 s-1, with no evidence of a correlation. These fluxes should be treated as upper limits for the GRO J2058+42 flux, since no pulsations were detected with RXTE and the spectra also include Galactic ridge emission.
3 X-ray Observations of
CXO J205847.51+4146373
3.1 Chandra
On 20 February, 2004, Chandra observed the field containing GRO J2058+42 for 9.9 ks with the Advanced CCD Imaging Spectrometer (ACIS) array and the High Energy Transmission Grating (HETG) in the faint, timed-exposure mode with a frame time of 3.241 seconds. The Imaging Array (ACIS-I) field-of-view was centered on , (J2000), the center of the RXTE error circle for GRO J2058+42. The ACIS-I chips were on (I0, I1, I2, I3) and chips S2 and S3 were also active. Standard processing v.7.7.1 applied aspect corrections and compensated for spacecraft dither. Level 2 events were used in our analysis. Data in the energy range 0.5-8 keV were used for all analyses to reduce background. We simultaneously processed these data using Chandra Interactive Analysis of Observations (CIAO)888http://cxc.harvard.edu/ciao version 3.1 and CALDB999See http://asc.harvard.edu/CIAO/ for more information version 2.27 and with the techniques described in Swartz et al. (2003).
3.1.1 Source Detection
| NAME | R.A. | Dec | USNOe | 2MASSe | ROSAT e | ||||
|---|---|---|---|---|---|---|---|---|---|
| J2000 | J2000 | () | () | () | () | () | |||
| I01 | 314.67230° | 41.58780° | 10.6 | 10 | 2.9 | 4.2 | |||
| CXOU J205847.5+414637 | 314.69794° | 41.77704° | 3.7 | 64 | 7.3 | 1.4 | 0.37 | 0.35 | 0.48 |
We used the same source finding techniques as described in Swartz et al. (2003) with the circular-Gaussian approximation to the point spread function, and a minimum signal-to-noise (S/N) ratio of 2.6 resulting in much less than 1 accidental detection in the field. The corresponding background-subtracted point source detection limit is 10 counts which corresponds to a flux (0.5-8.0 keV) of about erg cm-2 s-1 for an unabsorbed power-law of spectral index . Two sources were detected. Table 1 gives the source positions, the extraction radius, the net counts, the signal-to-noise ratio, and the associated uncertainty in the X-ray position. Table 1 also indicates whether or not the source is identified with a counterpart in either the United States Naval Observatory Catalog (USNO-B1.0, Monet et al., 2003), the Two Micron All Sky Survey (2MASS) and the various ROSAT catalogs and lists the angular separation between the X-ray position and the optical/infrared/ROSAT positions.
The 99% confidence positional uncertainty listed in column 7 of
Table 1 is given by where is the standard deviation of the circular
Gaussian that approximately matches the PSF at the source location, is the
aperture-corrected number of source counts for a 2.5 extraction radius,
represents the uncertainty in the image reconstruction
produced by irremovable contributions to the relative aspect solution, and
accounts for the uncertainties in the absolute aspect solution.
These latter two uncertainties are discussed in Weisskopf et al. (2003)101010See
also http://cxc.harvard.edu/cal/ASPECT/celmon/ and
http://cxc.harvard.edu/cal/ASPECT/img_recon/
report.html .
We have used 0.2″as a conservative estimate for , and
0.38″ for .
The standard CIAO tool wavdetect was also used to search for sources using an input event file binned by a factor of 4. The 2 sources found with wavdetect were consistent with the sources listed in Table 1. Both sources are outside the 90% confidence 4′ RXTE error circle for GRO J2058+42. CXOU J205847.5+414637 is just 18″ outside the error circle, while I01 is 4.5′ from the error circle.
3.1.2 X-ray Spectral Analysis
We show the X-ray “color-color” diagram in Figure 2. Since both sources were detected with only a small number of counts, the uncertainties are large and it is difficult to draw firm conclusions, although it is clear that CXOU J205847.5+414637 is very hard and most of the detected flux appears above the iridium m-edge (circa 2 keV) in the telescope response.

To extract a spectrum and associated response files for CXOU J205847.5+414637, we used a source region consisting of a 5.5″ radius circle centered on the best-fit CXOU J205847.5+414637 position. A 5.5″ circle corresponds to the radius that encloses 99.9% of the circular Gaussian that approximately matches the PSF at the source location. (See Section 3.1.1.) We extracted our spectrum from a fits file already filtered to contain only events with energies between 0.5-8 keV, with the CIAO tool psextract. The small number of photons detected did not allow us to use the statistic, so we used the Cash statistic (Cash, 1979) in XSPEC 11.3.1. Since Cash statistics cannot be used on background subtracted spectra, we did not subtract a background; however, the errors introduced from this are likely to be small because we expect about 0.7 background photons in our source extraction region. We fitted an absorbed power-law spectrum to the 64 Chandra counts. The resulting fit parameters were: cm-2 and photon index = . Using the error option on the flux command in XSPEC, we estimated that the 90% confidence range for the 2-10 keV unabsorbed flux was erg cm-2 s-1. The quality of the fit was investigated by generating 10,000 Monte Carlo simulations of the best-fit spectrum. If the model fit the data, the fit quality was %, meaning that approximately 50% of the simulations had Cash statistics lower than that of our data. For the power-law model, the fit quality was 60%. We also fitted the data with a thermal models, a blackbody (phabs*bbodyrad) and a Bremsstrahlung (phabs*bremss), but in both cases the fit quality was poorer, about 70% and 80%, respectively. For the blackbody, the emitting region was very small, with a radius of km.
3.1.3 Timing
We searched for, but did not detect, pulses from GRO J1958+42 using events extracted as discussed in Section 3.1.2. The search was conducted in the frequency range of 5.045-5.155 mHz using the test, with the number of Fourier terms, , ranging from 1 to 6. The maximum values of found were all consistent with no pulses being present. Monte-Carlo simulations were used to determine 95% confidence upper-limits to the pulse fraction of 37% rms for a simple sinusoidal pulse, and 43% rms for a pulse profile with Fourier power limited to the pulse frequency and its first harmonic. For comparison, during the outbursts detected with the RXTE PCA, the 2-10 keV pulsed fractions were 15-24% rms.
3.2 Archival ROSAT Observations
Using a PSF-fitting algorithm, we analyzed archival data from a 2.4 ks ROSAT High Resolution Imager (HRI) observation, centered on the RXTE position for GRO J2058+42, performed on June 23, 1997. Based on the outburst ephemeris of Wilson, Finger, & Scott (2000), this observation took place about 8.5 days before the predicted GRO J2058+42 outburst peak. No bright transient object was detected. A total of 5 X-ray sources were detected in the full HRI-FOV and are listed in Table 2. None of these was inside the 4′ error circle. The object nearest to the error circle was object # 2, and was 0.4′ outside the error circle. This, as well as the other 4 sources, had count rates which were below the sensitivity threshold of the ROSAT all-sky survey (RASS) done between June 1990 to January 1991 (when no source was detected). Objects #1,2, and 5 were also found with the standard ROSAT analysis and are listed in the 1RXH catalog. However, the two sources consistent with object #1 were flagged as close to the detector structure and possibly suspect. Sources #3 & 4 were not found in the catalog, consistent with the lowest significance as reported in Table 2 and below the significance threshold of the ROSAT 1RXH catalog. As an additional check, we used the CIAO tool wavdetect to search for sources in the ROSAT HRI image. Only one source was found, corresponding to source #2, with a significance of 4.1 111111The significance was found by dividing the net counts by the “Gehrels error” of the background counts, . See the Detect Manual on http://asc.harvard.edu/ciao/manuals.html for details. consistent with detecting just the brightest of the 5 sources. Unfortunately, CIAO does not offer the more sensitive PSF-fitting algorithm.
| # | R.A. | Decl. | Total Counts | Rate | Error | Catalog SourcesaaExtraction radius, defined as , where is defined in Section 3.1.1. |
|---|---|---|---|---|---|---|
| (cts s-1) | (cts s-1) | |||||
| 1 | 314.7504° | 41.8786° | 11.1 | 0.0049 | 0.0016 | 1RXH J205900.2+415242 |
| 1RXH J205900.0+415242 | ||||||
| 2 | 314.6972° | 41.7771° | 13.5 | 0.0058 | 0.0016 | 1RXH J205847.5+414637 |
| 1RXH J205847.3+414638 | ||||||
| 1RXH J205847.3+414638 | ||||||
| 1RXH J205847.5+414641 | ||||||
| 3 | 314.9085° | 41.7064° | 6.3 | 0.0027 | 0.0012 | |
| 4 | 314.7629° | 41.6315° | 4.3 | 0.0019 | 0.0010 | |
| 5 | 314.8119° | 41.6086° | 7.3 | 0.0032 | 0.0013 | 1RXH J205915.0+413631 |
Of the 5 ROSAT sources in Table 2, only CXOU J205847.5+414637 (source #2) was detected with Chandra. Source #1 fell between the ACIS-I and ACIS-S chips. Sources #3-5 were marginal ROSAT detections and unless they were very soft or transient, should have been detectable by Chandra. Hence they are likely spurious.
If the energy spectrum is assumed the same for the Chandra and ROSAT observations of CXOU J205847.5+414637, the ROSAT count rate corresponds to about 10 times brighter than that observed with Chandra, indicating that the flux varied significantly between the two observations. This is similar to GRO J2058+42 (see Figure 1) which was actively outbursting in 1997, while the outbursts faded below detectability with RXTE by the time of the Chandra observation.
4 CXOU J205847.5+414637 Optical/IR Observations and Results
4.1 Archival Searches
We used BROWSE121212see http://heasarc.gsfc.nasa.gov/db-perl/W3Browse/w3browse.pl to search for cataloged objects within the 99% confidence the X-ray error circles listed in Table 1. Counterparts were found only for CXOU J205847.5+414637 in the USNO-B1.0 and 2MASS catalogs. The angular separation between these two objects is . The 2MASS object magnitudes were:, , and . The 4′ RXTE error circle contained 605 USNO-B1.0 sources and 636 2MASS sources. The corresponding densities of sources were used to calculate the expected average number of accidental coincidences, , listed in column 5 of Table 3. The probability of getting one or more matches by chance is given by the Poisson probability, , which for small values of the exponent is approximately .
| Chandra Name | Catalog | R.A. | Dec. | aaSources within errors from “The First ROSAT Catalog of Pointed Observations with the High Resolution Imager (ROSATHRITOTAL / 1RXH)” available through http://heasarc.gsfc.nasa.gov and http://www.xray.mpe.mpg.de/cgi-bin/rosat/src-browser. |
|---|---|---|---|---|
| (J2000) | (J2000) | |||
| I01 | USNO | 0.19 | ||
| 2MASS | 0.20 | |||
| CXOU J205847.5+414637 | USNO | 314.698078° | 41.777028° | 0.021 |
| 2MASS | 314.698057° | 41.777000° | 0.022 | |
| bbApproximate number of source counts. | 314.6979° | 41.7769° | 0.001 |
4.2 Optical Photometric Observations
The field around the best-fit RXTE position for GRO J2058+42 was observed through the , , , and filters and a narrow filter centered at 6563 Å (H filter) using the 1.3 m telescope of the Skinakas observatory on several occasions throughout summer 2003 and 2004 (see Table 4). The telescope was equipped with a SITe CCD chip with a 24 m pixel size (corresponding to on the sky). The telescope was pointed at the RXTE position R.A = , Decl. = and the field of view was . Standard stars from the Landolt (1992) and Oja (1996) lists were used for the transformation equations. Reduction of the data was carried out in the standard way using the IRAF tools for aperture photometry. The results of the photometric analysis are given in Table 4.
| Date | MJD | B | V | R | I |
|---|---|---|---|---|---|
| 2003 June 7 | 52798.50 | 16.010.03 | 14.910.03 | 14.220.03 | |
| 2003 June 8 | 52799.44 | 16.070.03 | 14.940.02 | 14.240.02 | |
| 2003 August 24 | 52876.37 | 16.030.02 | 14.900.03 | 14.250.03 | 13.490.03 |
| 2004 July 5 | 53192.46 | 16.030.02 | 14.880.02 | 14.160.02 | 13.350.02 |
| 2004 July 27 | 53214.51 | 16.070.02 | 14.920.03 | 14.190.03 | 13.410.04 |
| 2004 August 24 | 53242.43 | 16.050.02 | 14.950.02 | 14.240.02 | 13.460.02 |
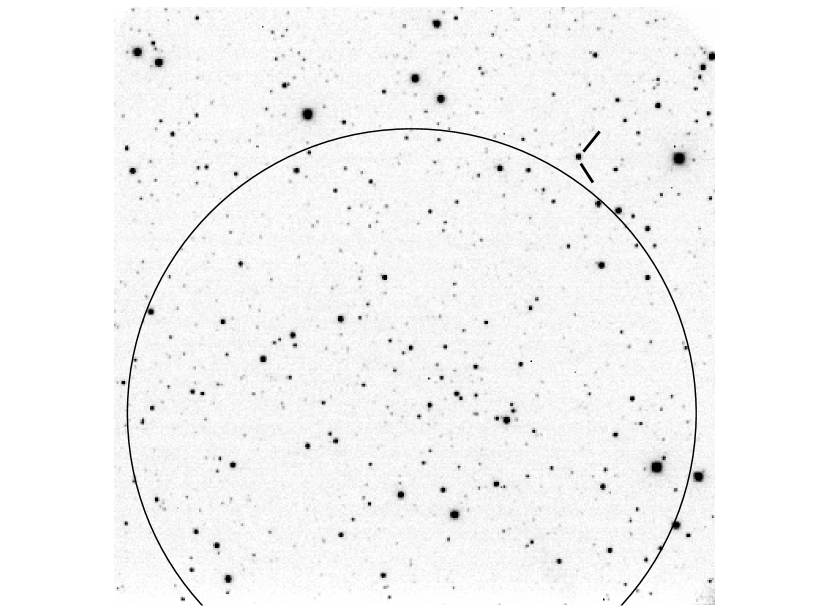
Figure 3 shows a Johnson -band image of the field around GRO J2058+42 obtained from the Skinakas 1.3-m telescope on 2003 June 8. The RXTE error circle and the optical counterpart to CXOU J205847.5+414637 have been marked. The second Chandra source, I01 in Table 1, and the lower portion of the RXTE error circle were outside the field of view.
An optical color-color diagram was generated with the instrumental magnitudes of the , , , and H filters obtained during the 2003 June 8 and 2004 July 5 observations by plotting the “red color” as a function of the “blue color” (See Figure 4). Be stars showing emission in H are expected to occupy the upper left region of the diagram. Be stars are expected to show low (blue-dominated) colors because they are early-type stars (although they normally appear redder than non-emitting B stars due to the circumstellar disk) and also bright (less-negative) colors because they are relatively strong H emitters.
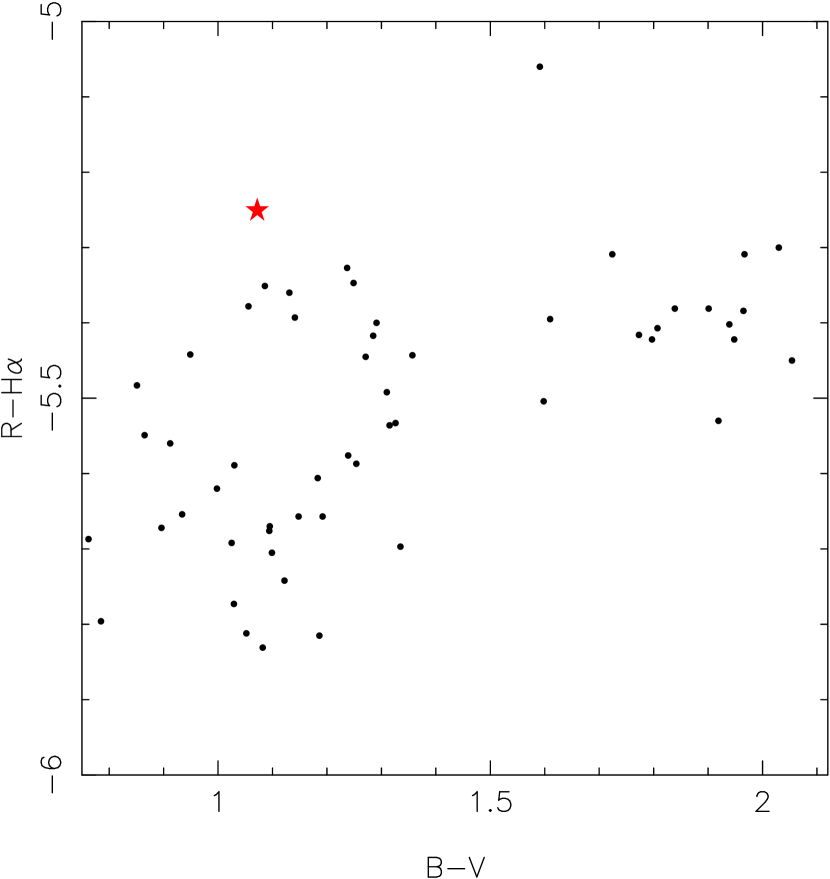
The color-color diagram taken alone provides two potential candidates to be the optical counterpart associated with GRO J2058+52. The two stars lie outside the 90% RXTE error circle, but while the data point marked with a star-like symbol (, , J2000) is 18″ outside the error circle and corresponds to the X-ray source CXOU J205847.5+414637 detected with Chandra, the other candidate (the one showing the largest color values and located at , , J2000) is about 1.2′ away from the error circle and was not detected with Chandra or ROSAT. Also, the optical spectrum of the other candidate does not resemble that of an early-type star.
4.3 Optical Spectroscopic Observations
Optical spectroscopic observations of the CXOU J205847.5+414637 counterpart were obtained from the Skinakas observatory in Crete (Greece) on 2004 June 25, July 6, and August 26, and from the William Herschel Telescope (WHT) located at the Roque de Los Muchachos observatory in La Palma (Spain) on 2004 July 4. The 1.3 m telescope of the Skinakas Observatory was equipped with a 10241024 Thomson CCD and a 1302 l mm-1 grating, giving a nominal dispersion of 1.3 Å/pixel. The WHT instrumental set-up during the service run utilized the ISIS double-arm spectrograph. The blue arm used the R1200B grating with wavelength coverage 3890 - 4440 Å, while the red arm used the R1200R grating with a wavelength coverage of 6180 - 6920 Å. The spectra were reduced using the STARLINK Figaro package (Shortridge et al., 2001) and analyzed using the STARLINK Dipso package (Howarth et al., 1998).
These spectroscopic observations revealed H emission with split profiles. Equivalent widths (EW) for the H profiles are listed in Table 5. In the red band WHT spectrum, top panel in Figure 5, the He 6678 Å line also shows a double-peaked profile. The split profiles provide further evidence for a Be star, since the double-peaked shape can be interpreted as coming from the circumstellar envelope. The blue band spectrum, lower panel in Figure 5 showed various other members of the Balmer series in absorption.
| Date | MJD | Equivalent Width (Å) |
|---|---|---|
| 2004 June 25 | 53181 | |
| 2004 July 04 | 53190 | aaThe average number of accidental coincidences expected in the 99% confidence Chandra error circle. |
| 2004 July 06 | 53192 | |
| 2004 August 26 | 53244 |

The blue band spectrum lacks, however, strong He I lines, such as 4009, 4144, and 4387 Å. Only He I 4026 and 4121 Å (this one was rather weak) are present. The strength of He I lines reaches a maximum for spectral type B2 and falls off on either side (i.e., B1, B3, etc). Thus, we are likely dealing with a very early B or late O star. The Si IV 4089 Å line is quite prominent. In fact, the ratio Si IV 4089 Å/He I 4121 Å 1. This could be explained assuming an earlier spectral type (earlier than O9) or else with a more evolved companion. The first possibility is ruled out by the lack of He II (for example, He II 4200 Å). The lack of information above 4400 Å makes it difficult to perform a good spectral classification, but the data suggest a classification of O9.5-B0IV-V
5 Discussion
5.1 Distance Estimate from Optical/IR data
In order to estimate the distance it is important to make a good estimate of the amount of absorption to the source.
The interstellar absorption to the source can be estimated from the strength of the diffuse interstellar bands (DIB, Herbig, 1975). The measurement of the equivalent widths of the DIB is, however, hampered by the low signal-to-noise ratio of the optical continuum. Using the strongest lines (those at 6202 Å and 6613 Å), the estimated color excess is , but the number of measurements is only 3. If we add the 5778/80, 6195 and 6269 Å lines then the average value of the reddening is , where the error is the standard deviation of 7 measurements. The main uncertainty in the derivation of the equivalent widths comes from the difficulty in defining the continuum.
This color excess is consistent with that estimated from the photometric data. A B0V star has an intrinsic color (Wegner, 1994) and taking the measured photometric color we derive an excess . The slightly higher reddening obtained from the photometric magnitudes may be explained by the contribution of the circumstellar disk around the Be star. In contrast, the interstellar lines should be free of such effects.
Using the H EW 4.5 Å the expected IR colors may be estimated for a Be star plus circumstellar disk. Using Figure 8 from Coe et al. (1994) the intrinsic is shown to be in the range . This gives and a corresponding . Though slightly higher than the value of determined from the more precise photometry, the agreement is sufficiently good to confirm that both the optical and IR data are likely to be from the same object.
Taking into account the above three estimates of the reddening we determine the weighted mean value to be .
Figure 6 shows the photometric values (optical and infrared) de-reddened by E(B-V)=1.4. Superimposed on the these values is a stellar atmosphere for a B0 star (K and ) (Kurucz, 1979). The model has been normalized to the B band data since it is assumed that this band will not be significantly affected by any contribution from the circumstellar disk. It is clear from this figure that the IR fluxes lie significantly above the model fit, indicating a strong IR excess. This is to be expected from a Be star, though the strength of the excess in this case is large - perhaps partially because the data were not taken contemporaneously. Nonetheless, the general quality of fit to the optical fluxes is further confirmation that our estimate for the reddening is reasonably good.

Taking the standard law Rieke & Lebofsky (1985) and assuming an average absolute magnitude of (Vacca, Garmany, & Shull, 1996) the distance to GRO J2058+42 is estimated to be kpc. The error was obtained by propagating the errors in , and . Note that the error in the absolute magnitude accounts for the uncertainty in the spectral type of the optical companion (O9.5-B0.5).
The distance estimate from the optical/IR counterpart to CXOU J205847.5+414637 is consistent with X-ray distance estimate for GRO J2058+42 of 7-16 kpc (Wilson et al., 1998), based on measurements of spin-up and flux in the giant outburst in 1995.
5.2 Comparison with Other Quiescent Be/X-ray Binaries
From our Chandra observations, CXOU J205847.5+414637’s energy spectrum was approximately fitted with a power-law with a photon index and an unabsorbed flux erg cm-2 s-1, or erg s-1 for a distance of 9 kpc. Campana et al. (2002) measured power-law indices of 2.1 and 2.6 and unabsorbed and erg s-1 for A0538–66 and 4U 0115+63, respectively, with BeppoSAX. No pulsations were detected for either source, with a upper limit of 30% for 4U 0115+63. Chandra detected 22 photons from V0332+53 in quiescence corresponding to erg cm-2 s-1(Campana et al., 2002). No optical observations were reported for these objects, so the state of the Be disk was unknown. Quiescent observations of A0535+26 with BeppoSAX (Orlandini et al., 2004) and RXTE (Negueruela et al., 2000) are most intriguing. In 1998, A0535+26 was detected at erg s-1 with RXTE, with a power-law index of . Pulsations were detected during this observation with a pulse fraction of %. Optical observations of V725 Tau, the counterpart to A0535+26, showed H in absorption from the underlying star, indicating that the circumstellar disk was gone (Negueruela et al., 2000). BeppoSAX observations in 2000-2001 also revealed pulsations with a % fraction, a power-law index of and an unabsorbed erg s-1. However optical observations indicated that H emission, i.e., the circumstellar disk, had returned. CXOU J205847.5+414637’s luminosity and spectral shape are similar to that observed from A0535+26, especially in the BeppoSAX observations where the Be disk had returned. If CXOU J205847.5+414637 and GRO J2058+42 are the same object, it is also a long-period pulsar similar to A0535+26.
The RXTE ASM light curve showed that regular outbursts of GRO J2058+42 continued from its discovery in 1995 until at least mid-2002. This long period of activity from 1995-2002 was similar to EXO 2030+375 (Wilson et al., 2002). For EXO 2030+375, the extended activity was believed to be the result of the Be disk being truncated at a particular resonance radius (4:1), so that an outburst was expected at every periastron passage unless the Be disk disappeared (Okazaki & Negueruela, 2001). After mid-2002, GRO J2058+42’s outbursts faded below detectability in the RXTE ASM. If CXOU J205847.5+414637 and GRO J2058+42 are the same object, our optical observations show that although GRO J2058+42’s outbursts appeared to have ceased by 2004, detection of H emission indicated that the Be disk was still present. Hence GRO J2058+42’s behavior, while similar to EXO 2030+375’s during outbursts, does not fit the EXO 2030+375 model predictions for outburst cessation. EXO 2030+375’s outbursts have not ceased to date, so it is not clear whether or not EXO 2030+375 will fit the model either.
6 Conclusions
Clearly we have discovered a Be/X-ray binary CXOU J205847.5+414637. Different estimates of the number of Be stars in the Galaxy give radically different numbers, but all give a low chance probability of finding a serendipitous Be star in our Chandra error circle. Based on evolutionary arguments, Meurs & van den Heuvel (1989) predict 2000-20,000 Be/X-ray binaries in the galaxy. Porter & Rivinius (2003) state that about 1/3 of known Be stars are in binaries. About 2/3 of these binaries are Be/X-ray binaries, i.e., they contain a neutron star. This leads to roughly 10,000-100,000 Be stars in the Galaxy. If we assume an angular size of for the Galactic plane, that implies 0.004-0.004 Be stars per arcmin2. Hence, the chance probability of finding an unrelated Be star in our Chandra 99% confidence error circle is 0.00007-0.0007%. Alternatively, the mass of the Galaxy is (Zombeck, 1990), meaning about stars in the Galaxy. About 1 star in 800 is a B star (Binney & Merrifield, 1998) and about 17% of B stars are Be stars (Zorec & Briot, 1997). This gives us a much larger number of Be stars in the Galaxy, about , leading to about 0.8 Be stars per arcmin2 and a chance probability of 0.1% of finding an unrelated Be star in our Chandra error circle. Neither argument takes into account the fact that not all Be stars show H emission at a given time and some percentage of them will not be observable due to absorption effects, so the actual probability is even lower. In addition, Be stars in Be/X-ray binaries cover a very narrow range in spectral type (09-B2, Negueruela, 1998) and the spectral type of CXOU J205847.5+414637’s companion is in that range.
Based on evolutionary arguments (Meurs & van den Heuvel, 1989), we should expect to find 0.004-0.04 Be/X-ray binaries in the RXTE error circle for GRO J2058+42 and 0.02-0.2 in the ACIS-I field. However, based on our alternative argument, we would expect to find about 8 Be/X-ray binaries in the RXTE error circle and about 44 in the ACIS-I field. Both estimates assume that all Be/X-ray binaries in the galaxy are detectable. To our knowledge to date no previously unknown quiescent Be/X-ray binaries have been discovered in X-rays, suggesting that either they are less common than predicted or are too faint to observe. Our observations and observations of other Chandra fields (e.g., Rogel et al., 2004), suggest that the alternative argument overestimates the number of Be stars. Unfortunately little is known about quiescent Be/X-ray binaries.
Because pulsations were not detected with our Chandra observation, we cannot definitively say that CXOU J205847.5+414637 is GRO J2058+42. However, beyond the positional coincidence, other evidence is suggestive that they are the same source. CXOU J205847.5+414637 was the brightest object observed with ROSAT in 1997, when GRO J2058+42 was active, and it was roughly 10 times brighter than in the Chandra observations. Similarly, RXTE PCA observations showed that GRO J2058+42 was a factor of about 10-100 brighter in outburst in 1998 than upper limits in 2003 December. The ROSAT observations approximately corresponded in orbital phase to the faintest RXTE detections. Longer-term observations with the ASM also showed that GRO J2058+42 had faded. Further, GRO J2058+42 shows classic Be/X-ray binary behavior and CXOU J205847.5+414637 is associated with a Be star. Lastly, the 7-16 kpc distance to GRO J2058+42 is in agreement with the distance of 7.7-10.3 kpc estimated for the optical counterpart to CXOU J205847.5+414637. Additional observations of CXOU J205847.5+414637 are needed to be certain if it is a new quiescent Be/X-ray binary or if it is GRO J2058+42.
References
- Apparao (1994) Apparao, K. M. V. 1994, Space Sci. Rev., 69, 255
- Anders & Grevesse (1989) Anders, E. & Grevesse, N. 1989, Geochimica et Cosmochimica Acta 53, 197
- Arnaud (1996) Arnaud, K. A. 1996, in ASP Conf. Ser. 101, Astronomical Data Analysis Software and Systems V, ed. G. Jacoby & J. Barnes (San Francisco: ASP), 17
- Balucinska-Church & McCammon (1992) Balucinska-Church, M. & McCammon, D. 1992, ApJ, 400, 699
- Bildsten et al. (1997) Bildsten, L., et al. 1997, ApJS, 113, 367
- Binney & Merrifield (1998) Binney, J. & Merrifield, M. 1998, Galactic Astronomy (Princeton:Princeton Univ. Press)
- Blackburn (1995) Blackburn, J.K. 1995, in ASP Conf. Ser., Vol. 77, Astronomical Data Analysis and Software Systems IV, eds. R.A. Shaw, H.E. Payne, & J.J.E. Hayes (San Francisco:ASP), 367
- Campana et al. (2002) Campana, S. et al. 2002, ApJ, 580, 389
- Cash (1979) Cash, W. 1979, ApJ, 228, 939
- Castro-Tirado & Birkle (1996) Castro-Tirado, A.J. & Birkle, K. 1996, IAU Circ., 6516
- Coe (2000) Coe, M. J., 2000, in IAU Colloq 175, The Be phenomenon in Early-Type Stars, ed. M.A. Smith & H.F. Henrichs (ASP Conf. Ser. 214; San Francisco: ASP), 656
- Coe et al. (1994) Coe, M.J. et al. 1994, A&A, 298, 784
- Dickey & Lockman (1990) Dickey, J.M. & Lockman, F.J. 1990, ARA&A, 28, 215
- Ghosh & Lamb (1979) Ghosh, P. & Lamb, F.K. 1979, ApJ, 234, 296
- Grove (1995) Grove, J.E. 1995, IAU Circ., 6239
- Hanuschik (1996) Hanuschik, R. W. 1996, A&A, 308, 170
- Henrichs (1983) Henrichs, H.F. 1983, in Accretion Driven Stellar X-ray Sources, eds. W.H.G. Lewin & E.P.J. van den Heuvel, (New York: Cambridge University Press), 393
- Herbig (1975) Herbig, G.H., 1975, ApJ, 196, 129
- Howarth et al. (1998) Howarth, I. D., Murray, J., Mills, D., & Berry, D. S. 1998, Starlink User Note 50.21
- Kurucz (1979) Kurucz, R.L., 1979, ApJS, 40, 1
- Landolt (1992) Landolt, A. U., 1992, AJ, 104, 340
- Monet et al. (2003) Monet, D.G., Levine, S.E., Casian, B., et al. 2003, AJ, 125, 984
- Meurs & van den Heuvel (1989) Meurs, E.J.A. & van den Heuvel, E.P.J. 1989, A&A, 226, 88
- Negueruela (1998) Negueruela, I. 1998, A&A, 338, 505
- Negueruela & Okazaki (2001) Negueruela, I., & Okazaki, A. T. 2001, A&A, 369, 108
- Negueruela et al. (2001) Negueruela, I., et al. 2001, A&A, 369, 117
- Negueruela et al. (2000) Negueruela, I., Reig, P., Finger, M.H., Roche, P. 2000, A&A, 356, 1003
- Oja (1996) Oja, T., 1996, BaltA, 5, 103
- Okazaki & Negueruela (2001) Okazaki, A.T. & Negueruela, I. 2001, A&A, 377, 161
- Orlandini et al. (2004) Orlandini, M. et al. 2004, Nuclear Physics B (Proc. Suppl.), 132, 476
- Ostriker & Shu (1995) Ostriker, E.C. & Shu, F.H. 1995, ApJ, 447, 813
- Porter (1996) Porter, J. M., 1996, MNRAS280, L31
- Porter & Rivinius (2003) Porter, J.M. & Rivinius, T. 2003, PASP, 115, 1153
- Quirrenbach et al. (1997) Quirrenbach, A, et al. 1997, ApJ, 479, 477
- Reig, Kougentakis, & Papamastorakis (2004) Reig, P., Kougentakis, T. & Papamastorakis, G. 2004, ATel 308
- Revnivtsev (2003) Revnivtsev, M. 2003, A&A, 410, 865
- Rieke & Lebofsky (1985) Rieke, G.H. & Lebofsky, M.J. 1985, ApJ, 288, 618
- Rogel et al. (2004) Rogel, A.B. et al. 2004, astro-ph/0410036
- Shortridge et al. (2001) Shortridge, K., Meyerdierks, H., Currie, M., et al. 2001, Starlink User Note 86.19
- Slettebak (1988) Slettebak, A. 1988, PASP, 100, 770
- Stella et al. (1986) Stella, L. et al. 1986, ApJ, 308, 669
- Swartz et al. (2003) Swartz, D. A., Ghosh, K.K., McCollough, M.L., Pannuti, T.G., Tennant, A.F. & Wu, K. 2003, ApJS, 144, 213
- Townsend, Owocki, & Howarth (2004) Townsend, R. H. D., Owocki, S. P., Howarth, I. D., 2004, MNRAS, 350,189
- Vacca, Garmany, & Shull (1996) Vacca, W. D., Garmany, C. D., & Shull, J. M., 1996, ApJ, 460, 914
- Valinia & Marshall (1998) Valinia, A. & Marshall, F.E. 1998, ApJ, 505, 134
- Wasserman & Shapiro (1983) Wasserman, I. & Shapiro, S.L. 1983, ApJ, 265, 1036
- Wegner (1994) Wegner, W., 1994, MNRAS, 270, 229
- Weisskopf et al. (2003) Weisskopf, M.C. et al. 2003, Experimental Astronomy, 16, 1
- Wilson et al. (1995) Wilson, C.A. et al. 1995, IAU Circ., 6238
- Wilson et al. (2002) Wilson, C.A. et al. 2002, ApJ, 570, 287
- Wilson et al. (1998) Wilson, C.A., Finger, M.H., Harmon, B.A., Chakrabarty, D., Strohmayer, T. 1998, ApJ, 499, 820
- Wilson, Finger, & Scott (2000) Wilson, C.A., Finger, M.H., & Scott, D.M. 2000, in AIP Conf. Proc. 510, The Fifth Compton Symposium, ed. M. L. McConnell & J. M. Ryan (Melville: AIP), 208
- Wilson, Strohmayer, & Chakrabarty (1996) Wilson, C.A., Strohmayer, T., & Chakrabarty, D. 1995, IAU Circ., 6514
- Wilson-Hodge (1999) Wilson-Hodge, C.A. 1999, PhD Dissertation, University of Alabama in Huntsville
- Yan et al. (1998) Yan, M., Sadeghpour, H.R., Dalgarno, A. 1998, ApJ, 496, 1044
- Zombeck (1990) Zombeck, M.V. 1990, Handbook of Space Astronomy & Astrophysics (New York: Cambridge University Press), 82
- Zorec & Briot (1997) Zorec, J. & Briot, D. 1997, A&A, 318, 443