EVN Observations of the BL Lac object ON 231 ††thanks: Also known as B1219+285
Abstract
New EVN images at 5.0 GHz and 8.4 GHz of ON 231 confirm the complex structure of the source, the identification of the core, the presence of components on the two sides of the core itself and a low brightness extension South-East of the main jet. The optical behaviour of the source is discussed in connection to changes in the radio structure.
1 Introduction
BL Lacertae objects are characterized by large variations of their radiation over a wide range of time scales from minutes to years. The fast variability and the high apparent luminosity of these sources is explained by Doppler boosting in a relativistic jet (Blandford and Rees 1978). When historic light curves are available, it is found that variations can also occur over time scales of several decades. One can expect, therefore, that the occurence of the largest and longest flares are associated with changes in the structure of the inner jet. To verify such a hypothesis we started a VLBI observation program of the bright BL Lac object ON 231 (B1219+285; =0.102) whose historic optical light curve was characterized by a long term brightening trend up to Spring 1998, when it reachead a very high luminosity, followed by a dimming phase (Massaro et al. 1999, Tosti et al. 2002). Massaro et al. (2001) presented VLBI images of ON 231 obtained with the European VLBI Network (EVN) in February 1997 and June 1998, during the most recent active period. The source core was identified with the brigthest component because of its flat spectrum. According to this interpretation a new component, emerging from the core in the direction opposite to that of the main jet, was detected. In this contribution we present new images at 5.0 GHz and 8.4 GHz of ON 231. The new images confirm the unusual structure previously found and possibly confirm the identification of the source core.
2 Observations and Results
The new VLBI images of ON 231 were obtained during two observing sessions scheduled by the European VLBI Network 111The European VLBI Network is a joint facility of European, Chinese, South African and other radio astronomy institutes funded by their national research councils. on 04 June 2001 at 5.0 GHz and on 02 March 2002 at 8.4 GHz. During the 8.4 GHz session the geodetic stations of Matera and Wettzell joined the network. The raw data outputs from the correlators were calibrated in amplitude and phase using AIPS and imaged using DIFMAP (Shepherd et al. 1995).

Table 1 - Modelfitting of the 5.0 GHz and 8.4 GHz images
| Comp. | Flux | R | PA | Axial | ||
|---|---|---|---|---|---|---|
| (mJy) | (mas) | (deg) | (mas) | ratio | (deg) | |
| 2001 | June | (5 GHz) | ||||
| C0 | 210.6 | 0.0 | 0.0 | 2.6 | 0.41 | 8.4 |
| C1 | 88.6 | 2.1 | 99.3 | 2.6 | 0.40 | 15.1 |
| C2 | 48.7 | 5.2 | 112.2 | 2.8 | 0.52 | 31.6 |
| C3 | 32.8 | 8.5 | 112.0 | 2.1 | 0.44 | 23.8 |
| C4 | 5.2 | 13.1 | 115.8 | 2.5 | 0.40 | 15.0 |
| C5 | 78.7 | 16.6 | 138.1 | 10.0 | 0.34 | 21.5 |
| W1 | 142.2 | 1.7 | 74.7 | 1.5 | 0.52 | 15.3 |
| W2 | 29.1 | 2.4 | 65.2 | 1.2 | 0.50 | 15.7 |
| W3 | 20.1 | 4.0 | 65.2 | 1.6 | 0.50 | 15.7 |
| 2002 | March | (8.4 GHz) | ||||
| C0 | 268.2 | 0.0 | 0.0 | 1.5 | 0.40 | 5.2 |
| C1 | 136.7 | 2.7 | 104.4 | 1.5 | 0.40 | 5.0 |
| C2 | 51.3 | 7.5 | 111.0 | 2.5 | 0.40 | 5.0 |
| C3 | 5.3 | 11.3 | 113.0 | 2.0 | 1.0 | 0.0 |
| C4 | 41.7 | 15.1 | 137.7 | 6.0 | 0.40 | 23.0 |
| W1 | 53.8 | 1.1 | 65.5 | 1.5 | 0.50 | 5.4 |
| W2 | 30.1 | 3.0 | 67.0 | 1.5 | 0.50 | 5.4 |
: components C are ordered from West to East, components W from East to West.
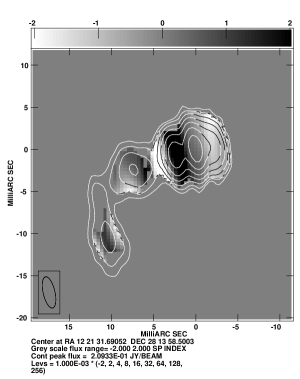
The new images show a source structure very similar to that described by Massaro et al. (2001): a jet elongating in the SE direction and bending toward South. The bright segment of the jet has a complex structure in which at least three components can easily be recognized with the brightest one in the middle (Fig. 1). The main problem is the firm identification of the source core. We therefore fitted the jet structure of ON 231 with gaussian components. For both epochs the modelling was limited to the brighter portion of the jet before the bending. Both results were well acceptable although a fraction of the diffuse emission along the jet could not be accounted for. The results of the modelfitting are presented in Table 1. The brightest component is indicated by C0, those on the East side by C1, C2, … while those on the West side by W1, W2, … From the data in Table 1 we can estimate the spectral indices of C0, C1 and of the entire West jet section. We prefer to consider the total flux density from this section instead of those of the individual W components. The resulting spectral indices () are , , while the West component has the very steep . Fig. 2 shows the spectral index map obtained after the convolution of the 8.4 GHz image with the beam size achieved at 5.0 GHz. The slightly inverted spectrum of C0 is evident and confirms what measured in previous observations suggesting it is the core. C1 also shows an inverted spectrum while previously showed a steep spectrum. We suggest that, since the 8.4 GHz observations were done almost two years later than those at 5.0 GH, we are not comparing the flux densities from the same components (see Tab. 1).
3 Discussion
Parsec-scale jets of BL Lac objects are generally one-sided. The jet structures frequently show wiggles, suggesting a strong interaction of the jet with the surrounding medium or motion like precession. With the aim to correlate optical and radio behaviour for ON 231, the possible scenarios for interpreting both the time evolution in the optical luminosity and the changes in the parsec scale structure are:
the jet points very close to the observer direction, and undergoes strong instabilities and oscillations. The new western component detected in ON 231 may be therefore the result of one episodic large amplitude displacement, i.e. knots can be ejected from the nucleus along directions that are distributed around a mean position angle, so that one of these knots is displaced West of the core.
a slowly precessing jet, which approached the observer line of sight during the past few decades. The progressive decreasing of the angle would result in an increase in the beaming factor, and it could be responsible for the long brightnening trend detected in the optical. The minimum angular distance was likely reached in 1997-98, when ON 231 was observed at its maximum brightness. This view is supported by a time scale analysis of the optical variations, which reveals more rapid variability around that period (Tosti et al. 2002). The jet direction changed to the opposite side of the core after this phase, as it appears in the EVN images. The long, twisting extension of the jet after the bend at 12 mas is certainly not a young region of emission. In the scenario of a precessing jet, it could be the trace of the jet itself, rotating clockwise from south to north.
Acknowledgements.
This research was supported by the European Commission’s TMR Programme “Access to Large-scale Facilities”, under contract No. ERBFMGECT950012. We acknowledge the support of the European Community - Access to Research Infrastructure action of the Improving Human Potential Programme.References
- [1978] Blandford R.D., Rees M.J. 1978, Physica Scripta 17, 265 ApJS 131, 95
- [1999] Massaro E., Maesano M. et al. 1999, A&A 342, L59
- [2001] Massaro E., Mantovani F. et al. 2001, A&A 374, 435
- [1995] Shepherd M.C., Pearson T.J. Taylor G.B. 1995, BAAS 26, 987
- [2002] Tosti G., Massaro E., Nesci R. et al. 2002, A&A 395, 11