Discovery of a Large Scale Clumpy Structure around the Lynx Supercluster at ††thanks: Based on data collected at Subaru Telescope, which is operated by the National Astronomical Observatory of Japan.
Abstract
We report the discovery of a probable large scale structure composed of many galaxy clumps around the known twin clusters at and in the Lynx region. Our analysis is based on deep, panoramic, and multi-colour imaging (26.4′24.1′) in -bands with the Suprime-Cam on the 8.2 m Subaru telescope. This unique, deep and wide-field imaging data-set allows us for the first time to map out the galaxy distribution in the highest redshift supercluster known. We apply a photometric redshift technique to extract plausible cluster members at down to =26.15 (5) corresponding to at this redshift. From the 2-D distribution of these photometrically selected galaxies, we newly identify seven candidates of galaxy groups or clusters where the surface density of red galaxies is significantly high (5), in addition to the two known clusters. These candidates show clear red colour-magnitude sequences consistent with a passive evolution model, which suggests the existence of additional high density regions around the Lynx superclusters.
keywords:
galaxies: clusters: individual (RXJ 0848.6+4453, RXJ 0848.9+4452) — galaxies: evolution — galaxies: formation — cosmology: large-scale structure of Universe1 Introduction
Superclusters are the largest systems of galaxies, composed of multiple clusters of galaxies, extending over 10-20 Mpc (e.g., Bahcall, Soneira 1984; Postman, Geller, Huchra 1988; Quintana et al. 1995; Small et al. 1998). According to the N-body simulations which successfully reproduce the observed filamentary structures at the local Universe (e.g., Peacock et al. 2001), clusters of galaxies at are still in the process of formation (e.g., Moore et al. 1998). Therefore, clusters of galaxies at this cosmological distance, especially superclusters, are important sites where we can directly see the process of structure formation and evolution and mass assembly to cluster cores.
Despite the importance in the cosmological context, however, only a few superclusters with the scale of 10 Mpc have been identified so far at high redshifts, especially beyond (Connolly et al. 1996; Lubin et al. 2000; Tanaka et al. 2001). The limitation comes largely from the small field of view of large telescopes.
The advent of the Suprime-Cam (Miyazaki et al. 2002), a huge format optical camera with a 30′ field of view on the prime focus of the 8.2m Subaru telescope, has made it possible for us to view a 10 Mpc region all at once at high redshifts. Kodama et al. (2001) have taken this unique advantage of the Suprime-Cam on Subaru to map out the large scale structure around the A851 cluster at . They have found many filamentary structures and subclumps spreading over 5 Mpc from the dense cluster core, on the basis of photometric redshift (photo-z) analysis, an approach similar to that taken in this Letter.
By utilizing the great light-collection power of the Subaru telescope, we now target the most distant supercluster ever firmly identified with spectroscopy: ie., the Lynx supercluster region at composed of two known clusters, RXJ 0848.9+4452 at and RXJ 0848.6+4453 at , which are spectroscopically confirmed X-ray emitting clusters firstly reported by Rosati et al. (1999) and Stanford et al. (1997). The bolometric X-ray luminosities of RXJ 0848.9 and RXJ 0848.6 are ergs s-1 and ergs s-1, respectively, which are derived with the Chandra observation (Stanford et al. 2001).
Throughout this paper, we use the AB magnitude system (Oke, Gunn 1983). The adopted cosmological parameters are and , which gives a physical scale of 8.37 kpc arcsec-1 at the cluster redshift.
2 Observations, Reduction, and Analysis
2.1 Observations and Reduction
| Band | Date | Total Exp. | lim. mag | Seeing |
|---|---|---|---|---|
| () | ||||
| 2000 Nov. 27 | 96 min | 26.78 | ′′9 | |
| 2000 Nov. 24 | 90 min | 26.63 | ′′9 | |
| 2000 Nov. 25 | 30 min | 26.15 | ′′8 | |
| 2001 Mar. 21 | 30 min | ′′8 | ||
| 2001 Mar. 22 | 54 min | 24.88 | ′′0 |
The Lynx field was observed in November 2000–March 2001 in the , , , and bands with the Suprime-Cam. Only eight of the ten CCDs of the Suprime-Cam were ready at the time of these observations. Consequently, each image has an FOV of with a resolution of 0.′′2 per pixel. The log of the observations is given in Table 1.
The images are processed in a standard manner with iraf and purpose-written software developed by us (Yagi et al. 2002). Flux calibration is performed with photometric standard stars from Landolt (1992) for - and -band, and spectrophotometric standard stars (Oke 1990; Bohlin, Colina, Finley 1995; Bohlin 1996) for - and -band. We register the and images with the image, and match their PSFs to a fixed value, (FWHM). Taking an overlapped region for all the images in the four bands, the final area used in our analysis is restricted in a region, which corresponds to Mpc2 at . The regions at the edges of the combined image and regions around bright stars were masked and not used in the analysis.
Since the -band image is the deepest among the four bands with respect to the passively evolving galaxies at the cluster redshift ((5)=26.15 mag or at ), we constructed an -band selected sample using SExtractor v.2.2.0 (Bertin, Arnouts 1996). An area with more than 5 connected pixels with counts over 2.8 is identified as an object. Photometry was then performed with a relatively small diameter aperture of 2′′ (16.7 kpc) to keep the signal-to-noise ratios high enough for photo-z use. Galactic extinction is small, (Schlegel, Finkbeiner, Davis 1998), and hence neglected. After excluding 411 stellar-like objects, a total of 35143 objects, whose magnitudes are brighter than (5) in the arcmin2 area, are contained in the final catalog.
2.2 Foreground/Background Subtraction by Photometric Redshifts
Our aim is to map out structures associated with the known twin clusters at . It is therefore required to remove unassociated galaxies in the foreground and background as much as possible, to maximize the contrast of the structures on the projected sky.
Since spectroscopic measurements for the galaxies are not practical, we exploit photo-z technique as an observationally efficient method to largely subtract the foreground/background populations. We input the magnitudes to the HYPERZ code (Bolzonella, Miralles, Pelló 2000) to get estimated redshifts for all the individual galaxies in our -band selected sample. This code uses Bruzual & Charlot’s (1993) stellar evolutionary code (GISSEL98) to build synthetic templates of galaxies for eight star formation histories: an instantaneous burst, a constant star-forming system, and six exponentially decaying SFRs with time-scales of from 1 to 30 Gyr. These models assume solar metallicity and the Miller-Scalo IMF (Miller, Scalo 1979), and internal reddening is considered using the Calzetti et al. (2000) model with varying between 0 and 1.2 mag.
It is ideal to have near-infrared magnitudes as well as optical magnitudes to get better estimates for photo-z’s for galaxies beyond redshift of unity, since the prominent spectral break feature at 4000Å for old galaxies starts to range out from the optical passbands at (Kodama, Bell, Bower 1999; Connolly et al. 1997). However, very limited FOVs of current near-infrared imagers on large aperture telescopes (eg., in the case of Subaru) make it impractical to do near-infrared imaging of such a huge area of our Suprime-Cam field (). Nevertheless, by obtaining -band magnitudes at the longest optical wavelength, whose effective wavelength is about 9200Å, we can still deal with the galaxies out to for photo-z estimates. Our target supercluster is supposed to be located at , hence the -band can still just catch the 4000Å break features. In other words, this target is one of the most distant structures that can be explored by photo-z’s based on the optical imagings alone hence with this huge field of view, except for the rest-UV-selected Lyman break galaxies at exotically high redshifts such as (eg., Steidel et al. 1999).
By using the best estimate of photo-z of individual galaxies, we select the only galaxies within the range of to isolate the plausible members associated to the supercluster at . The number of these photometrically selected candidates for cluster members (hereafter photo-z selected candidates) is 2229. This rather broad range of redshift is intended to ensure that we include the bulk of the cluster population, allowing for the intrinsic errors on photo-z’s. In fact, we find that 14 out of the 16 known true members of the twin cluster, which are confirmed by spectroscopy (Stanford et al. 1997; Rosati et al. 1999), are assigned photo-z’s within the above range. We therefore estimate that the completeness of the members of our method is greater than 80%. For blue cluster members, the estimated photo-z’s tend to be smaller than the true values. It is probably because our photo-z technique misidentifies some blue cluster members as red galaxies at smaller redshifts (Kodama et al. 1999). For this reason, the distribution of is likely to be asymmetric around zero. In fact, among the 14 spectroscopically confirmed galaxies, the standard deviation of 5 galaxies with is 0.05, while that of 9 galaxies with is 0.17. Because of this, we take an asymmetric range for photometric members around (ie., ). The remaining 2 galaxies are assigned significantly lower redshifts around . Both of these galaxies have foreground objects near to their images, and the photometry of these member galaxies may be affected by these foreground objects.

To assess our photo-z’s based on the optical data alone (), we compare them to the photo-z’s estimated WITH the -band data (), which are available for the selected areas of our fields. It is expected that the photo-z’s at with the -band have better accuracies since the -band neatly covers the longwards of the rest-frame 4000Å break at this redshift. Here, we use the -band imaging data of the 3 regions ( each; centered on cl1, cl2 and gr3 in Figure 2) taken by ourselves with a near-infrared camera CISCO on the Subaru telescope The integration time of each image is about 30 min and the limiting magnitude is about (). The comparison is shown in Figure 1. The red and blue galaxies indicate the galaxies redder and bluer respectively than a threshold colour, , which corresponds to the typical colour of the local Sab galaxies (Fukugita, Shimasaku, Ichikawa 1995). The numbers of the red and the blue galaxies plotted in Figure 1 are 48 and 200, respectively. For the red galaxies, we have good match between and , suggesting the accuracy of our optical photo-z’s are reliable enough for these red populations. In fact, the standard deviation, average, and median of for the red galaxies is , , and , respectively, if we exclude six highly discrepant galaxies with . For the blue galaxies, however, we see a significant scatter, in particular, we tend to underestimate photo-z’s if we lack the -band. Therefore, we must be careful in treating the blue galaxies. In this paper, however, we rely basically on the red galaxies, and hence this is not a big problem.
Given the broad redshift cut for photometric membership, the above photo-z selected candidates should include significant fraction of field contamination which are not associated to the supercluster. Later in § 3, we discuss the level of field contamination in the structures newly found in this study. We stress, however, this photometric selection has already removed the majority (32914/3514395%) of all the foreground/background galaxies while keeping the bulk (80%) of the cluster members. This essential process has now made it possible for us to unveil the large scale structure possibly associated to the known twin cluster and spread over the entire Suprime-Cam field, which are otherwise embedded in the foreground/background galaxies and invisible.
3 Large Scale Clumpy Structure
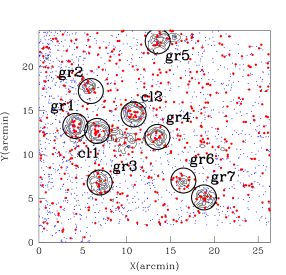
Figure 2 shows the spatial distribution on the sky of the photo-z selected candidates at . The large and small dots indicate red and blue galaxies respectively defined in §2.2. The numbers of the red and blue galaxies are 575 and 1654, respectively. The positions of the galaxies, and , in the Figure 2 are expressed relative to the bottom-left corner of the Suprime-Cam image. The contours indicate the local surface density of the ‘red’ photo-z selected candidates calculated from 10 nearest neighbors, corresponding to 2, 3, 4 and 5. Here corresponds to the scatter (standard deviation) of the local surface density in the case of the random distribution of 575 galaxies over the 590 arcmin2 field of view, ie., 0.97 arcmin-2. We do not include the blue galaxies here for the following reasons: (1) The accuracy of photo-z is relatively poor for the blue galaxies because of their intrinsically weak 4000Å feature (§2.2). (2) The red galaxies trace clusters or groups of galaxies more neatly than the blue galaxies due to the morphology(colour)-density relation (Dressler 1980, Dressler et al. 1997). In fact, many authors have exploited this technique and have successfully identified distant cluster candidates in their wide-field data (e.g., Gladders, Yee 2000; Goto et al. 2002). We note that the surface density of the blue galaxies is more than twice larger in the area of (arcmin) compared to the other area, while the surface density of the red galaxies are nearly the same. This probably comes from the fact that the CCD chips were different between these areas at the time of the observation; in the early phase, the Suprime-Cam consisted of two types of CCDs, SITe (ST-002) and MIT/LL (CCID20). The sensitivities of these 2 CCDs are different especially in the -band, where the limiting magnitudes differ by mag. Hence the number of detected galaxies at with MIT/LL CCD’s are increased compared to the other area. Since we count only red galaxies to define local surface density, however, the contours in Figure 2 are not affected by this effect.
In Figure 2, we mark by large circles the areas where the local surface densities of the red galaxies are higher than 5 above the mean density. The cl1 and cl2 indicate the 2 known high redshift clusters at , RXJ 0848.9+4452 and RXJ 0848.6+4453, respectively. We newly find 7 candidates of galaxy clusters or groups, where the local surface density is as large as those of the known clusters (gr1-gr7).
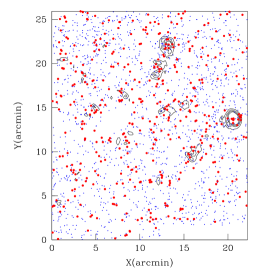
As we noted in § 2.2, our photo-z selected member candidates should include significant amount of field contamination due to the generous criterion for photometric membership (). However, the contrast of our new cluster/group candidates against the general field is always statistically significant. The number density of photo-z selected candidates of red galaxies in the low density () regions is Mpc-2, while those of the high density regions within the circles of 0.7 Mpc radii centered on our cluster/group candidates including the known twin clusters range from Mpc-2 to Mpc-2. To verify the significance of the structures, we present the typical galaxy distribution at in the blank field for comparison using the Subaru Deep Field data (SDF; e.g., Furusawa 2002; Kashikawa et al. 2003; Ouchi et al. 2003) in Figure 3. Here we have applied the photo-z using the same passbands () and have extracted only galaxies that fall within , the same criteria that we used for the Lynx cluster field. The contours indicate the surface number density of the red galaxies within this redshift slice and the contour levels are the same as in Figure 2. As shown, only the two areas with 5 peaks are found in the SDF, while 9 such regions are identified in the Lynx field. It is therefore likely that most of the structures that we found in the Lynx field are real. To further strengthen the reality of the large scale structures associated to the twin cluster, we present below the colour-magnitude diagram, radial profile, and the estimate for cluster/group richness for each clump.

Figure 4 shows the versus diagram for each cluster/group candidate including the two known clusters. Galaxies within a circle of 0.7 Mpc radius are plotted. The filled circles and the filled squares indicate the photo-z selected candidates of red and blue galaxies, respectively. The small dots show the other galaxies. For comparison, we also show the galaxies randomly selected from the low density () regions in the bottom right panel of Figure 4. The number of galaxies shown in this panel is the expected number of galaxies within a circle of 0.7 Mpc radius calculated from the surface density of galaxies in the Lynx field. The solid line in each panel shows the red sequence of the cluster RDCS 1252 at derived by Blakeslee et al. (2003). We applied an appropriate colour-term correction from HST/ACS filters to Suprime-Cam ones. The dashed line in each panel indicates a predicted colour-magnitude relation at for passively evolving galaxies formed at (Kodama, Arimoto 1997), although they are almost identical to the empirically fitted lines (solid lines). Not only in the two known clusters (cl1 and cl2) but also in our new candidates (gr1-gr7), can we find many red galaxies consistent with the passively evolving galaxies which comprise the red sequences in these diagrams.

We also show the radial profile of each cluster and cluster/group candidate in Figure 5. Only those galaxies brighter than are counted because of increasing incompleteness toward fainter magnitudes. Here we subtract the remaining field contamination using the SDF data (see above) from each bin after normalizing counts of field galaxies with referring areas. The averaged surface number densities of all galaxies and the red galaxies are and Mpc-2, respectively, to the same magnitude limit of . Given the large field of views, the field-to-field variation of the galaxy densities should be averaged over, if present, and hence the accuracy of statistical field subtraction should not be largely affected by this effect. We see a pronounced increase in galaxy density towards the center of most of our cluster/group candidates. The only exception is gr6 that shows no excess of galaxy density at the center. This may be due to the misidentification of the center of the group, or intrinsically non-axisymmetric structure. We combine the profiles of known clusters and those of our new candidates (groups) separately, and find that both of these combined profiles can be fitted very well with the King’s law profile, (King 1966, 1972), with Mpc (cluster) and Mpc (group), which is consistent with estimations for local clusters (Bahcall 1975).
| R.A. | Decl. | (0.5-2.0 keV)a | (0.5-2.0 keV)a | |||||
|---|---|---|---|---|---|---|---|---|
| (J2000.0) | (J2000.0) | (Mpc-2) | (Mpc-2) | ( ergs s-1 cm-2) | ( ergs s-1) | |||
| cl1 | 08 48 57.3 | +44 52 02.8 | 1-2 | |||||
| cl2 | 08 48 34.3 | +44 53 52.3 | 1 | |||||
| gr1c | 08 49 11.7 | +44 52 37.0 | () | () | () | (0-1) | ||
| gr2 | 08 49 01.3 | +44 56 33.0 | 0 | |||||
| gr3 | 08 48 57.7 | +44 46 09.5 | 0 | |||||
| gr4 | 08 48 18.7 | +44 51 18.7 | 0 | |||||
| gr5 | 08 48 18.5 | +45 02 13.2 | 0 | |||||
| gr6 | 08 48 02.0 | +44 46 23.1 | 0 | |||||
| gr7 | 08 47 48.7 | +44 44 27.6 | 0-1 |
a aperture
b quoted from Stanford et al. (2001)
c The tabulated numbers for gr1 may be significantly affected by the contamination of the blue galaxies in the (arcmin) region, and hence
unreliable.
d The flux (corrected for the Galactic absorption) and luminosity are given in the rest-frame 0.5–2 keV band. They are converted from the 0.5–2 keV
count rate in the observed frame by assuming an optically-thin thermal plasma model at with a temperature of 6 keV and elemental
abundances of 0.3 solar.
e 3 upper limits
Table 2 summarizes the properties of the known clusters and the cluster/group candidates. The J2000.0 coordinates of the each cluster/group candidate are given in columns 2 and 3. Columns 4 and 5 show the surface number density of all the galaxies and the red galaxies only, respectively, within a circle of Mpc radius. We also only use galaxies at . The remaining field contamination has been subtracted using the SDF data (see above), and the errors indicate the Poisson statistics based on the number of cluster galaxies and that of the subtracted field galaxies. In column 6, we show the estimated richness of each cluster/group candidate, using the indicator introduced by Hill & Lilly (1991). This indicates the number of galaxies within a 0.5 Mpc radius from the cluster center and within the magnitude range between and measured in the band at . Since the band at roughly corresponds to the -band at , we can make a direct comparison with their measurements. The cluster richness estimated based on is 1-2 for cl1 and cl2, while 0-1 for gr1-gr7 (See Table 4 of Hill & Lilly 1991). Therefore we find that the candidates we newly find are poorer systems than the two known clusters. This is also suggested from deep X-ray data around the Lynx field taken with Chandra (Stanford et al. 2001; Stern et al. 2002). Using the Chandra image in the 0.5–2 keV band, we measure the flux of excess diffuse emission in the circular region around each candidate with a radius of 35′′. The background (the unresolved X-ray background and non X-ray background) is estimated from a surrounding annular region. The result is shown in column 8 of Table 2. Note that gr6 and gr7 are outside of the Chandra field. We cannot detect any significant X-ray excess at more than the level for our cluster/group candidates except for the two known clusters. It should, however, be noted that the upper limit luminosity of each region (see column 9 of Table 2) is comparable to a typical luminosity of nearby groups of galaxies. Thus, the non-detection in the Chandra data does not necessarily imply that the regions we find have unusually low X-ray luminosities compared with their optical richnesses. We argue therefore that our ‘Suprime-Cam imaging + photo-z’ method is a very powerful technique in finding clusters or groups in the distant Universe even beyond out to . We note that this is practically the highest redshift structures of ‘normal’ galaxies that can be traced by optical images with our scheme (bracketing the 4000Å-break region in the rest frame).
4 Summary
We have presented the results of deep panoramic imaging of the Lynx supercluster field at taken with the Suprime-Cam on Subaru Telescope. Our multicolour image covers an area of ( Mpc), allowing us for the first time to investigate large scale structure spreading around the known cluster regions at this high redshift. By applying the photometric-redshift technique, we have mapped out the spatial distribution of galaxies near the redshift of the supercluster down to .
We have newly discovered seven cluster/group candidates. These candidates show red colour-magnitude sequences and centrally concentrated profiles, similar to those of the two known clusters in this field, indicating that they are likely to be real clusters/groups of galaxies around the Lynx supercluster, comprising a large-scale structure over 13 Mpc scales. The clumpiness of the candidates suggests that they are in early dynamical stages, being in the process of assembly to a massive cluster.
The next key step will be to confirm with deep spectroscopic observations that the cluster/group candidates we discovered in this study are physically associated with one another and forming a real large-scale structure at . If confirmed, this will be the highest redshift structure of ‘normal’ galaxies ever identified, which will have a large impact on structure formation theories and will bring us invaluable information on the formation and evolution of clusters of galaxies at their early stages.
Acknowledgments
We thank R. Ellis, R. Bower, M. Balogh, T. Yamada and W. Couch for useful discussion. FN acknowledge the financial support from UK PPARC. FN, TK and MO acknowledge support from Japan Society for the Promotion of Science through its research fellowships for young scientists. SO and TK acknowledge the Daiwa-Adrian Prize 2001 given by The Daiwa Anglo-Japanese Foundation. This work was financially supported in part by a Grant-in-Aid for the Scientific Research (No.15740126) by the Japanese Ministry of Education, Culture, Sports and Science.
References
- Aurière (1982) Aurière, M. 1982, A&A, 109, 301
- Bahcall (1975) Bahcall, N. A. 1975, ApJ, 198, 249
- Bahcall and Soneira (1984) Bahcall, N. A., Soneira, R. M. 1984, ApJ, 277, 27
- Bertin and Arnouts (1996) Bertin, E., Arnouts, S. 1996, A&AS, 177, 393
- Blakeslee (2003) Blakeslee, J. P. et al. 2003, ApJ, 596, L143
- Bohlin (1996) Bohlin, R. C. 1996, AJ, 111, 1743
- Bohlin et al. (1995) Bohlin, R. C., Colina, L., Finley, D. S. 1995, AJ, 110, 1316
- Bolzonela et al. (2000) Bolzonella, M., Miralles, J.-M., Pelló, R. 2000, A&A, 363, 476
- Bruzual and Charlot (1993) Bruzual, A. G., Charlot, S. 1993, ApJ, 405, 538
- Calzetti et al. (2000) Calzetti, D., Armus, L., Bohlin, R. C, Kinney, A. L., Koornneef, J., Storchi-Bergmann, T. 2000, ApJ, 533, 682
- Connoly et al. (1996) Connolly, A. J., Szalay, A. S., Koo, D., Romer, A. K., Holden, B., Nichol, R. C., Miyaji, T. 1996, ApJ, 473, L67
- Connoly et al. (1997) Connolly, A. J., Szalay, A. S., Dickinson, M., SubbaRao, M. U., Brunner, R. J. 1997, ApJ, 486, L11
- Dressler (1980) Dressler, A. 1980, ApJ, 236, 351
- Dressler et al. (1997) Dressler, A., Oemler, A., Jr., Couch, W. J., Smail, I., Ellis, R. S., Barger, A., Butcher, H., Poggianti, B. M., Sharples, R. M. 1997, ApJ, 490, 577
- Fukugita et al. (1995) Fukugita, H., Shimasaku, K., Ichikawa, T. 1995, PASP, 107, 945
- Furusawa (2002) Furusawa, H. 2002, PhD Thesis, University of Tokyo
- Gladders and Yee (2000) Gladders, M. D., Yee, H. K. C. 2000, AJ, 120, 2148
- Goto et al. (2002) Goto, T. et al. 2002, AJ, 123, 1807
- Hill and Lilly (1991) Hill, G. J. Lilly, S. J. 1991, ApJ, 367, 1
- Kashikawa et al. (2003) Kashikawa, N. et al. 2003 AJ, 125, 53
- King (1966) King, I. R. 1966, AJ, 71, 1
- King (1972) King, I. R. 1972, ApJ, 174, L123
- Kodama and Arimoto (1997) Kodama, T., Arimoto, N. 1997, A&A, 320, 41
- Kodama et al. (1999) Kodama, T., Bell, E. F., Bower, R. G. 1999, MNRAS, 302, 152
- Kodama et al. (2001) Kodama, T., Smail, I., Nakata, F., Okamura, S., Bower, R. G. 2001, ApJ, 562, L9
- Landolt (1992) Landolt, A. U. 1992, AJ, 104, 340
- Lubin et al. (2000) Lubin, L. M., Brunner, R., Metzger, M. R., Postman, M., Oke, J. B. 2000, ApJ, 531, L5
- Miller and Scalo (1979) Miller, G. E. Scalo, J. M. 1979, ApJS, 41, 513
- Miyazaki et al. (2002) Miyazaki, S. et al. 2002, PASJ, 54, 833
- Moore et al. (1998) Moore, B., Governato, F., Quinn, T., Stadel, J., Lake, G. 1998, ApJ, 499, L5
- Oke (1990) Oke, J. B. 1990, AJ, 99, 1621
- Oke and Gunn (1983) Oke, J. B. Gunn, J. E. 1983, ApJ, 266, 713
- Ouchi et al. (2003) Ouchi, M. et al. 2003, ApJ, 582, 60
- Peacock et al. (2001) Peacock, J. A. et al. 2001, Nature, 410, 169
- Postman et al. (1998) Postman, M., Geller, M. J., Huchra, J. P. 1998, AJ, 95, 267
- Quintana et al. (1995) Quintana, H., Reminrez, A., Melnick, J., Raychaudhury, S., Slezak, E. 1995, AJ, 110, 463
- Rosati et al. (1999) Rosati, P., Stanford, S. A., Eisenhardt, P. R., Elston, R., Spinrad, H., Stern, D., Dey, A. 1999, AJ, 118, 76
- Schlegel et al. (1998) Schlegel, D. J., Finkbeiner, D. P., Davis, M. 1998, ApJ, 500, 525
- Small et al. (1998) Small, T. A., Chung-Pei, M., Sargent, W. L. W., Hamilton, D. 1998, ApJ, 492, 45
- Stanford et al. (1997) Stanford, S. A., Elston, R., Eisenhardt, P. R., Spinrad, H., Stern, D., Dey, A. 1997, AJ, 114, 2232
- Stanford et al. (2001) Stanford, S., A., Holden, B., Rosati, P., Tozzi, P., Borgani, S., Eisenhardt, P. R., Spinrad, H. 2001, ApJ, 552, 504
- Steidel et al. (1999) Steidel, C. C., Adelberger, K. L., Giavalisco, M., Dickinson, M., Pettini, M. 1999, ApJ, 519, 1
- Stern et al. (2002) Stern, D. et al. 2002, AJ, 123, 2223
- Tanaka et al. (2001) Tanaka, I., Yamada, T., Turner, E. L., Suto, Y. 2001, ApJ, 547, 521
- Yagi et al. (2002) Yagi, M., Kashikawa, N., Sekiguchi, M., Doi, M., Yasuda, N., Shimasaku, K., Okamura, S. 2002, AJ, 123, 66