8000
2004
High Resolution X-ray Spectroscopy of SN 1006
Abstract
I discuss the high resolution XMM-Newton Reflection Grating Spectrometer (RGS) spectrum of SN 1006. SN 1006 is one of the best examples of a supernova remnant that is far out of ionization equilibrium. Moreover, optical, UV and X-ray data indicate that it is also out of temperature equilibrium. I discuss the X-ray evidence for this.
In addition I discuss the lower resolution RGS spectrum of the eastern rim of SN 1006. Despite the lower resolution, the spectrum contains significant evidence for an asymmetric expansion velocity. Two likely solutions fit the O VII triplet. One with no significant thermal broadening and a shell velocity of km s-1, and one with significant broadening and a shell velocity of km s-1. The first solution seems the most plausible, as it is consistent with radio expansion measurements, which suggest a decelerated shell.
Keywords:
Document processing, Class file writing, LaTeX 2ε:
43.35.Ei, 78.60.Mq1 Introduction
The study of supernova remnants lies at the crossroads of astrophysics, combining the interests in the end products of stellar evolution with the investigation of the interstellar medium and cosmic ray acceleration. This is all the more interesting now that Type Ia supernovae (e.g. Tonry et al., 2003) have become central to the study of the geometry of the universe and gamma ray bursts are known to originate from a subset of core collapse supernovae (Stanek et al., 2003).

However, of more interest for these proceedings is that supernova remnants are objects in which interesting plasma processes take place. Supernova remnant shocks move through a medium with a typical density of 1 cm-3. At those low densities Coulomb (particle-particle) interactions are rare, leading to typical collision time scales of several thousand years. Shock heating does, however, occur in supernova remnants, otherwise we would not observe X-ray emission from hot plasmas. This implies that the heating process takes place through collective effects, involving plasma waves. Apart from being collisionless, supernova remnant shocks are also the most probable source of cosmic rays, at least for energies up to eV, but possibly even up to eV (Bykov, 2004; Vink, 2004).
The fact that supernova remnant shocks are collisionless and are the locations of particle acceleration has two important consequences. First of all, we can no longer assume that different particles species (protons and other ions and electrons) are in temperature equilibration. In an extreme case, and ignoring particle acceleration, the temperature, , of each plasma component, , is:
| (1) |
where is the adiabatic index, , is the particle mass, and is the shock velocity. For full equilibration this is . In addition, we have to consider that efficient cosmic ray acceleration, and possible magnetic field generation, will take away energy, lowering the plasma temperature(s) of the thermal plasma components (Hughes et al., 2000).
As a result measuring the plasma temperature through X-ray spectroscopy, which usually will give us the electron temperature, will no longer inform us directly about the shock velocity. This has been known for quite some time (e.g. Itoh, 1977, 1984), but until recently it was ignored consciously (e.g. Jansen et al., 1988) or subconsciously, as it was difficult to assess the amount of temperature equilibration from the observational data.
However, another form of non-equilibration, namely non-equilibration of ionization (NEI), has received more attention over the last three decades, because its consequences could be more easily deduced from X-ray spectra of sufficient quality (e.g Winkler et al., 1981; Gronenschild and Mewe, 1982; Hughes and Helfand, 1985; Jansen et al., 1988).
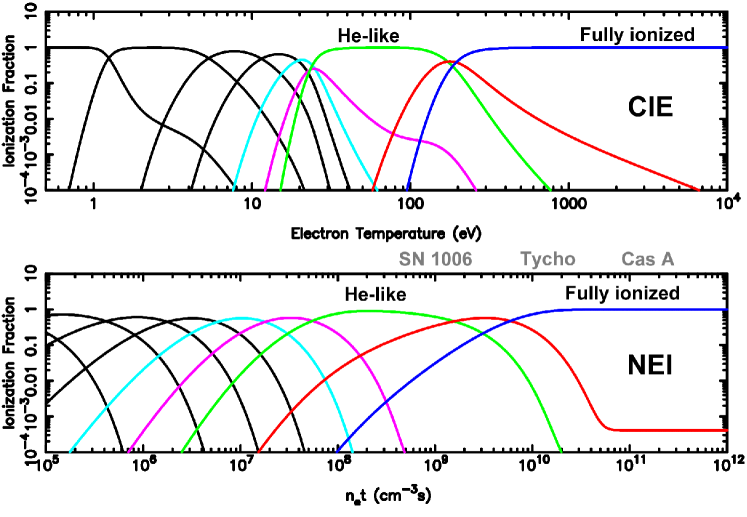
The concept of NEI is relatively simple (Itoh, 1977; Mewe and Schrijver, 1980; Liedahl, 1999). NEI is important in supernova remnants as in the relatively recently heated plasmas the ions have not had sufficient time to ionize up to the ionization level at which the number of ionizations is compensated by the number of recombinations (i.e. collisional ionization equilibration or CIE). The effect of NEI is illustrated in Fig. 1. Observationally NEI gives rise to a mismatch between the electron temperature derived from line emission ratios, and the electron temperature derived from the continuum shape, which reflects the actual electron temperature. In addition, spectra of NEI plasmas will display lines that are unique for NEI, and are the result of inner shell excitations and ionizations. The Fe-K line emission is most widely used as a diagnostic tool for NEI conditions, as for a plasma with keV the centroid of the line emission shifts gradually from keV to keV for Fe XXV (Palmeri et al., 2003; Mendoza et al., 2004).
Here I discuss high resolution spectra of a supernova remnant that is one of the most extreme cases of non-equilibration of ionization and temperatures, SN 1006.

2 The XMM-Newton-RGS spectra of SN 1006
The young historical remnant SN 1006 is thought to be a Type Ia supernova remnant on account of its high Galactic latitude (+14.6) and the long duration of the historical light curve (Stephenson and Green, 2002). The high latitude also explains the relatively low density of the local medium of cm-3 (Vink et al., 2000; Allen et al., 2001; Dyer et al., 2004; Long et al., 2003). This makes SN 1006 the ideal candidate for studying the two non-equilibration effects, as it has an ionization parameter of cm-3s. The distance to SN 1006 is 2.1 kpc (Winkler et al., 2003).
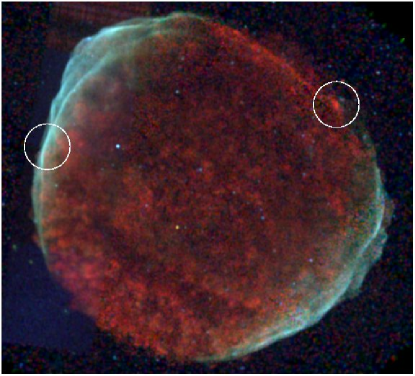
XMM-Newton observed SN 1006 several times, both as a guaranteed time and guest observer target. I will discuss here the guest observer observations of August 2002, which consisted of two pointings. One pointing was on the bright knot at the northwestern edge of the remnant, the other was on a narrow feature on the eastern rim (Fig. 3). SN 1006 is a large remnant (30′), but the pointings were optimized in order to obtain high resolution spectra of bright, small structures. Moreover, the pointings were on the rest of the remnant where it is unlikely that there are bulk plasma motions in our line of sight. This is necessary in order to allow estimates of the thermal line broadening.
A sufficiently high resolution spectrum was obtained for the northwestern pointing, but for the eastern rim, only the non-thermal X-ray emission is very narrow, whereas the thermal emission is much more extended, degrading the spectral resolution. This is somewhat unfortunate, as the electron and ion temperatures of the plasma may be influenced by efficient cosmic ray acceleration, and non-thermal emission from the rims of SN 1006 indicate a very efficient electron cosmic ray acceleration at the west and eastern rims, but not at the northwestern edge (Koyama et al., 1995; Rothenflug et al., 2004).

2.1 The X-ray spectrum of the northwestern knot
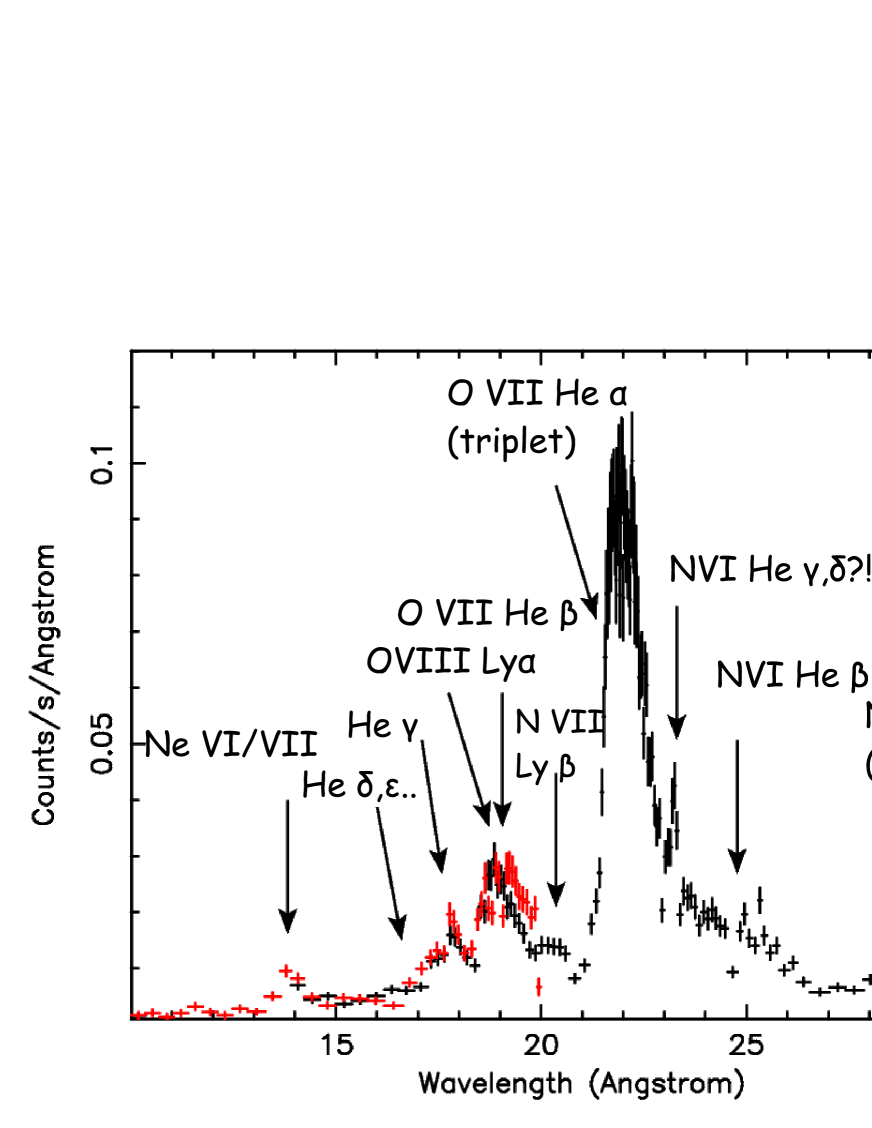
The XMM-Newton Reflection Grating Spectrometer (RGS, den Herder et al., 2001) spectrum of the northwestern knot shows many spectral details that cannot be seen in CCD spectra. The most dominant emission is coming from O VII, in particular from the O VII triplet, but also O VII line emission from higher quantum levels up to the series limits. The line emission around 19 Å is a mix of O VII He emission and O VIII Ly emission. Lines from Fe-L transitions, in particular Fe XVII which has lines around 15 Åand 17 Å are conspicuously absent. This may be surprising given the fact that SN 1006 is a likely Type Ia remnant, which produce of Fe. However, for the low ionization age of SN 1006 Fe is expected to have a peak ionization state of Fe XIII, so no Fe XVII emission is to be expected.
The CCD spectra were modeled using the SPEX111 http://www.sron.nl/divisions/hea/spex/version2.0/index.html (Kaastra et al., 1996) spectral code. The detailed results can be found in (Vink et al., 2003) and confirm the low ionization age of the plasma, cm-3s, whereas keV. There is a relative overabundance of Si, which suggests that the knot is an ejecta knot, and not a shocked pre-existing density enhancement in the interstellar medium. Interestingly, there is a weak enhancement of X-ray emission in front of the knot as well, that seems to emit slightly harder X-ray emission. It is not clear how these relate to each other.
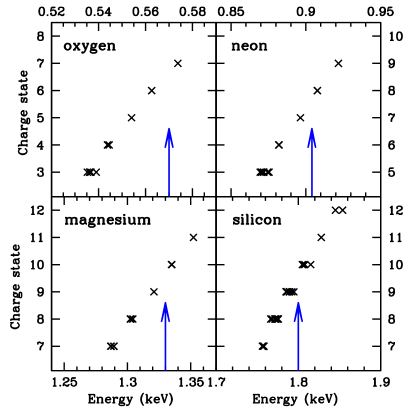
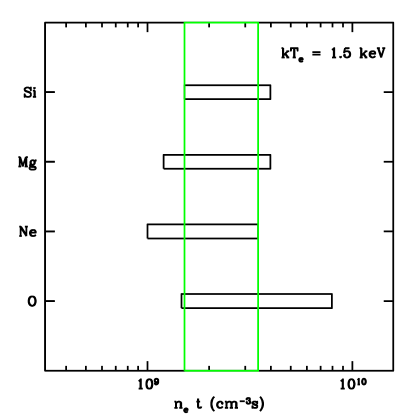
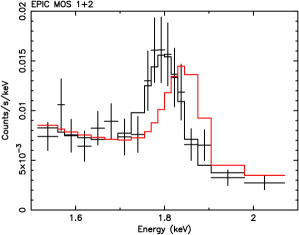
The low ionization age of the plasma can be deduced not only by globally fitting the spectrum, but also by measuring the centroid of each individual line, or by modeling the O VII triplet. For instance the EPIC PN and MOS spectra clearly indicate that the centroid of the Si emission is keV instead of at 1.85 keV, which is the centroid expected if Si is in the He-like state (Fig. 5). Also the Ne and Mg line centroids are at lower energies than the He-like. Purely combining the information of the centroids, and assuming keV one also finds an ionization age of cm-3s (Fig. 6). The most important inner shell lines are present in the SPEX spectral code, but in general one should be aware that spectral codes are not always complete in this sense, as most atomic databases were initially compiled with CIE plasmas in mind. Moreover, the line parameters may also be less accurate, as less experimental data exists to measure the line properties.
2.2 Non-equilibration of temperatures in the northwestern knot
One of the main goals of the XMM-Newton observations was to measure the amount of non-equilibration of electron and ion temperatures, by measuring the thermal Doppler broadening of O VII and O VIII line emission. So far evidence for non-equilibration in supernova remnants comes mainly from measuring the H line width and broad to narrow line ratios. This has been done for several remnants including SN 1006 (Ghavamian et al., 2002; Rakowski et al., 2003). The amount of non-equilibration has also been measured in the UV from C IV, N V and O VI lines by HUT (Laming et al., 1996) and very recently by FUSE (Korreck et al., 2004). The optical and UV results indicate that there is no equilibration at the shock front, although the FUSE results suggests that the temperature of different species is not proportional to the species mass, as implied by eq. 1 and the HUT spectrum.
The O VII He emission consists of the He triplet, plus a potential contribution from an O VI line very close to the O VII forbidden line emission. In order to measure the Doppler broadening models for the line ratios for a grid of values were fitted, using parameters obtained from the flexible atomic code (FAC) of Dr. M. F. Gu (Gu, 2003). The spectrum of the RGS1 O VII spectrum and the best fit models are shown in Fig. 7. The best fit suggests a very significant broadening at a confidence level of 9.8. Allowing full freedom of the line normalizations still indicates thermal broadening, at a still high confidence level of 6.5. The broadening itself is eV. The published results are based on a response matrix that was corrected for the emissivity profile shown in Fig. 3. However, the fitting program XSPEC also contains the convolution model rgsxsrc made by Dr. A. Rasmussen, which uses an input image to determine the emissivity profile. Using rgsxsrc gives very similar results.
The derived value for the broadening implies an oxygen temperature of keV, which looks incredibly high, but is in effect consistent with eq. 1 if the gas was shocked with a velocity of km s-1. Of course the oxygen temperature is more than a factor 300 higher than the electron temperature, clearly indicating non-equilibration of temperatures. The measured O VII line broadening is more than reported for O VI UV emission from other regions of the northwestern rim 222Unfortunately in (Korreck et al., 2004) the measured broadening in is mistakenly taken to be a FWHM. (Korreck et al., 2004). There are several reasons why there could be a discrepancy. The knot may be an ejecta knot, as implied by the high Si abundance, and the heating may have been caused by the reverse shock, which has a different speed than the shock. Another possibility is that the plasma of the knot was shocked earlier than the regions observed in O VII, after all the X-ray measurements concern more highly ionized material, which is situated further downstream from the shock.

2.3 What about the eastern rim?
The eastern and western rims of SN 1006 are likely sites of efficient cosmic ray shock acceleration (Koyama et al., 1995). If the cosmic ray pressure dominates over the thermal pressure, eq. 1 is no longer valid. It will result in an average plasma temperature that is lower. Moreover, if the cosmic ray is very efficient and the cosmic ray power law index is equal to or flatter than -2, the energetic cosmic rays that escape the shock will drain the shock of its energy and the shock will become (cosmic) radiative, resulting in much higher shock compression ratios (Ellison et al., 2004).
Given the interesting physics at the eastern and western rim, it is unfortunate that the RGS spectrum from the eastern rim does have a high spectral resolution, especially since no UV emission lines from the eastern rim have been detected by FUSE (Korreck et al., 2004). It is therefore still worthwhile to obtain as much information from the RGS spectrum as possible. I will therefore discuss here a preliminary analysis of RGS spectrum.
The effective spectral resolution is mainly determined by the width of the shell, about 5′, resulting in an effective resolution for the first order spectrum of Å. This is not sufficient to resolve the O VII triplet, which is also for the eastern rim the dominant line emission. However, there is still high spectral resolution information in the spectrum, which results from the sharp increase of the emission at the edge of the remnant.
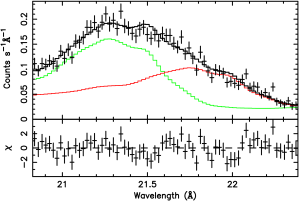
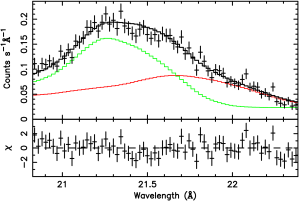
The O VII triplet emission is displayed in Fig. 8. It shows that a model that does only contain the triplet lines and an instrumental response that only takes into account the spatial emission profile does not give an adequate fit. The long wavelength side seems to fit reasonably well, but there is a dip in the data around 21.5 Å, and the model underpredicts the emission around 21.3 Å. Note that here the interior of remnant is dispersed in an opposite direction compared to the spectrum of the northwestern knot. So the edge of the remnant determines the shape of the long wavelength side. This suggests that discrepancy is caused not so much by line broadening, but by line shifts. The plasma motions at the edge of the remnant, will be mostly in the plane of the sky, whereas going to the interior of the remnant radial motions will give rise to Doppler shifts. As we are observing both the front and backside of the shell, both blueshifts and redshifts should be taken into account. The redshifts are not directly noticeable (they blend in with the rest of the triplet emission), but the blueshifts can be seen as the mismatch between model and spectrum around 22.3 Å.
I have attempted to fit a simple model for the O VII triplet, taking into account the increase in blueshifts and redshifts moving interior to the remnant (corresponding to shorter wavelength). As it is a mixing of spectral and spatial information, the method consisted in making a grid of response matrices in which the spatial and redshift and blueshift were incorporated. The input to the model consisted of the projected plasma velocity, which increased toward the interior, and a parameter that determined how much of the emission was coming from the near and far side of the remnant. This is a simplification, as velocity gradients are presents and the morphology of the shell may be complicated. It was nevertheless possible to obtain acceptable fits to the O VII triplet emission (Fig. 8).
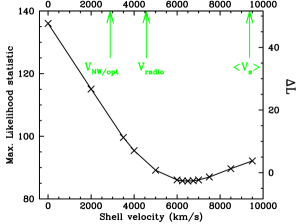
It turns out there are two good fitting models. One with no, or only a small additional (thermal) broadening ( eV), and a shell with velocity km s-1 (68% confidence range, Fig. 8). The other solution is for a much higher shell velocity of km s-1, and quite a substantial additional broadening of eV. In both cases the best solution suggests that about 70% emission comes from material moving toward us ( at a 3 confidence). The solution with a large broadening gives a better fit (Fig. 8), but is less plausible. The reason is that a bulk velocity of km s-1would imply that the shock heated plasma is still in free expansion, whereas a solution with km s-1 fits in much better with radio proper motions Moffett et al. (1993). The average shock velocity of SN 1006, given its age and distance is km s-1. The radio expansion measurements suggest that km s-1. Both solutions exclude the possibility that the plasma velocity is similar to what has been measured for the northeastern H filaments km s-1 (Ghavamian et al., 2002). This is consistent with the smaller radius in the northwest and the finding of an increased density as indicated by 21cm line measurements (Dubner et al., 2002).
The shape of the O VII triplet suggests that more material is blueshifted than redshifted. This asymmetry is reminiscent of the difference in forward shock and reverse shock velocity found in absorption toward a UV star projected on the center of SN 1006 (Hamilton et al., 1997). The reverse shock appears to have penetrated more into the innerejecta layers of the front side than on the backside. Such an asymmetry is likely to be the result of a higher density at the front side, which will also result in more shocked heated plasma at the front side.

3 Concluding remarks
SN 1006 is from many points of view an interesting supernova remnants. It is one of the few historical remnants, and it was the first remnant for which it was established that the particle acceleration by the shock was efficient enough to produce X-ray synchrotron emission. The fact that SN 1006 expands into a low density medium makes it also an ideal laboratory to study the effects of non-equilibrium ionization and non-equilibration of temperatures, both of which depend on the value of , which is around cm-3s for SN 1006, one of the lowest values found in a supernova remnant.
The measurements presented here show the diagnostic power of high resolution spectroscopy when it comes to characterizing the ionization state, temperature and velocities of hot plasma. The results on a remnant like SN 1006 raises the expectation for the results from micro-calorimeters carried by Astro-E2, and Constellation-X/Xeus, which will make it much more straightforward to measure Doppler motions from extended sources.
I thank the organizers of the XDAP 2004 workshop for their invitation and financial support.
References
- Tonry et al. (2003) Tonry, J. L., et al., ApJ , 594, 1–24 (2003).
- Stanek et al. (2003) Stanek, K. Z., et al., ApJL , 591, L17–L20 (2003).
- Shull and van Steenberg (1982) Shull, J. M., and van Steenberg, M., ApJS , 48, 95–107 (1982).
- Zeldovich and Raizer (1966) Zeldovich, Y., and Raizer, Y. P., Elements of gasdynamics and the classical theory of shock waves, New York: Academic Press, 1966, edited by Hayes, W.D.; Probstein, Ronald F., 1966.
- Huba (2002) Huba, J. D., NRL Plasma Formulary (2002).
- Bykov (2004) Bykov, A. M., Advances in Space Research, 33, 366–375 (2004).
- Vink (2004) Vink, J., Adv. of Space Research , 33, 356–365 (2004).
- Hughes et al. (2000) Hughes, J. P., Rakowski, C. E., and Decourchelle, A., ApJL , 543, L61–L65 (2000).
- Itoh (1977) Itoh, H., PASJ , 29, 813–830 (1977).
- Itoh (1984) Itoh, H., ApJ , 285, 601–606 (1984).
- Jansen et al. (1988) Jansen, F., et al., ApJ , 331, 949–957 (1988).
- Winkler et al. (1981) Winkler, P. F., et al., ApJ , 245, 574–580 (1981).
- Gronenschild and Mewe (1982) Gronenschild, E. H. B. M., and Mewe, R., A&AS , 48, 305–331 (1982).
- Hughes and Helfand (1985) Hughes, J. P., and Helfand, D. J., ApJ , 291, 544–560 (1985).
- Mewe and Schrijver (1980) Mewe, R., and Schrijver, J., A&A , 87, 261–268 (1980).
- Liedahl (1999) Liedahl, D. A., Lecture Notes in Physics, Berlin Springer Verlag, 520, 189–+ (1999).
- Palmeri et al. (2003) Palmeri, P., et al., A&A , 410, 359–364 (2003).
- Mendoza et al. (2004) Mendoza, C., Kallman, T. R., Bautista, M. A., and Palmeri, P., A&A , 414, 377–388 (2004).
- Vink et al. (2003) Vink, J., Laming, J. M., Gu, M. F., Rasmussen, A., and Kaastra, J., ApJL , 587, 31–34 (2003).
- Stephenson and Green (2002) Stephenson, F. R., and Green, D. A., Historical supernovae and their remnants, Oxford: Clarendon Press, 2002.
- Vink et al. (2000) Vink, J., Kaastra, J. S., Bleeker, J. A. M., and Preite-Martinez, A., A&A , 354, 931–937 (2000).
- Allen et al. (2001) Allen, G. E., Petre, R., and Gotthelf, E. V., ApJ , 558, 739–752 (2001).
- Dyer et al. (2004) Dyer, K. K., Reynolds, S. P., and Borkowski, K. J., ApJ , 600, 752–768 (2004).
- Long et al. (2003) Long, K. S., et al., ApJ , 586, 1162–1178 (2003).
- Winkler et al. (2003) Winkler, P. F., Gupta, G., and Long, K. S., ApJ , 585, 324–335 (2003).
- Koyama et al. (1995) Koyama, K., et al., Nat , 378, 255–+ (1995).
- Rothenflug et al. (2004) Rothenflug, R., et al., A&A , 425, 121–131 (2004).
- den Herder et al. (2001) den Herder, J. W., et al., A&A , 365, L7–L17 (2001).
- Kaastra et al. (1996) Kaastra, J. S., Mewe, R., and Nieuwenhuijzen, H., “A new spectral code,” in Proc. of the 11th Coll. on UV and X-ray, UV and X-ray Spectroscopy of Astrophysical and Laboratory Plasmas, ed. K. Yamashita & T. Watanabe (Tokyo:Universal Academy Press), 1996, p. 411.
- Ghavamian et al. (2002) Ghavamian, P., Winkler, P. F., Raymond, J. C., and Long, K. S., ApJ , 572, 888–896 (2002).
- Rakowski et al. (2003) Rakowski, C. E., Ghavamian, P., and Hughes, J. P., ApJ , 590, 846–857 (2003).
- Laming et al. (1996) Laming, J. M., Raymond, J. C., McLaughlin, B. M., and Blair, W. P., ApJ , 472, 267–+ (1996).
- Korreck et al. (2004) Korreck, K. E., Raymond, J. C., Zurbuchen, T. H., and Ghavamian, P., ApJ , 615, 280–285 (2004).
- Gu (2003) Gu, M. F., ApJ , 593, 1249–1254 (2003).
- Ellison et al. (2004) Ellison, D. C., Decourchelle, A., and Ballet, J., A&A , 413, 189–201 (2004).
- Moffett et al. (1993) Moffett, D. A., Goss, W. M., and Reynolds, S. P., AJ , 106, 1566–1572 (1993).
- Dubner et al. (2002) Dubner, G. M., et al, A&A , 387, 1047–1056 (2002).
- Hamilton et al. (1997) Hamilton, A. J. S., Fesen, R. A., Wu, C.-C., Crenshaw, D. M., and Sarazin, C. L., ApJ , 481, 838–+ (1997).