Strong Lensing Constraints on the Properties of Cluster Galaxies
Univ. of Minnesota, Minneapolis, MN, USA
E-mail
Prasenjit Saha
Queen Mary & Westfield, Univ. of London, UK
E-mail
p.saha@qmul.as.uk
Abstract:
A recently discovered quadruply-imaged QSO, SDSS J1004+4112
(Inada et al. 2003; Oguri et al. 2004)
in the core of a galaxy cluster has an unprecedented image
separation of . This lens gives us a unique opportunity
to study the detailed mass distribution in the central regions of this
cluster. We present free-form
reconstructions of the lens using recently developed methods.
The projected mass within 100 kpc is well-constrained as
, consistent with previous simpler models.
Unlike previous
work, however, we are able to detect structures in the lens
associated with cluster galaxies. We estimate the mass associated
with these galaxies, and show that they contribute not more than
about 10% of the total cluster mass within 100 kpc. Typical galaxy
masses, combined with typical luminosities yield a rough estimate
of their mass-to-light ratio, which is , implying
that these galaxies consist mostly of stars, and possess little
dark matter.
\PoS
PoS(BDMH2004)100
Method. The lens is divided into 100-1000
independent mass pixels.
Image positions are taken as fixed model (primary) constraints.
Because these are greatly outnumbered
by the unknowns, secondary constraints are needed.
PixeLens generates a large number of individual mass maps; we
show the ensemble averages, or ‘best estimate’ maps, from the Bayesian
point of view.
Secondary Model Constraints, or Priors:
(1) No pixel can have a negative mass: .
(2) The lens must be centrally concentrated.
PixeLens implements this by restricting
the direction of the mass density gradient, at every
pixel’s location. The default value is ,
meaning that the density gradient must point within
of center.
(3) Circularly averaged double logarithmic projected
density slope in the image annulus,
(where ) can be constrained.
(4) The influence of a nearby group or cluster
can be incorporated as an external shear, whose approximate direction,
, is a model input. A given input allows any
shear direction within of .
Results. We show results using two sets of priors:
Prior A has , while
Prior B has .
For both, , and
We experimented with several other types of priors. The basic results do not change:
(1) All recovered mass maps show the Northern and the South-Eastern galaxy
groupings;
(2) Fraction of cluster mass associated with individual galaxies ;
(3) Typical per galaxy is .
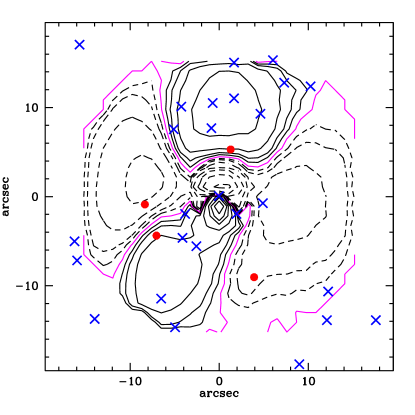
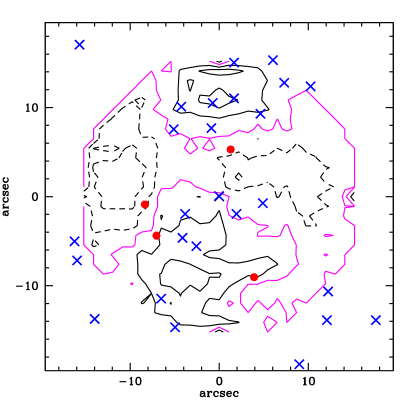
Figure 1: Residual mass maps obtained by subtracting the circularly averaged mass
distribution from PixeLens ensemble average maps. The solid black contours
indicate positive surface mass density residuals, and are drawn at
surface mass density, in terms of critical for lensing of ,
or, equivalently, . The dashed black
contours indicate negative surface mass density residuals. Purple contour indicates
zero density residual. The reconstruction
window has radius , the sky scale being ;
the full horizontal scale is 300 kpc.
In each panel the mass maps shown are averages from ensembles of 500;
additional smoothing has been applied to the maps using .
Red dots are QSO images.
Blue crosses are galaxies with , taken from Fig. 13a of Oguri et al. (2004).
Left: Prior A.
The derived typical galaxy M/L, while the fraction of mass
associated with galaxies is .
Right: Prior B.
The derived typical galaxy M/L, and the fraction of mass
associated with galaxies is (see Williams & Saha 2004 for details).