Deep VLT -band Imaging of the Field of a Candidate Galaxy: Below the Lyman Limit?11affiliation: Based on Director’s Discretionary time observations collected at ESO-VLT under program 273.A-5028(A)
Abstract
We present a deep 16.8 ks -band image of the field of a candidate galaxy magnified by the foreground () cluster A1835. The image was obtained with FORS1 on VLT-Kueyen to test whether the -band lies below the Lyman limit for this very high redshift candidate. A detection would unambiguously rule out that the source is at . The detection limit of the image in the area of the candidate is in a 2″-diameter aperture (about 3 times the seeing FWHM of 07). No source at the position of the candidate galaxy is detected down to this limit. Formally, this is consistent with the -band probing below the Lyman limit in the rest-frame of a source. However, given the recent non-detection of the object in a deep -band exposure with NIRI on Gemini North down to ( in a 14 aperture) and concerns about the detection of the reported associated emission line, it may be possible that this source is spurious. We discuss several astrophysical possibilities to explain the puzzling nature of this source and find none of them compelling.
1 Introduction
Motivated by the discovery of high redshift, quasars with what appeared to be Gunn-Peterson troughs (Becker et al., 2001; Djorgovski et al., 2001), many research groups began to search for the sources responsible for reionization (see e.g., Lehnert & Bremer, 2003; Bremer et al., 2004a; Stanway et al., 2004a, b; Bunker et al., 2003; Ajiki et al., 2003; Rhoads et al., 2003; Bouwens et al., 2004; Hu et al., 2004). The WMAP result of the surprising detection of a large Thompson electron optical depth of (Kogut et al., 2003) and questions about whether the intergalactic opacity at is due to the neutral intergalactic medium (IGM) or to discrete absorbers (e.g., Songaila & Cowie, 2002) have led observers to try and push discovery techniques into the near-infrared (NIR) and beyond the redshift of the most distant Sloan quasars (Pelló et al., 2004; Kneib et al., 2004).
To reconcile the possible Gunn-Peterson troughs observed in high redshift quasar spectra and the WMAP results, the fact that the ionizing photon density at high redshift appears to be declining (e.g., Lehnert & Bremer, 2003; Bunker et al., 2003) and the rapidly increasing density necessary to ionize the IGM at successively higher redshifts (e.g., Madau, Haardt, & Rees, 1999) suggest that the universe may have had a complex reionization history. Indeed, these arguments led some researchers to propose complex models such as extended partial reionization (e.g, Madau et al., 2004; Ricotti & Ostriker, 2004) or twice reionization (e.g., Cen, 2003; Ciardi et al., 2003; Wyithe & Loeb, 2003). In these complex scenarios, the discovery of even one high redshift star-forming galaxy provides powerful constraints on the sources of reionization and on how star formation proceeded in the early universe (e.g., Ricotti et al., 2004).
But discovering galaxies at redshifts beyond becomes increasingly challenging. Rest-frame emission longwards of the Lyman limit is redshifted to observed Å and the faintness of the galaxies makes them extremely difficult to detect. The essential spectroscopic confirmation is hampered by the dramatic increase in the density of telluric OH emission bands at Å. There are regions Å wide that are relatively devoid of OH lines and narrow-band surveys for high redshift sources within these windows have been successful (e.g., Hu et al., 2004). Outside of these windows, even determining redshifts of color selected galaxies is generally very difficult at .
One technique developed to overcome the difficulty of detecting the most distant galaxies takes advantage of gravitational lensing by an intervening galaxy cluster to boost the apparent brightness of background sources. This boost can be as much as a factor of along the critical lines for lensing. Santos et al. (2004) proved the feasibility of this technique out to and Kneib et al. (2004) discovered a probable lensed Lyman break galaxy behind A2218. The efficiency of gravitational lensing assisted searches compared to blank field searches is, however, sensitive to the slope of the luminosity function and thus its overall utility in finding large numbers of high redshift galaxies has yet to be assessed.
Pelló et al. (2004) reported the identification of a highly magnified galaxy lying on a critical line of the cluster A1835 (which they denoted A1835-1916). Their data set included broad-band optical imaging from the HST and the CFHT along with NIR imaging and spectroscopy with ISAAC at the VLT. The object was undetected in the optical bands, and only detected at in and in . The -band detection quoted by Pelló et al. (2004) is formally an upper limit. The optical non-detection, the large break between the and bands, and the blue color () found by Pelló et al.could possibly indicate a young galaxy at extremely high redshift. In their -band spectroscopy Pelló et al.reported an emission line at 1.33745 µm, detected in two separate wavelength settings of the spectrograph and with a combined significance of . The photometry, together with the lensing model suggesting the source lies on a caustic for very high redshift (with a magnification factor between 25 and 100 as being most likely), led Pelló et al.to argue that the line is most likely Ly at . Unfortunately, the signal-to-noise ratio of the spectrum is insufficient to show the telltale signature of the line profile asymmetry of highly redshifted Ly to rule out other line identifications. Given the uncertainties in the lensing model, the most important piece of evidence upon which the conclusion of rests is the shape of the spectral energy distribution (SED) measured from the imaging data.
However, the high redshift nature of this source has been recently questioned. Based on new independent -band data obtained with NIRI at the Gemini North telescope, Bremer et al. (2004b) did not detect the candidate down to the limit of . This limit is 1 magnitude deeper than the detection quoted by Pelló et al. (2004) in their ISAAC data. This significantly weakens the main evidence for a redshift of 10, which relies on the strength of the break between the optical and bands and the band. The photometry no longer constrains the redshift and other identifications for the emission line from a lower redshift source remain possible.
Before the Bremer et al. (2004b) results were obtained, we were awarded Director’s Discretionary Time with FORS1 at the VLT to conduct -band imaging of the field around the candidate and push the sensitivity to fainter levels than presented by Pelló et al. (2004). A -band detection would be decisive: it would demonstrate beyond any doubt that the source is not at . Besides probing rest-frame wavelengths Å for , well below the Lyman limit, we chose the -band to reach within a reasonable observing time very sensitive limits compared to other optical or NIR bands and thus provide the best chance of detecting a reddened object, which seems a likely alternative (see Bremer et al., 2004b).
2 Data and analysis
2.1 Observations and Data Reduction
The -band observations of A1835 were carried out during Director’s Discretionary Time on the nights of 2004 July 9, 16, and 19 (UT). We used FORS1 on the VLT-Kueyen telescope in imaging mode with a projected scale of . Forty-eight separate frames of 350 s each were taken, for a total integration time of 16.8 ks. Half of the integration time was taken on 2004 July 16 and one-third on 2004 July 19, with only a small fraction (1/6) on 2004 July 9. The conditions were clear and the seeing was typical for the VLT in the optical, varying from 05 to 10 with a median of about 07. Each individual dithered exposure had a unique (non-redundant) pointing position, centered around the location of the candidate.
We reduced the data within IRAF as follows. We subtracted the bias from each frame using bias frames taken at the beginning and end of each night. We flattened each frame initially with flat field images produced by a combination of dithered sky images taken during twilight. From these bias-subtracted and flat-fielded images, we created a master sky flat by combining all of the dithered exposures of the target field, masking out all sources above of the average rms of each frame (the rms calculated including the whole frame). This flat was divided into each dithered frame. From the master sky flat, we also generated the bad pixel map used to exclude the bad pixels in each frame during the final combination. We determined the offsets between individual exposures by fitting the position of about 30 bright, unsaturated stars. We co-averaged the reduced, registered frames using three different weightings: 111The weight is applied as multiplicative factor . (1) uniform weighting, (2) weighting by the seeing FWHM of each frame, which gives most weight to the frames with best seeing, and (3) weighting by the FWHM times the squared root of the average sky counts in each frame, which accounts for the rms noise within the seeing disk and optimizes for point-source detection. There is little variation in the sensitivity of the final images between the three different schemes. The latter two produce final combinations with the best FWHM of . For the analysis, we adopted the image combined following the third weighting scheme.
To flux-calibrate the data we measured the photometric zero points using exposures of standard stars taken at the beginning and end of each night. We compared these measurements to zero points estimated throughout the month encompassing the range of observing dates. All zero points were in excellent agreement (within ) and the final calibration is based on the average measured by ESO during 2004 July when our data were taken. 222The ESO FORS1 zero points are available at http://www.eso.org. The average sky brightness in the final image is , and varies among the individual frames by a few tenths of a magnitude. 333We refer to the Vega photometric system when not explicitely indicating AB magnitudes. For the band, the AB correction is very small, with for FORS1 accounting for the full system transmission.
2.2 Photometry
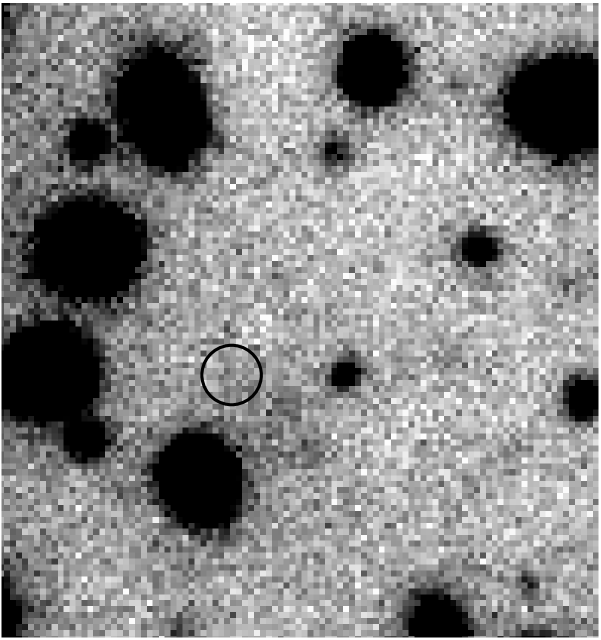
Figure 1 shows the region in our -band image around the reported location of the candidate galaxy. We do not detect any source at this position down to the faintest levels reached in our data. This implies a limit of in a 2″-diameter aperture, as described below. 444This aperture size corresponds to 3 times the seeing FWHM in the combined data and has a negligible aperture correction except for the brightest point sources and the most extended objects. We note that it leads to conservative limits for faint point sources, for which the S/N is optimized with an aperture of 1.5 times the FWHM. Our limit is 0.6 mag deeper than the limit of Pelló et al. (2004) given for a 06 aperture, or about 3.5 mag deeper for an aperture of 3 times the FWHM (076) of their -band data, assuming uncorrelated Gaussian noise.
We assessed our ability to reliably set a meaningful upper limit to any possible source at the position of the candidate using three different techniques. First we established the pixel-to-pixel rms variations in the background across the entire image. For this purpose, we used the Sextractor software (Bertin & Arnouts, 1996). Sextractor estimates the local background level in a mesh grid over the image. These local background estimates are iteratively clipped until they converge to around the median of all meshes. The histogram of all remaining unclipped pixels is then used to determine the rms variations of the background noise in the image. This procedure yielded an overall detection limit of in a 2″-diameter aperture. However, this limit is pessimistic because our image is very crowded with cluster and background galaxies at the depths reached: the surface density of faint sources is such that there is typically only about 4″ between adjacent objects. Thus, the rms variations derived in this way partly reflect extended light profiles of the myriad of galaxies in the image.
To obtain more realistic estimates of our detection limits in the area around the candidate, we focussed our analysis to the region within ″ of its reported location. We placed 30-60 apertures 2″ in diameter all away from the outer light profile of any obvious object in this area. This procedure was repeated several times with differing numbers of apertures and positions to ensure that our final estimates were not critically dependent on the number of apertures or their exact placement. The average pixel-to-pixel rms within these apertures implies a detection limit of , with variations of between the apertures. The variation in the total residual flux within each aperture implies a detection limit of .
To further determine the robustness of our detection limits, we placed 20 artificial point sources each at 3 different AB magnitudes, 27.6, 27.8 and 28.0, within ″ of the reported location of the candidate and avoiding all obvious sources in this region. The high degree of crowding limits the number of point souces that can be placed non-redundantly close to the position of the candidate to about 20. We recovered the sources down to at a rate similar to that expected for a detection limit (i.e. 50%), and the dispersion between the measured and true input brightness was . Given the excellent agreement between the two most robust methods, we adopted as the detection limit in a 2″ aperture at the position of the candidate.
3 Discussion
The non-detection in our VLT FORS1 band data down to a faint limit has implications for the nature of the source investigated by Pelló et al. (2004). Formally, a non-detection is consistent with the candidate having a redshift of 10. The Bessel band filter has an effective wavelength of 5540 Å and half maximum transmission at about 5000 and 6000 Å. For , these wavelengths correspond to 500 Å and the range Å in the rest-frame — well below the Lyman limit and completely opaque. The lower limit to the redshift, if the -band non-detection is caused solely by the IGM opacity below the Lyman limit, is . However, there is substantial opacity within the Lyman forest at these redshifts and thus -band Lyman break or drop-out galaxies have redshifts that are usually less than this (see e.g., Bremer et al., 2004a).
Although our -band non-detection may allow for , or even , this is not the only interpretation possible in view of other lines of evidence that have recently come to light. There are certainly two other hypotheses that are equally plausible, and perhaps significantly more likely.
The strongest evidence for the interpretation presented by Pelló et al. (2004) relied on the large break among the optical, , and bands, and the subsequent detection of an emission line at 1.33745 µm. However, this evidence has now been called into question. Bremer et al. (2004b) did not detect the candidate object in their new independent and deeper -band image from NIRI down to (). This greatly weakens the argument based on the break strength (as well as the blue color) that supported the claim for the emission line being Ly at . Furthermore, Weatherley et al. (2004) have recently questioned the robustness of the line detection. However, this was based on a re-analysis of the spectroscopic data used by Pelló et al. (2004) and subtle differences in reduction techniques could lead to contentious results. It is probably reasonable to conclude that the significance of the line is difficult to judge.
If the object is not at a redshift of 10, then what could it be? One way forward is to assume the reality of the line, use the sensitive -band limit of Bremer et al. (2004b), and assume an alternative line identification to determine if the emission properties are reasonable for a galaxy at a lower redshift. Bremer et al.argued that the source could be a dwarf/HII galaxy at intermediate redshift and that lines such as the [O II] doublet, [O III], or H at are the most likely alternatives to Ly. If it were [O III], then the line width and luminosity would be consistent with the local relationship for dwarf/H II galaxies between these quantities (e.g., Melnick, Terlevich, & Terlevich, 2000). In light of our new -band results, we wish to further this argument.
Assuming the line is [O III] at and adopting reasonable cosmological parameters (, , and ), our -band limit implies an unlensed absolute magnitude fainter than at 2080 Å. Since there is no published detailed analysis of the mass model of the intervening cluster, it is difficult to quantitatively assess the magnification factor for (Pelló et al. suggested a magnification factor of between 25 and 100 for a source at ). Conservatively, we assume no lensing; lensing will only make the source intrinsically fainter. The co-moving density of galaxies in the local universe with absolute magnitude at 2000 Å is (Treyer et al., 1998). The number of such sources on the sky with is then if the UV luminosity function does not evolve out to . The luminosity function of Lyman break galaxies implies a roughly similar surface density for such faint objects (Steidel et al., 1999). Comparable densities would be inferred to a factor of 1.5 if the line were H at or [O II] at .
The surface density of sources down to the detection limit of our image is 50 arcmin-2 (modulo the incompleteness). Therefore the probability of finding and perhaps even mistaking it for a very high redshift source is consequently high. The immediate explanation is that the source might simply be fainter. However, this poses problems when trying to reconcile the broad-band flux limits with the reported emission line flux.
The -band limit obtained by Bremer et al. (2004b) coupled with the line flux given by Pelló et al. (2004) implies an observed equivalent width (EW) of Å (assuming a flat continuum between 1.65 and 1.34 µm; if the source were redder [bluer] as suggested by Bremer et al., the EW limit would be higher [lower]). Assuming the line is [O III] at , the corresponding rest-frame EW is Å. For the alternative case of H at , Å, and of [O II], Å. Locally, such large EWs are only found in galaxies with low metallicity and blue colors (Sullivan et al., 2000).
Although the Bremer et al.-band limit sets a reasonably stringent lower limit on the EW of the line, our -band limit may provide an even stronger constraint. Locally, sources with large emission line EWs are very blue, with colors always bluer than for a flat spectrum (Sullivan et al., 2000). For sources at this implies observed . Supposing again the source is at and assuming conservatively it has a flat spectrum, our limit of implies an -band limit of and, repeating the reasoning above, a rest-frame EW for [O III] of Å(500 Å if H, 300 Å if [O II]). For a bluer spectrum as observed locally, the line EW limit only increases. A similar argument would apply to any other optical line. Such high EWs are rarely observed, would require a very young age () and perhaps an initial mass function heavily skewed toward massive stars.
Summarizing the above arguments, our sensitive -band limit implies a faint intrinsic UV ( Å) absolute magnitude. Plausible luminosity functions predict a high surface density of such objects and thus a high probability of detection if the source were just bright enough to match the limiting magnitude of our -band image. No object is detected at the expected location despite the high density of sources in the data. Postulating then that the object could be fainter, the lower limits on the rest-frame EW of the emission line become very large and the probability of detecting such a source becomes very low. Thus, in view of the simple astrophysics of line emission, the scenario of an intermediate redshift dwarf does not appear very likely given the difficulties in reconciling the broad-band limits with the emission line flux. Additionally, although largely circumstantial, the arguments could perhaps cast doubt on the reported line flux (Weatherley et al., 2004).
The other possible scenario is that the source may be transient or variable. The NIR ISAAC images and spectra presented by Pelló et al. (2004) were taken in 2003 February and late June to early July, respectively. The NIRI -band data were collected during two nights in 2004 late May and early June. The -band data discussed here were obtained in 2004 mid-July. Overall, these observations span a period of about a year and a half.
Given the ecliptic latitude of the A1835 field at about 14∘, one hypothesis could be that the source is a solar system object with a large proper motion. The tightest constraint comes from the time over which all of the Pelló et al. (2004) ISAAC -band data were taken. The observations were carried out over 24 hours on 2003 February 15 and 16 and the seeing in the final -band image is . Conservatively, for the source not to appear extended would imply an angular velocity of or . If the source is bound to the Sun and consistent with a distant object like Pluto, for example, with a tangential velocity of , it would lie at more than D=1240 AU. To be unresolved in the 05 -band image at the distance derived from the proper motion limit, the source would have to be smaller than Jupiter diameters. The brightness of an object illuminated by reflected sunlight and assuming an albedo of one, is related to its angular diameter, , by m = m⊙ - 5 log(/2D). From the size calculated above the source would have 55 mag. An object with the magnitude as claimed by Pelló et al. (2004) would have to be a million times larger than what we roughly estimated and thus would violate the size constraint by 6 orders of magnitude. It is possible to relax these constraints by an order of magnitude, but even given more optimistic estimates, a solar system object seems highly unlikely.
It is more difficult to estimate the probably that the source is a high redshift supernova, -ray burst or perhaps something more exotic (e.g., Stern et al., 2004, and references therein). Dahlen et al. (2004) determined a SN rate of about 5.5 10-4 SN yr-1 Mpc-3 at 0.7-0.8 and using a model for the star-formation rate density evolution, they estimate about a factor of 2 increase in the SN rate at z2. The magnitude at which Pelló et al.claim to have detected the source is . It is difficult to know what the redshift of the source might be, especially since the photometry for a transient provides no constraints on the redshift. It is worth noting that distant SNe generally have optical magnitudes fainter than the Pelló et al.detection (e.g., Stolger et al., 2004; Dahlen et al., 2004) and given the relatively blue SED of SNe this means that the candidate would have been one of the brighter SNe (it is of course magnified by an unknown amount which could account for its relative brightness). At any rate, we can estimate the chances of finding a SNe serendipitously in their field. Assuming that the SN was caught within 30 days of its peak, that the redshift range of the SN was 0.5-1.0 (roughly consistent with the range in Dahlen et al., 2004), and that the area in the detection image was 6 arcmin2, we would have expected 0.22 SN in the field based on the Dahlen et al. (2004) SNe rate density. Thus the candidate as an intermediate redshift SN cannot be ruled out. However, this is surely optimistic given the magnitude of the detection claimed in the Pelló et al.-band image and the unknown magnification. Lensing would decrease the probability by decreasing the effective area sampled. Requiring the SN to be observed more closely to its peak in order make detection more likely would (linearly) lower the relative probability of observing it.
Neither of the transient hypotheses can explain the line detection. One would have to postulate that it comes from the host galaxy in the case of a SNe from which there has been no subsequent continuum detection. Given the EW arguments we made previously, this would have to be a very unusual object to escape detection. For a solar system object, the gap between the dates of the imaging and spectroscopy means that the source would have moved a significant distance from the discovery position and not within the subsequent slit spectroscopy. Therefore, none of the possible transient hypotheses explain simply or logically all of the claims in Pelló et al. (2004). Given the -band non-detection of the source down to faint limits by Bremer et al.and now in the V-band, and, the unlikely nature of any galaxy with the properties (lower-limits) observed, it is tempting to conclude that the most likely explanation is that the source is spurious.
References
- Ajiki et al. (2003) Ajiki, M. et al. 2003, AJ, 126, 2091
- Becker et al. (2001) Becker, R. H. et al. 2001, AJ, 122, 2850
- Bertin & Arnouts (1996) Bertin, E., Arnouts, S. 1996, A&AS, 117, 393
- Bouwens et al. (2004) Bouwens, R. J et al. 2004, ApJ, 606, 25
- Bremer et al. (2004a) Bremer, M. N., Lehnert, M. D., Waddington, I., Hardcastle, M. J., Boyce, P. J., & Phillipps, S. 2004a, MNRAS, 347, 7
- Bremer et al. (2004b) Bremer, M. N., Jensen, J., Lehnert, M. D., Förster Schreiber, N., Douglas, L. 2004b, ApJ, 615, L1
- Bunker et al. (2003) Bunker, A. J., Stanway, E. R., Ellis, R. S., McMahon, R. G., & McCarthy, P. J. 2003, MNRAS, 342, 47
- Cen (2003) Cen, R. 2003, ApJ, 591, 12
- Ciardi et al. (2003) Ciardi, B., Ferrara, A., & White, S. D. M. 2003, MNRAS, 344, L7
- Dahlen et al. (2004) Dahlen, T. et al. 2004, ApJ, 613, 189
- Djorgovski et al. (2001) Djorgovski, S. G., Castro, S., Stern, D., & Mahabal, A. A. 2001, ApJ, 560, 5
- Hu et al. (2004) Hu, E. M., Cowie, L. L., Capak, P., McMahon, Richard G., Hayashino, T., & Komiyama, Y. 2004, AJ, 127, 563
- Kneib et al. (2004) Kneib, J.-P., Ellis, R. S., Santos, M. R., & Richard, J. 2004, ApJ, 607, 697
- Kogut et al. (2003) Kogut, A., et al. 2003, ApJS, 148, 161
- Lehnert & Bremer (2003) Lehnert, M. D. & Bremer, M. N. 2003, ApJ, 593, 630
- Madau, Haardt, & Rees (1999) Madau, P., Haardt, F., & Rees, M. J. 1999, ApJ, 514, 648
- Madau et al. (2004) Madau, P., Rees, M. J., Volonteri, M., Haardt, F., & Oh, S. P. 2004, ApJ, 604, 484
- Melnick, Terlevich, & Terlevich (2000) Melnick, J., Terlevich, R., & Terlevich, E. 2000, MNRAS, 311, 629
- Pelló et al. (2004) Pelló, R., Schaerer, D., Richard, J., Le Borgne, J.-F., & Kneib, J.-P. 2004, A&A, 416, 35
- Ricotti & Ostriker (2004) Ricotti, M., & Ostriker, J. P. 2004, MNRAS, 350, 539
- Ricotti et al. (2004) Ricotti, M., Haehnelt, M. G., Pettini, M., & Rees, M. J., 2004, MNRAS, 352, L21
- Rhoads et al. (2003) Rhoads, J. E. et al. 2003, AJ, 125, 1006
- Santos et al. (2004) Santos, M. R., Ellis, R. S., Kneib, J.-P., Richard, J., & Kuijken, K. 2004, ApJ, 606, 683
- Songaila & Cowie (2002) Songaila, A., & Cowie, L. L. 2002, AJ, 123, 2183
- Stanway et al. (2004a) Stanway, E. R., Bunker, A. J., McMahon, R. G., Ellis, R. S., Treu, T., & McCarthy, P. J. 2004, ApJ, 607, 704
- Stanway et al. (2004b) Stanway, E. R. et al. 2004, ApJ, 604, 13
- Steidel et al. (1999) Steidel, C. C., Adelberger, K. L., Giavalisco, M., Dickinson, M., & Pettini, M. 1999, ApJ, 519, 1
- Stern et al. (2004) Stern, D. et al. 2004, ApJ, 612, 690.
- Stolger et al. (2004) Stolger, L.-G., et al. 2004, ApJ, 613, 200
- Sullivan et al. (2000) Sullivan, M., Treyer, M. A., Ellis, R. S., Bridges, T. J. Milliard, B., & Donas, J. 2000, MNRAS, 312, 442
- Treyer et al. (1998) Treyer, M. A., Ellis, R. S., Milliard, Donas, J., & Bridges, T. J. 1998, MNRAS, 300, 303
- Weatherley et al. (2004) Weatherley, S.J., Warren, S.J., Babbedge, T.S.R. 2004, astro-ph/0407150, to appear in A&ALetters
- Wyithe & Loeb (2003) Wyithe, J. S. B., & Loeb, A. 2003, ApJ, 588, L69