SF2A 2004
Rapid variability of the kHz-QPO frequency in 4U 1608-52
Abstract
We investigate the variability of the QPO frequency in 4U 1608-52 on very short time scales of a few seconds. We detect changes in frequency as fast as 0.5 Hz/s, which is more than ten times the fastest change reported for this object. Using a structure function analysis, we are able to detect variability on time scales as short as s. We do not detect any time asymmetry in the QPO-frequency history. These results have important consequences on the measurement of the QPO coherence.
1 Introduction
Fourier analysis has shown that the X-ray emission of low-mass X-ray binaries (LMXBs) often presents characteristic quasi-periodic-oscillation (QPO) peaks at frequencies up to kHz (van der Klis 1989, 2000). The kHz QPOs are of particular interest, as they are a probable signature of physical mechanisms taking place in the inner parts of the accretion disk, where strong-field effects of gravity become important. The physical origin of the QPOs is still a matter of debate, and a detailed understanding of the phenomenon is therefore necessary. Berger et al. (1996) analyzed the variation of the QPO frequency in a Rossi-XTE observation and observed a 40 Hz change in frequency in about 1000 s. They also found evidence for a high QPO coherence of the order of 200. Building upon these results, Barret et al. (2005) (hereafter Paper I) have recently made important progress in the determination of the width of the kHz QPO in 4U 1608-52. In Paper I they found evidence that the variability of the QPO frequency could be quite significant, even on short time scales. In this work, we analyze the temporal properties of the QPO frequency in 4U 1608-52, focussing on the shortest possible time scales allowed by the signal.
2 Data
We use observations of 4U 1608-52 from the Rossi-XTE public archive. These data have already been analyzed in Berger et al. (1996) and Méndez et al. (1998a, 1998b, 1999), as well as in Paper I. We selected seconds from an observation segment of 4U 1608-52 performed on March 3rd, 1996 20:54. This data set has been chosen because the QPO is particularly strong and highly coherent, and its frequency has been found in Paper I to remain in a narrow frequency range.
3 Analysis methods
3.1 Rayleigh’s test as an estimator of the PSD
We consider the individual photons, without building a light curve. The observed signal is therefore a sum of Dirac functions:
| (1) |
where the ’s are the time tags of the individual photons. The Fourier transform and the power-spectrum density (PSD) of this signal can be easily obtained:
| (2) |
This is exactly the expression of Rayleigh’s test (e.g., Fisher 1993). We shall use this expression to estimate the PSD of the light curve of 4U 1608-52, in order to avoid any loss of information due to the binning of the photons.
3.2 QPO-frequency determination
We determine the variation of the QPO frequency using a simple method: We calculate the PSD over time intervals as short as a few seconds, and smooth it using a Gaussian; we then search the maximum of the smoothed PSD. This method has been validated using simulations of a QPO at a known frequency with similar amplitude and width (see Paper I). We find that the accuracy of the QPO frequency determination depends little on the width of the Gaussian, provided that it is significantly wider than the natural resolution of the Fourier transform, i.e. , where is the duration of the time interval. We used a Gaussian with a FWHM of 3 Hz for time intervals from 1 to 10 s.
Statistical fluctuations may sometimes produce spurious peaks which exceed the strength of the QPO. To eliminate these peaks, we first calculate the PSDs from up to Hz over 10s time bins. With such time intervals the measured QPO frequency always fall within a few Hz from the curve determined in Paper I. When we shorten the time bin, spurious peaks appear. To get rid of these peaks, we first restrict the range of investigated frequencies to Hz, and reject QPO-frequency measurements that fall farther than 5 Hz away from the 10s-bin frequency. Using this procedure we eliminate about 2% of the peaks when using 4s bins. This figure increases to 11% for 2s bins, and to 25% for 1s bins.
4 Results
4.1 QPO frequency as a function of time

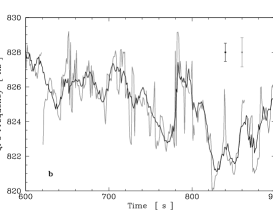
Fig. 1a shows the evolution of the QPO frequency as a function of time, , for the full segment of data analyzed here. The QPO frequency has been determined every 1 second using 10 s time bins. Very rapid changes of frequency as large as 0.5 Hz/s are observed, both towards higher and lower frequencies. A Kolmogorov-Smirnov test on the distributions of the positive and negative frequency changes does not show any evidence of time asymmetry. Fig. 1b zooms in on a portion of the data, on which we superimpose calculated in 10s and 4s bins. While the curves do follow each other quite well, with 4 s bins show much more prominent structures that it seems difficult to ascribe to the increased uncertainties only.
4.2 Time-series properties
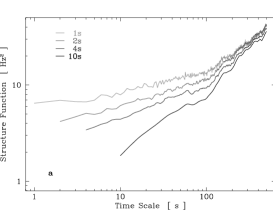
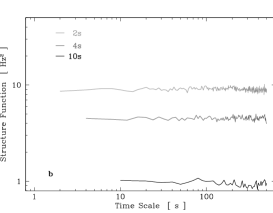
To investigate and quantify the variability of the QPO frequency, we compute the structure functions (SF) of for the data and for simulations. The SF of a time series (e.g., Paltani 1999) measures the amount of variability as a function of the time scale . It is flat for a white-noise-dominated time series. The SF increases with as long as the time series does contain some variability at the corresponding time scale . Fig. 2a shows the SFs of for different time bins. For comparison Fig. 2b shows the same SFs for the simulations. These SFs are dominated by the uncertainty in the frequency determination, which shows that our method does not produce any artefact. For the 4U 1608-52 data, the horizontal part is present in the SF of calculated in 1 s bins only. Changes in the QPO frequency on time scales as short as s are therefore detected. The differences in the SFs are the result of the smoothing and of the decrease in the uncertainty introduced by the use of larger bins.
5 Conclusion
We observe the presence of an erratic variability of the QPO frequency in 4U 1608-52, with evidence of changes in QPO frequency as large as 0.5 Hz/s. This is already more than ten times faster than previously reported by Berger et al. (1996). Faster frequency changes seem present in calculated with shorter time bins. The signal is strong enough, and the method developed here sufficiently accurate, that a minimum variability time scale of s is detected. We did not find any evidence for asymmetry in . These rapid and erratic frequency changes have consequences for the measurement of QPO coherence. A blurring of the QPO profile will indeed take place if too long time bins are used, leading to an underestimation of the true QPO coherence. As discussed in Paper I, the high coherence of the signal places very strong constraints on QPO models. It is therefore important to measure it on very short time scales.
References
- [Barret et al.(2005)Barret, Kluźniak, Olive, Paltani, & Skinner] Barret, D., Kluźniak, W., Olive, J.-F., Paltani, S., & Skinner, G. K. 2005, in press
- [Berger et al.(1996)Berger, van der Klis, van Paradijs, Lewin, Lamb, Vaughan, Kuulkers, Augusteijn, Zhang, Marshall, Swank, Lapidus, Lochner, & Strohmayer] Berger, M., et al. 1996, ApJL, 469, L13
- [Fisher(1993)] Fisher, N. I. 1993, Statistical analysis of circular data (Cambridge: CUP)
- [Méndez et al.(1999)Méndez, van der Klis, Ford, Wijnands, & van Paradijs] Méndez, M., et al. 1999, ApJL, 511, L49
- [Méndez et al.(1998a)Mendez, van der Klis, van Paradijs, Lewin, Vaughan, Kuulkers, Zhang, Lamb, & Psaltis] Méndez, M., et al. 1998a, ApJL, 494, L65
- [Méndez et al.(1998b)Mendez, van der Klis, Wijnands, Ford, van Paradijis, & Vaughan] Méndez, M., et al. 1998b, ApJL, 505, L23
- [Paltani(1999)] Paltani, S. 1999, in ASP Conf. Ser. 159: BL Lac Phenomenon (San Francisco: ASP), 293
- [van der Klis(1989)] van der Klis, M. 1989, ARA&A, 27, 517
- [van der Klis(2000)] van der Klis, M. 2000, ARA&A, 38, 717