Determining the grain composition of the interstellar medium with high resolution X-ray spectroscopy
Abstract
We investigate the ability of high resolution X-ray spectroscopy to directly probe the grain composition of the interstellar medium. Using iron -edge experimental data of likely ISM dust candidates taken at the National Synchrotron Light Source at Brookhaven National Laboratory and the Advanced Photon Source at Argonne National Laboratory, we explore the prospects for determining the chemical composition of astrophysical dust and discuss a technique for doing so. Focusing on the capabilities of the Astro E2 XRS micro-calorimeters, we assess the limiting effects of spectral resolution and noise for detecting significant X-ray absorption fine structure signal in astrophysical environments containing dust. We find that given sufficient signal, the resolution of the XRS will allow us to definitively distinguish gas from dust phase absorption, and certain chemical compositions.
1 Introduction
UV and IR studies have shown that the heavier elements such as C, N, O, Mg, Si, and Fe commonly condense to form solid particles (Draine, 2003; Li & Greenberg, 2003; Whittet, 2003, and references therein for reviews). Combined with planetary studies of meteorites and dust, common forms of interstellar grains include ice (), graphite (C), silicates (; ferrosilicate, ; fayalite, ; enstatite, ; and olivine ), and various iron species (pure Fe; wüstite, FeO; hematite, ; and magnetite, ). UV observational evidence that a fraction of the heavier elements can be found in grains is inferred from the reduction of certain elements from the gas phase, or the depletion factor, defined to be the ratio (in gas-phase abundances) of the amount expectedtomeasured. The presence of grains is also inferred from studies in the radio and optical. IR emission spectra, while able to distinguish some complex molecules through probes of vibrational modes (through excitation of phonons rather than electrons, as e.g. in the X-rays) are limited by the grain types that it can sensitively probe (i.e. mostly polycyclic aromatic hydrocarbon or PAHS, graphites, and certain silicates).
Dust particles smaller than 10 m are partially transparent to X-rays so that the measured absorption in this energy band should be sensitive to all atoms in both gas and solid phase. High resolution X-ray spectroscopy therefore provides a powerful and unique tool for determining the state and composition of the material in the interstellar medium (ISM). For interstellar grains, we would detect oscillatory modulations near the photoelectric absorption edge known as X-ray absorption fine structure (XAFS). The XAFS is a condensed state modulation of the atomic absorption cross-section, thus can distinguish absorption by the gaseous and the condensed states. When a photon excites a deep-core electron into a high-lying, unoccupied electronic state, the wave function of the outwardly propagating photoelectron interferes with the portion that scatters from the surrounding atoms. This interference produces an oscillatory fine structure which is characteristic of the chemical species of the absorber.
The first X-ray study identifying absorption features with the ISM were by Schattenburg & Canizares (1986) with the Einstein Focal Plane Crystal Spectrometer pointings of the Crab Nebula. To date, several ISM studies using highly absorbed bright X-ray binaries with the Chandra HETGS and LETGS in the soft () X-ray have identified absorption features associated with ISM material consisting of atomic and/or molecular forms of oxygen, neon and iron (e.g. Paerels et al., 2001; Takei et al., 2002; Schulz et al., 2002; Juett et al., 2004), but with no definitive indication that the absorption features had to come from grains of specific chemical makeup. Lee et al. (2001, 2002) have claimed direct detections of iron and silicate grains in Chandra studies of several black hole systems in the soft X-rays. In particular, strong modulations in the form of XAFS seen near the Si K edge at keV (6.7Å) led Lee et al. (2002) to conclude that they were associated with silicate grains in the environment of the source or along the line-of-sight. Unfortunately, this was reported only as an exciting possibility of a direct detection of XAFS, as a consequence of the lack of statistics and because there are and polysilicon in the ACIS detectors. Recently, XAFS detection at Si K as well as the K-edges of sulfur and magnesium, attributed to ISM dust have been reported by Ueda et al. (2004) in the spectra of the highly absorbed X-ray binaries GX 13+1, GX 5-1, and GX 340+0, although Schulz (private communication) caution that some of these features may be instrumental in origin. Chandra X-ray spectra have also revealed detailed edge structure at keV near the Fe L photoelectric edge which have been attributed to dust (e.g. Paerels et al. 2001; inferred in Lee et al. 2001).
While progress is continuing in ISM studies using the Chandra gratings in the soft X-ray, we consider study of XAFS in the hard X-ray to be a more promising mechanism for revealing the chemical species of the condensed state material in the ISM. Because our better prospects for X-ray grain studies currently rely on pointings towards bright X-ray binaries (XRBs) with large amounts of absorption, soft X-ray ISM studies often have the added worry of needing to separate any solid state features from the myriad of ionized absorption and/or emission features originating from the XRB environment (e.g. the accretion disk corona or the surrounding ionized plasma). Grain studies in the 7.1 keV (1.75Å) Fe K regime therefore allow a better search for XAFS, due to the reduced number of spectral features from atomic processes in highly ionized plasma occurring in this spectral region. Furthermore, the chemical shift associated with the oxide species is more pronounced for the -edge spectra than for -edge spectra, thus more likely to be resolved using extant instrumentation. In this article, we present -edge XAFS data of various iron compounds taken at the National Synchrotron Light Source (NSLS) at Brookhaven National Laboratory (BNL) and at the Advanced Photon Source (APS) at Argonne National Laboratory (ANL). Using techniques developed for the analysis of synchrotron data, we discuss the prospect of studying the composition of iron grains in the ISM with the XRS calorimeter on Astro E2. Soft X-ray XAFS synchrotron studies, and its relevance to studies using Chandra, XMM-Newton and future X-ray missions will be presented in a later paper.– These measurements, together with the FeK measurements presented in this paper will eventually be jointly analyzed to better constrain the true crystalline structure of the material. Ultimately, combining laboratory and space-based studies of these features as well as combining hard and soft X-ray measurements to compare all available absorption edges in the ISM candidate materials will allow us to investigate the content of the ISM by distinguishing between atomic and condensed state absorption in the spectra from astrophysical sources.
2 The theory behind measuring XAFS
We briefly present theory relevant for the interpretation, processing, and analysis of XAFS data. For detailed discussions of XAFS theory and practice, see e.g. Rehr & Albers (2000), Koningsberger & Prins (1988), Stöhr (1996), and/or Kruegel (2003) and references therein. See also Woo (1995), Woo et al. (1997), and Forrey et al. (1998) for early discussions of XAFS in the context of astrophysical grains.
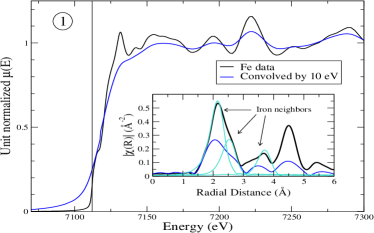
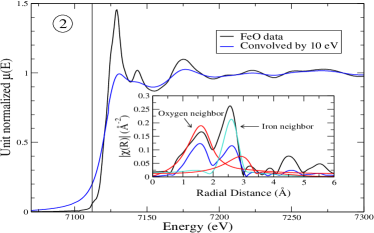
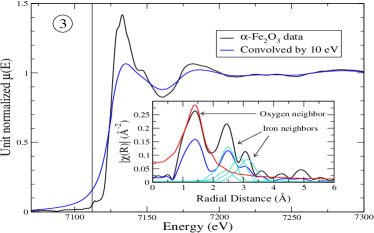
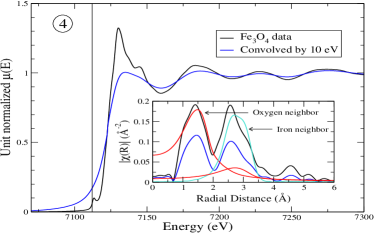
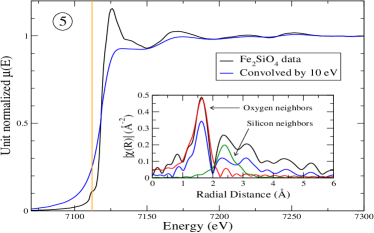
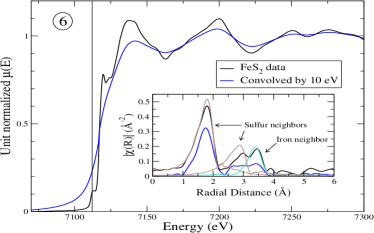
Measured XAFS spectra for various iron species are shown in the Appendix, § 5. The sharp rise in the absorption cross section, also called the edge step, occurs when the incident photon is equal to the binding energy of the deep-core electron. The cross section, , is typically expressed as
| (1) |
where is the cross section of the isolated atom and is the oscillatory modulation of the cross section due to the interaction of the ejected photoelectron with the condensed state material. The features within a few electron volts of the edge are called the near-edge structure. The extended X-ray absorption fine structure (EXAFS) extends from a few tens to many hundreds of eV above the edge.
The oscillatory portion of Eq. 1, , is determined by the local-scale atomic structure in the vicinity of the absorbing atom, thus the absorption spectrum is highly sensitive to the chemical species of the absorber. This dependence is seen in the equation for the oscillatory fine structure in the single scattering approximation:
| (2) |
In this equation, the summation is over all atoms surrounding the absorber, and are the amplitude and phase of the function describing the scattering of a photoelectron from neighboring atom , and are the distance between absorber and scatterer and the thermal RMS variation in that distance, is an element-specific, intrinsic loss term (Rehr & Albers, 2000), is the mean free path of the photoelectron, and — the wavenumber of the photoelectron — is related to the energy by . The mean free path, the dependence, and the Debye-Waller-like term together serve to limit the spatial extent probed by the photoelectron. XAFS is, therefore, an inherently local probe which measures structure within 10 Å or less of the absorbing atom.
As a heuristic explanation of Eq. (2), consider the outwardly propagating photoelectron. This propagates as a spherical wave and scatters from the surrounding atoms. (See, for example, Figure 5 in Rehr & Albers 2000.) This backscattered wave interferes with the outwardly propagating photoelectron. The density of states of the absorber is modulated by this interference function measured at the position of the absorber. This modulation is, according to Eq. (2), a sum of damped sine waves in photoelectron wavenumber.
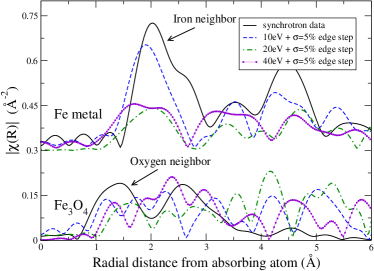
The frequencies of these sine waves are a measure of the distances to the scatterers, as given by the term. The in the numerator of the pre-factor depends upon the atomic species of the scatterer. The oscillatory fine structure function of the EXAFS, is isolated (Newville et al., 1993) by fitting a smooth spline representing the atomic contribution to the cross section such that the low-frequency Fourier components are removed from the spectrum. The resulting can be Fourier transformed (Koningsberger & Prins, 1988) to produce a complex function related to the partial pair radial distribution function of atoms about the absorber. Examples of the Fourier transform functions are shown for various iron compounds in the Appendix, §5.
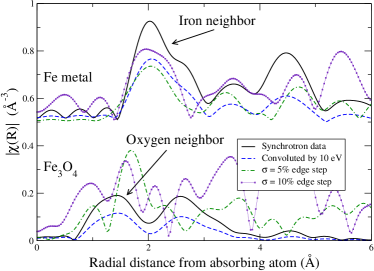
With the aid of theory (Zabinsky et al., 1995; Ankudinov et al., 1998), the spectra can be analyzed (Newville, 2001) to reveal the details of the local environment about the absorber, including the atomic species of and distance to the near neighbors. Eq. (2) is evaluated for each kind of scatterer in the material. The contributions from the scatterers considered in the analysis are summed and then Fourier transformed. The Fourier transform of this theoretical is compared to the Fourier transform of the data. The parametric terms in Eq. (2), such as and , are modified by non-linear minimization techniques to best fit the theory to the data (e.g. Newville et al., 1995). The Fourier transform is a complex transform, thus this minimization is made by comparing both the real and imaginary parts of the transforms of the theoretical and measured spectra. A fit to measured data is, therefore, a balance of contributions from various scatterers which have subtle amplitude and phase relationships. In §5, the magnitudes of the Fourier transforms of data from several iron compounds are plotted along with the magnitudes of the Fourier transforms of the fitted contributions from various near-neighbor atoms.
Both the near-edge and the extended spectra can be used to identify the chemical species of the absorber. The features of the near-edge structure of metallic and oxidic iron are distinct. Also the energy of the onset of the oxide edge is shifted by eV relative to the metal. In the case of the metallic iron and magnetite comparison considered in §3, the nearest neighbor in the metal is another iron atom at a distance of about 2.5 Å while in magnetite the nearest neighbor is oxygen at about 1.9 Å. These differences in distance and species of the near neighbor in the various iron species are readily apparent in the analysis of the EXAFS spectra, as seen in the Appendix, §5. For satellite spectra, we intend to use similar techniques to identify the chemical species of grains in the ISM.
3 Can we measure XAFS with Astro E2 ?
In order to investigate the limiting effects of noise (§3.2) and spectral resolution (§3.3) for detecting an XAFS signal from satellite measurements, we have made synchrotron XAFS measurements of various Fe compounds, including metallic Fe, FeO (wüstite), Fe2O3 (hematite), Fe3O4 (magnetite), Fe2SiO4 (fayalite), and FeS2 (pyrite). In the Appendix (§5; Figs. 3) we show the measured absorption spectra of each of these iron species along with the spectra convolved by 10 eV to simulate the approximate resolution111http://heasarc.gsfc.nasa.gov/docs/astroe/gallery/performance/specres.html of the Astro E2 instrument. The inset to each figure shows the Fourier transform of the isolated fine structure spectra. We see that the XAFS data contain ample information which can be used to distinguish different iron species, including the chemical shift of the onset of the edge, the features in the near-edge structure, and the details of the Fourier transformed fine structure. For the purpose of assessing the feasibility of detailed composition studies of dust with Astro E2, we limit our detailed discussion to a comparison of Fe metal with magnetite Fe3O4. Our conclusions, however, are applicable to all iron compounds in the vicinity of the Fe edge near 7.1 keV.
3.1 The synchrotron experiment
The data presented in this paper were measured at beamline X11A at NSLS or at beamline 13BM at the APS. X11A is a bending magnet beamline with a double crystal Si(111) monochromator with energy resolution of about 2x10. Adequate harmonic rejection was accomplished by detuning the second crystal to attenuate the incident intensity by about 30%. 13BM was operated in a substantively similar mode. The measured samples were a 12 m iron foil and a fine powder of Fe3O4 dispersed within a quantity of boron nitride and cold pressed into a pellet. Both samples were optimized (Lu & Stern, 1983; Stern & Kim, 1981) for high-quality transmission mode (Koningsberger & Prins, 1988) measurement. The incident and transmitted beam intensities were measured by ionization chambers filled with appropriate mixtures of inert gases and operated in a stable voltage regime.
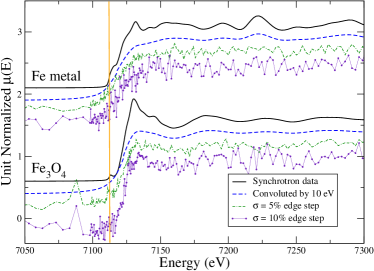
The synchrotron data were processed using the athena program (Ravel & Newville, 2004). Energy calibration was done using a reference Fe foil measured in parallel during the magnetite measurement. Normalization was performed in the standard fashion (Koningsberger & Prins, 1988), i.e. by regressing a two-term polynomial to the region before the pre-edge and subtracting it from the entire spectrum. A three-term polynomial was regressed to a region beyond the absorption edge. The value of the post-edge polynomial extrapolated back to the edge energy was used as the normalization constant. The athena program was also used to simulate the effects of noise and energy resolution discussed below. Noise was added to the spectra using a pseudo-random number generator. The RMS value of the noise is given as a percentage of the edge step, i.e. the normalization constant derived from the polynomial regressions. Thus a 10% level of noise is understood as having an RMS value of 0.1 on the scale of the normalized spectra shown in Figs.1 and 2. The effect of resolution was simulated by convolving the measured spectra with a Lorentzian of a given width.
3.2 The limiting effects of noise
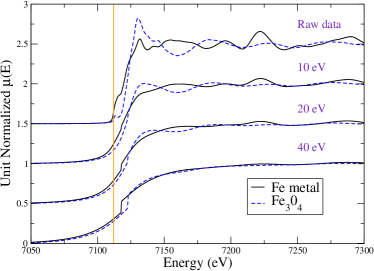
At the spectral resolution of the Astro E2 XRS, noise will be the most significant impediment to our ability to speciate interstellar grains. To demonstrate, we investigate the tolerable noise level by adding random fluctuations to our synchrotron data at the level of 5–10% as described in § 3.1. As seen from Fig. 1, a S/N 10 (or noise 10%) is required to distinguish Fe-rich material in gas versus the solid state form to enable a direct measurement of the gas-to-dust ratio in a target absorption column. At this level, if no XAFS are detected, we would conclude that the cloud is predominantly gas phase.
However, should a given environment be predominantly dust, as expected e.g. along the line-of-sight passing through some molecular cloud, we would like to be able to distinguish the chemical species of the condensed state of the absorber. In the comparison of XAFS from iron metal versus an oxidic form of iron, Fig. 1 shows that while Fe metal can still be distinguishable at the approximate XRS resolution of 10 eV with a relatively high (10%) level of noise, a 5% noise leaves the oxide unrecognizable. Since iron oxides are more likely candidates for ISM grains, S/N considerations should be one of the most important factors when estimating adequate exposures times.
Readers should also take caution, when making analogies with astrophysical environments that the numbers given above are calculated assuming material in purely solid form. As such, when considering astrophysical environments – the dust contribution to the overall optical depth of the edge should be accounted for and the numbers given scaled accordingly. To illustrate, the required S/N 10 value quoted above would translate to a required S/N 33 (i.e. noise 3%) for a pointed observation of the diffuse ISM where the dust:to:gas ratio is % (e.g. Wilms et al., 2000). Molecular clouds should be better targets for XAFS studies given the expected higher dust content.
3.3 The limiting effects of spectral resolution
We next convolve our synchrotron data of Fe metal and Fe3O4 with Lorentzians to simulate different instrumental resolutions and find that, to do studies of XAFS at keV Fe K, a spectral resolution of 10 eV or less (as only currently possible with the Astro E2 XRS) is required to extract the X-ray absorption fine structure information to deduce the chemical make-up of the absorber. As demonstrated in Fig. 2, 20 eV resolution with moderate (5%) noise is still adequate for identifying metallic iron, but insufficient for distinguishing any kinds of oxides. Simulated spectra using the Astro E2 XRS response matrix further show that binning the data to increase S/N is unfortunately not an option. A doubling of the S/N would require that we bin the data by a factor of 4 (i.e. ) implying a 40 eV resolution – at this resolution, even the high S/N synchrotron spectra of the different compounds become nearly indistinguishable and vastly more sensitive to noise (Fig. 2 left).
4 Conclusion
The unsurpassed spectral resolution of the Astro E2 XRS in the 7.1 keV K-edge region of iron and nickel will allow the first detailed study of interstellar grains via analysis of X-ray Absorption Fine Structure (XAFS). Given data with sufficiently high , the extended portion of the K-edge spectrum can be analyzed to reveal information about the chemical species of the material in the ISM. As demonstrated here, the spectral resolution of Astro E2 will allow us to (1) definitively separate dust from gas phase absorption, and (2) give us good expectations for being able to directly determine the chemical composition of dust grains containing iron.
We note that, while XAFS theory is quite mature, the study of XAFS is still largely empirical. As such, the success of such a study will require that space-based measurements (e.g. with the Astro-E2 XRS) be compared with empirical XAFS data taken at synchrotron beamlines to determine the exact chemical state of the astrophysical dust. Because determining the content of the ISM has important consequences for understanding the evolution of the Universe, and X-rays are a powerful tool for ensuring the success of such a study, spectral resolution and area should remain an important consideration of future X-ray missions.
acknowledgements
We thank M. Newville for kindly supplying some of the data shown in this paper. JCL thanks and acknowledges support from the Chandra fellowship grant PF2–30023 this is issued by the Chandra X-ray Observatory Center, which is operated by SAO for and on behalf of NASA under contract NAS8–39073. JCL is also grateful to Professor Claude Canizares for providing the freedom and type of atmosphere that encourages the development of independent ideas throughout her years with his group at MIT.
References
- Ankudinov et al. (1998) Ankudinov, A. L., Ravel, B., Rehr, J. J., & Conradson, S. D. 1998, Phys. Rev. B, 58, 7565
- Draine (2003) Draine, B. T. 2003, ARAA, 41, 241
- Forrey et al. (1998) Forrey, R. C., Woo, J. W., & Cho, K. 1998, ApJ, 505, 236
- Juett et al. (2004) Juett, A. M., Schulz, N. S., & Chakrabarty, D. 2004, ApJ,
- Koningsberger & Prins (1988) Koningsberger, D. C. & Prins, R. 1988, X-ray Absorption: Principles, Applications, Techniques of EXAFS, SEXAFS, and XANES; Editors Koningsberger & Prins (John Wiley & Sons)
- Kruegel (2003) Kruegel, E. 2003, The physics of interstellar dust (The physics of interstellar dust, by Endrik Kruegel. IoP Series in astronomy and astrophysics, ISBN 0750308613. Bristol, UK: The Institute of Physics, 2003.)
- Lee et al. (2001) Lee, J. C., Ogle, P. M., Canizares, C. R., Marshall, H. L., Schulz, N. S., Morales, R., Fabian, A. C., & Iwasawa, K. 2001, ApJ, 554, L13
- Lee et al. (2002) Lee, J. C., Reynolds, C. S., Remillard, R., Schulz, N. S., Blackman, E. G., & Fabian, A. C. 2002, ApJ, 567, 1102
- Li & Greenberg (2003) Li, A. & Greenberg, J. M. 2003, in Solid State Astrochemistry, 37–84
- Lu & Stern (1983) Lu, K. Q. & Stern, E. A. 1983, Nuc. Inst. Meth., 212, 475
- Newville et al. (1993) M. Newville, P. Līviņš, Y. Yacoby, J. J. Rehr, & E. A. Stern 1993, Phys. Rev. B, 47, 14126
- Newville (2001) Newville, M. 2001, J. Synchrotron Radiat., 8, 322
- Newville et al. (1995) Newville, M., Ravel, B., Haskel, D., Rehr, J. J., Stern, E. A., & Yacoby, Y. 1995, Physica B, 208&209, 154
- Paerels et al. (2001) Paerels, F., et al. 2001, ApJ, 546, 338
- Ravel & Newville (2004) Ravel, B. & Newville, M. 2004, athena and artemis: Interactive graphical data analysis using ifeffit, to be published in Physica Scripta
- Rehr & Albers (2000) Rehr, J. J. & Albers, R. C. 2000, Rev. Mod. Phys., 73, 621
- Schattenburg & Canizares (1986) Schattenburg, M. L. & Canizares, C. R. 1986, ApJ, 301, 759
- Schulz et al. (2002) Schulz, N. S., Cui, W., Canizares, C. R., Marshall, H. L., Lee, J. C., Miller, J. M., & Lewin, W. H. G. 2002, ApJ, 565, 1141
- Stern & Kim (1981) Stern, E. A. & Kim, K. 1981, Phys. Rev. B, 23, 3781
- Stöhr (1996) Stöhr, J. 1996, NEXAFS Spectroscopy (Springer Series in Surface Sciences)
- Takei et al. (2002) Takei, Y., Fujimoto, R., Mitsuda, K., & Onaka, T. 2002, ApJ, 581, 307
- Ueda et al. (2004) Ueda, Y., Mitsuda, K., Murakami, H., & Matsushita, K. 2004, ArXiv Astrophysics e-prints, astro-ph/0410655
- Whittet (2003) Whittet, D. C. B. 2003, Dust in the Galactic Environment (first edition 1992) (IOP Publishing Ltd)
- Wilms et al. (2000) Wilms, J., Allen, A., & McCray, R. 2000, ApJ, 542, 914
- Woo (1995) Woo, J. W. 1995, ApJ, 447, L129+
- Woo et al. (1997) Woo, J. W., Forrey, R. C., & Cho, K. 1997, ApJ, 477, 235
- Zabinsky et al. (1995) Zabinsky, S. I., Rehr, J. J., Ankudinov, A., Albers, R. C., & Eller, M. J. 1995, Phys. Rev. B, 52, 2995
5 Appendix: XAFS of iron compounds