The Absorption Signature of Six Mgii–Selected Systems Over 11affiliation: Based in part on observations obtained at the W. M. Keck Observatory, which is operated as a scientific partnership among Caltech, the University of California, and NASA. The Observatory was made possible by the generous financial support of the W. M. Keck Foundation. 22affiliation: Based in part on observations obtained with the NASA/ESA Hubble Space Telescope, which is operated by the STScI for the Association of Universities for Research in Astronomy, Inc., under NASA contract NAS5–26555.
Abstract
We present the following results of photoionization modeling of six Mgii–selected absorption systems, at redshift , along lines of sight toward three quasars: PG , PG , and PG . These are part of a larger sample of Mgii absorbers at intermediate redshift, that facilitates a survey of the properties of, and processes active in, the multiple phases of gas, both in and outside of galaxies. We present new high resolution ultraviolet spectra from HST/STIS as well as high resolution optical spectra obtained with HIRES/Keck. Together, these spectra allow simultaneous study of a variety of ionization states of different chemical elements, with resolution of the kinematics providing strong constraints on multiphase properties. The six systems presented here include several that are likely to arise from lines of sight through disk and halo structures of spiral galaxies. For these we find that the high ionization gas, traced by Civ is consistent with coronal structures that resemble that of the Milky Way, along with high velocity clouds at – km s-1. Another system has relatively weak Civ, relative to the low ionization absorption, which leads to a discussion of the circumstances in which a corona might be weak or absent in a galaxy, i.e. an early–type morphology or low star formation rate. Finally, we present systems that are examples of single–cloud and multiple–cloud weak Mgii absorbers, which are as a class not likely to be within kpc of luminous galaxies. Based the physical conditions inferred from models, we discuss the nature of these types of systems, which may trace outer regions of galaxies, dwarf galaxy satellites, or metal–rich regions of the intergalactic medium.
1 Introduction
Absorption lines due to many different chemical transitions are produced in quasar spectra, due to intervening absorption systems. These systems are sampled by quasar lines of sight through galaxies and through intergalactic gas clouds. The absorption line spectra provide an opportunity to sample many different types of structures within and around galaxies. Many of the structures that are sampled, particularly at high redshift, emit very little, if any, light. Nonetheless, quasar absorption lines provide a way to study detailed properties of both visible and invisible absorbing structures. The kinematics, chemical composition and ionization states of absorption systems reveal multi-phase media (Giroux, Sutherland, & Shull, 1994; Ding et al., 2003b, a; Charlton et al., 2003).
A detailed study of the properties of gaseous phases, with a range of densities from cm-3 to cm-3 samples environments from the diffuse halo gas bridging galaxies to intergalactic medium to the dense regions in galaxies where stars are forming. It is valuable to place a quasar absorption line of sight in the context of the morphology of the galaxy through which it passes. However, the essence of quasar absorption line studies is to focus on the properties of the absorbing gas. This is because many of the types of environments we are studying through the absorption lines will not be detected through emission, particularly at high redshift. Ultimately, large numbers lines of sight through galaxies, protogalaxies, galactic environments, and intergalactic regions from redshifts to will provide detailed evolutionary information about physical conditions.
Historically, Mgii absorption systems have been classified as “strong” or “weak”, divided by an rest frame equivalent width cutoff at Å. Although this division was due primarily to the sensitivity of the previous generation of quasar absorption line surveys (Steidel & Sargent, 1992), it does apparently have some physical significance, at least roughly. Strong Mgii absorbers are nearly always found within an impact parameter of kpc of a luminous galaxy (, where is the Schechter luminosity) (Bergeron & Boissé, 1991; Bergeron et al., 1992; Le Brun et al., 1993; Steidel, Dickinson, & Persson, 1994; Steidel, 1995; Steidel et al., 1997). Strong Mgii absorbers at redshifts to are therefore likely candidates for predecessors of present–day giant spiral and elliptical galaxies.
In contrast, weak Mgii absorbers (those with Å) do not usually have a luminous galaxy within a kpc impact parameter (Rigby et al. (2002) and references therein). Despite this, many of these weak Mgii absorbers have a relatively high metallicity (Rigby et al., 2002; Charlton et al., 2003), so they can be used to trace metal production in intergalactic space and/or in dwarf and low–surface–brightness galaxies. Therefore, they are of great significance in the search for elusive types of star–forming environments.
This paper presents the derived properties of the multiple phases of gas in six Mgii absorption systems at along the lines of sight toward three quasars. Three of these six systems are strong Mgii absorbers and the other three are weak Mgii absorbers. These six systems at part of a larger study of Mgii absorbers toward seven quasars for which high resolution spectra were available both in the ultraviolet and optical. This facilitates coverage of many different chemical transitions for systems at , the redshift range which is the focus of our study. Our previous papers apply the same modeling techniques and solve for the physical properties of the multiple phases of gas in other Mgii absorption line systems (Ding et al., 2003a, b; Charlton et al., 2003; Zonak et al., 2004; Masiero et al., 2004).
As would be expected, there are a variety of absorption properties even among strong or weak Mgii absorption systems. This indicates a range of physical conditions along different lines of sight. This is in part due to differences between different morphological types of galaxies, but it is also largely due to stochastic variations from place to place within galaxies and to evolutionary differences between different regions. Because of the variety, it is illuminating to further classify Mgii systems according to their absorption properties in order to understand the common processes that may be involved. It is appropriate to focus on absorption properties rather than the morphology of the host galaxy for several reasons: 1) Sometimes galaxy morphology information is unavailable, especially at high redshift; 2) Much is to be learned by studying gas in the universe that is not directly related to luminous galaxies, particularly gas in dwarf galaxies or protogalaxies; 3) The properties of the gas are crucial for an understanding of processes (e.g., star formation, supershells, superbubbles) that occur globally in many different types of galaxies and environments.
Churchill et al. (2000) developed a classification system for Mgii absorbers, based on a multi–variate analysis using equivalent widths of Civ, Mgii, Feii, and Ly, and the kinematic spread of a high resolution Mgii profile as defining properties. The classes of absorbers discussed in their paper were ”classic”, ”Civ–deficient”, ”single/weak”, ”double”, and ”damped Ly/Hi–rich. Classic absorbers have strong Mgii absorption, with profiles consistent with disk/halo kinematics (a dominant component and “satellite” clouds), and equally strong Civ absorption. It has been suggested that much of the Civ absorption is due to a diffuse phase that is analogous to the Galactic corona (Churchill et al., 1999, 2000). The Civ–deficient absorbers have Civ absorption that is weak compared to Mgii and they seem to have red galaxy hosts (Churchill et al., 2000), perhaps suggesting that a corona is absent in these cases. Single/weak absorbers have weak absorption in all transitions, including Mgii with Å and usually with Å. Double absorbers have Civ, Mgii, Feii, and Ly with double the equivalent width of classic absorbers, such as would be expected from lines of sight through galaxy pairs (Churchill et al., 2000; Ding et al., 2003b). Finally, damped Ly/Hi–rich absorbers have Mgii and Ly that is double that of the classics, but Civ that is similar to the classics.
These five classes do not connect directly to particular morphological classes of galaxies, although there may in some cases be correlations. In some cases they do seem to connect to processes and types of structures, e.g. the absence of a corona may lead to a Civ–deficient absorber, a pair of galaxies to a double absorber, and a high density environment near a star forming region to a damped Ly/Hi–rich absorber. The goal of this work is to learn more about the specific processes involved in producing the various absorption signature, in order to ultimately draw more general conclusions about evolution.
Among the six absorbers modeled in this paper, there are single/weak absorbers, classic absorbers, and Civ–deficient absorbers. The system toward PG is a single–cloud, weak Mgii absorber, and its metallicity and multi–phase properties will be compared to the three single–cloud, weak Mgii absorbers toward PG for which the metallicity is near solar and a separate Civ phase is clearly present. The system toward PG is also classified as single–weak by the multi–variate analysis of Churchill et al. (2000), but it has several blended components in Mgii and is similar to the system toward PG that Zonak et al. (2004) hypothesized to be a pair of dwarf galaxies or a superwind. The three classic absorbers presented in this paper (the system toward PG and the and systems toward PG ) have kinematically similar Mgii, a dominant component with “satellite absorption” reminiscent of Milky Way high velocity clouds. The latter two systems have galaxy candidates at impact parameters of and kpc, and the former is known to be a spiral (Churchill et al., 1996). In our discussion of modeling results for these three “classic” systems we will focus on the distribution of Civ in these absorbers, relative to the low ionization gas, considering its relevance for understanding coronae and high velocity clouds. Finally, the absorber toward PG is an example of a Civ–deficient absorber. It does have a host galaxy candidate, but at a surprisingly large impact parameter of kpc (Steidel et al., 2002). The discussion in this papers will focus on the issues relevant to these systems, with comparison to other similar systems modeled previously.
2 Data Analysis
2.1 Absorption Spectra
We have included the spectroscopic observations toward three quasars (PG , PG , and PG ). A combination of optical and ultraviolet spectra were used to study the six absorption systems detected along these lines of sight. The UV spectra were obtained with one of the primary tilts of the EM grating of the Hubble Space Telescope (HST) / Space Telescope Imaging Spectrograph (STIS). It has a wavelength coverage from Å to Å and a resolution of (FWHM km s-1). The optical spectra were obtained from High Resolution Spectrograph (HIRES) on the Keck I telescope in January 1995, with a resolution of (FWHM km s-1). Quasars, observing dates, wavelength coverages, and total exposure times are listed in Table 1 for both HST/STIS and Keck/HIRES observations.
The six systems discussed in this paper all have the low–ionization transitions Mgi, Mgii, and Feii covered in the Keck/HIRES spectra. For the system at toward PG , Caii was also covered by HIRES. The Civ profiles of all six system are covered in the HST/STIS spectra. The systems at toward PG and toward PG also have Nv covered by STIS, and four of the systems have Siiv covered. However, only the system at toward PG has spectral coverage for the Ly absorption.
The HST/STIS spectra were reduced using the standard pipeline (Brown et al., 2002) and combined and continuum fit using standard IRAF tasks (Churchill & Vogt, 2001). The HIRES spectra were reduced with the IRAF APEXTRACT package for echelle data and were extracted using the optimal extraction routine of Henry (1986) and Marsh (1989). The wavelengths were calibrated to vacuum using the IRAF task ECIDENTIFY, and shifted to heliocentric velocities.
2.2 Galaxy Properties
Three of the six absorbers have confirmed identification of host galaxies. As summarized in Churchill et al. (1996), the system toward PG and the system at toward PG have confirmed host galaxies at their redshifts. The rest–frame B and K magnitudes were determined using a combination of broadband g (/), R (/), i (/), and HST/NICMOS images of the individual quasar field. The details of imaging and follow–up spectroscopic observations are described in Steidel, Dickinson, & Persson (1994) and Steidel & Dickinson (1995). Another system at also has a galaxy detected at an impact parameter of kpc. This galaxy counterpart, which is morphologically a spiral, was detected in the HST/WFPC2 FW image of the PG field (Steidel et al., 2002). Magnitudes, impact parameters, and galaxy colors are listed in Table 2.
3 Modeling Techniques
The goal of our study is to place constraints on the physical properties of the gas that is responsible for the absorption observed in the individual systems. For each system, a Voigt profile fit was performed on the Mgii , doublet. The program MINFIT, which uses a formalism, finds the minimum number of components required to fit the doublet and obtains their redshifts, column densities, and Doppler parameters (Churchill, 1997). With the assumption that each component is produced by an individual “cloud”, the photoionization code Cloudy, version 94.0 (Ferland, 2001), is run to model individual clouds. Details of the modeling method are also described in Ding et al. (2003a) and Ding et al. (2003b).
For each cloud, we consider a range of metallicities and ionization parameters. Cloudy runs to constrain the low–ionization phase are optimized on the measured Mgii column density. We started with a QSO–only spectrum (Haardt & Madau, 1996) as the ionizing background. An alternative input spectrum, with the inclusion of an estimated contribution from star–forming galaxies, was also explored for each system. The photon escape fraction from star–forming galaxies is at (Haardt & Madau, 2001). A solar abundance pattern was initially assumed, with adjustment made later, if necessary. For each set of trial metallicity and ionization parameter, a “model” spectrum is produced for each transition and is then convolved with an instrumental spread function to generate a synthetic spectrum. This synthetic spectrum is then superimposed on the observed spectrum for comparison.
In many cases, the Mgii clouds can account for only a small fraction of the absorption seen in the high–ionization transitions, such as Siiv, Civ, and Nv. Thus, an additional diffuse phase is required to give rise to these transitions. A Voigt profile fit to the Civ doublet was usually performed to obtain redshift, column density, and Doppler parameter for each needed high–ionization cloud. In cases where Civ is saturated or contaminated by absorption from other transitions, either the Siiv doublet or the Nv doublet was used instead. Based on the fitting results optimizing on the measured transition, Cloudy (Ferland, 2001) was run again to constrain the metallicity and ionization parameter of the high–ionization phase. For the high–ionization phase, both photoionization and collisional ionization are considered as the possible ionizing mechanisms. For collisional ionization, the temperature in the absorbing gas (higher than the equilibrium temperature, e.g. due to shock heating) is specified in addition to the ionization parameter in the Cloudy code. By following a series of procedures similar to those described for the Mgii phase, we obtain synthetic spectra for the high–ionization phase.
By constraining metallicity, ionization parameter, and/or kinetic temperature (for collisional ionization), we try to obtain the minimum number of phases (i.e. groups of gaseous clouds with similar densities and temperatures) that are required to reproduce the observed spectrum for various transitions. Alternative spectral shapes and abundance patterns are also explored, as mentioned earlier.
4 Modeling Results and Discussion
Modeling results, with ranges of acceptable parameters, are presented here for each of the six individual systems. Figures 1 through 6 show the examples of “best models” superimposed on the observed spectra. Physical parameters of the plotted models are listed in Tables 4–9. For each system, the presentation of results is followed by a discussion of the implications.
4.1 The System Toward PG
4.1.1 Results
As shown in Figure 1, the system at is a single–cloud, weak Mgii system. In addition to the weak Mgii doublet, other metal transitions covered in the HST/STIS spectrum, such as Siiii, Siiv, and Civ, also do not display a multi–component structure in their profiles. These transitions, all with a narrow, spiky profile shape, are aligned with each other in velocity space. However, the velocity centroid of the strongest absorption of these transitions is slightly offset from that of the Mgii cloud.
A Voigt profile fit to the Mgii doublet yields a single component at z=, with a column density of and Doppler parameter of km s-1. A Voigt profile fit to the Civ doublet yields a single component at z=, a lower redshift than that of the Mgii cloud, equivalent to km s-1 to the blue. This offset in velocity is unlikely to result from wavelength calibration, because it is not present in the systems at and toward the same quasar (see Figures 2 and 3). However, the HST/STIS spectrum is fairly noisy, especially in the regions Siii, Siiii, Siiv, and Nv, which makes it possible that we should disregard the small velocity offset between the Mgii and Civ doublets. Therefore, both a one–phase scenario (which assumes Mgii and Civ are produced in the same gas despite the apparent velocity offset) and a two–phase scenario (which assumes two separate phases) are explored. Relevant parameters of both models are listed in Table 4.
In the one–phase scenario, the cloud redshift is set to z=, where the strongest absorption in Siiii, Siiv, and Civ occurs. This is also consistent with the minimum of the broad Ly profile, which is centered on the other transitions covered in the HST/STIS spectrum, but not with the strongest Mgii absorption. A profile fit to the Civ doublet yields a column density of and Doppler parameter of km s-1. A solar abundance pattern and a QSO–only input spectrum are initially assumed, with the alternative input spectrum explored later. The ionization parameter of this cloud is stringently constrained to be (within a dex of uncertainty), by the observed ratio of / (assuming they are produced in the same cloud despite the apparent velocity offset). A model with this ionization parameter also gives rise to the absorption consistent with the observed Siiii and Siiv . It does not overproduce Nv, which is not detected in the spectrum. In Figure 1, it is shown that Siiv is blended (possibly with Ly from a system at ) and the spectrum quality is low for Siii . Therefore, the model fit to these two transitions is not considered. At this ionization parameter, the metallicity is equally well constrained to be (within dex of uncertainty), by the shape of the Ly profile (assuming that only this one cloud is responsible for the full Ly absorption). The corresponding cloud size is kpc.
An alternative is a two–phase model in which the gas that produces the majority of the Mgii absorption is separate from the gas that gives rise to the other metal transitions. The results of the Voigt profile fits to Mgii and to Civ (separately) are used to set redshifts and optimizing column densities for the two clouds. The cloud centered on Mgii (the Mgii cloud hereafter) is required to have an upper limit of so that it does not give rise to Civ. For the cloud centered on Civ (the Civ cloud hereafter), a lower limit of is placed on the ionization parameter, under the assumption that this cloud does not produce a significant amount of Mgii at this offset velocity. An upper limit of applies so that Nv is not overproduced. The Civ cloud also dominates the production of Ly and its metallicity is determined to be . A higher metallicity cannot fit the blue wing of Ly while a significantly lower metallicity would cause the cloud to be Jeans unstable. The ionization parameter and metallicity of the Civ cloud in this two–phase model do not differ significantly from what is derived for the one–phase model. However, if the Mgii and Civ clouds in this two–phase model are not assumed to have the same metallicity, then it is plausible for the Mgii cloud to have a much higher (e.g. even super–solar) metallicity.
The alternative input spectrum, with the inclusion of stellar contribution from galaxies in addition to the radiation from background quasars (Haardt & Madau, 2001), is explored for both models. The ionization parameter of the Civ cloud in both cases would need to be increased by dex so as not to overproduce low–ionization transitions, Mgii in particular. The need for an increase of ionization parameter results from the sharp decrease in the number of photons between – Ryd in the stellar spectrum as compared to the QSO–only contribution. Given that the ionization energy from Ciii to Civ is eV, it follows that less Civ would be produced from a lower–ionization state. In other words, a larger fraction of metals will be in a lower–ionization state. Therefore, in order not to overproduce the low–ionization transitions, a higher ionization parameter () would be required. For the Mgii cloud in the two–phase model, the change resulting from the background radiation is negligible due to the weak absorption.
4.1.2 Discussion
Weak Mgii absorbers (Mgii systems with Å) comprise at least two thirds of all Mgii absorbers. Among the weak Mgii absorber population, about two thirds have only a single, narrow Mgii cloud. The single–cloud, weak Mgii systems usually have a more highly ionized, diffuse component producing absorption at the same velocity of the low–ionization Mgii cloud.
The system at is a single–cloud, weak Mgii absorber. It has such weak Mgii absorption ( Å) that it is among the weakest detected (Churchill et al., 1999). This system is also unusual in that the Mgii absorption appears to be slightly offset in velocity from the other detected transitions, such as Siiv and Civ. Both one–phase and two–phase models could be compatible depending on whether this apparent offset is considered significant.
A study of 15 single–cloud, weak Mgii absorbers at in Rigby et al. (2002) found that at least half of them contain two or more ionization phases of gas (and in the others the constraint was not available). In these multi–phase absorbers, the high–ionization phase which produces the Civ absorption also contributes substantially to the Ly equivalent width. This is consistent with what we found for our two–phase scenario, in which the low–ionization gas only accounts for Mgii, but not significantly for any other transitions. In addition, both the results from Rigby et al. (2002), based on low–resolution HST/FOS spectra (), and a more recent study by Charlton et al. (2003) of the three single–cloud, weak Mgii absorbers toward PG using high–resolution HST/STIS spectra, found that many single–cloud, weak Mgii absorbers have near–solar or even super–solar metallicity. These systems apparently probe metal–enriched pockets and hence potentially trace enriched regions in the intergalactic medium or in dwarf galaxies. For our two–phase model, though the high–ionization Civ cloud is required to have a relatively low metallicity ( solar), the metallicity of the Mgii cloud is largely unconstrained. It is possible that this system is of quite low metallicity compared to most single–cloud, weak Mgii absorbers. However, it is also possible that the Mgii cloud in the two–phase model is not associated with the high–ionization Civ gas, but instead produced in a more metal–rich region.
An alternative scenario for the system is a one–phase model. This single phase gives rise to the more highly ionized transitions such as Siiv and Civ, as well as the observed, extremely weak Mgii absorption. Both the ionization parameter () and the size ( kpc) of this phase resemble those derived for the high–ionization phase in the two–phase model. This indicates that we might actually be seeing the Mgii contributed by a diffuse, high–ionization phase only, while any denser Mgii phase is not penetrated along this line of sight.
A survey of the warm–hot intergalactic gas in Ovi at sampled a group of Ly absorbers with at higher redshifts. In these sub–Lyman limit systems (LLSs), a photoionized phase with the temperature range was inferred to give rise to Ly, Siiv, Civ, and other lower–ionization transitions, in addition to the collisional ionized Ovi gas (Simcoe, Sargent, & Rauch, 2002). The physical properties of this photoionized phase are similar to what we derived for the Civ cloud in either the one–phase or two–phase model for the system. This could suggest that the system is related to such Ovi absorbers that were common at high redshift. The low–ionization absorption that is detected in our one– or two–phase models might be suppressed at higher redshift due to the increased ionizing photon density.
On the other hand, in the local universe, a study of the relationship between a Ly absorber (at ) and a nearby dwarf post–starburst galaxy in the C sightline was made by Stocke et al. (2004). The Ly absorber was found similar to the three weak Mgii systems toward PG modeled in Charlton et al. (2003), with an Hi column density of , but with a somewhat lower metallicity of solar (Tripp et al., 2002). It is argued that the observed absorption system is produced in the gas that is driven out by the supernovae explosion in the nearby dwarf galaxy (Stocke et al., 2004). The Mgii absorption in the system toward C is extremely weak ( mÅ as measured by GHRS) even when compared to that in the system. But with the decrease of the background radiation from to taken into account, a system with stronger Mgii and weaker Civ absorption would be expected at . In this sense, the system could be a analog to the system. Notably, the system also has an unusual offset between some of the different transitions. Since at redshift , dwarf galaxies are too faint to be observed, we cannot rule out the possibility that they are responsible for the absorption seen in some sub–LLSs. In fact, the low metallicity of the Civ phase in the system ( solar) is consistent with the interpretation that it originated in the ejecta from a dwarf galaxy. That is, either the dwarf galaxy itself creates the wind with overall low metallicity or the wind has swept up a large amount of the metal–poor gas (Stocke et al., 2004).
Our results for system toward PG lead to the question of whether there are two different types of single–cloud, weak Mgii absorbers. The first class would have close to solar metallicity in both the low– and high–ionization phases, e.g. like the and absorbers toward PG (Charlton et al., 2003), and could perhaps arise through “in–situ” star formation in intergalactic regions. The second class would have lower metallicity and could be related to dwarf galaxies or dwarf galaxy winds, e.g. like the absorber toward C . It remains uncertain in which of these possible classes the absorber belongs.
4.2 The System Toward PG
4.2.1 Results
As shown in Figure 2, the system at z=0.5584 is a multi–cloud, weak Mgii absorber. The blended Mgii absorption spreads between v and km s-1. However, neither Mgi nor Feii has detected absorption to a rest–frame equivalent width limit of Å (Churchill et al., 1999) over this velocity range. The STIS spectrum covers Alii, Aliii, Siii , and Civ, with only Civ having detected absorption. The Civ absorption covers a similar velocity range as Mgii. Therefore, in principle, this system could be a single–phase absorber with Mgii and Civ produced in the same phase of gas.
A Voigt profile fit to the Mgii doublet yielded four clouds at v, , , and km s-1. Table 5 lists their redshifts, column densities, and Doppler parameters. Initially, the radiation from background quasars is assumed to be the only ionizing source. With the assumption that the clouds are optically thin and all have the same ionization parameter, the absence of detected Feii places a lower limit of . If Civ arises in the same phase as the Mgii (the one–phase scenario), then the ionization parameter can be stringently constrained by the ratio of / for each cloud. For this case, the clouds at v and km s-1 would have an ionization parameter of , with a dex uncertainty. The clouds at v and km s-1 are constrained to have and , respectively. If, instead, Mgii and Civ arise in two different phases (the two–phase model), then only a lower limit can be placed on the ionization parameter of the Mgii clouds, by the absence of Feii detection. Here, we favor the one–phase scenario, guided by our general principle of minimizing the number of phases.
The ionization parameter ranges derived above are based on the assumption that the system is optically thin. This places a lower limit of on the system’s metallicity. If, on the other hand, the system is optically thick, then the ratio / would depend on both metallicity and ionization parameter. Due to lack of the spectral coverage of any of the Lyman series lines, the metallicity cannot be constrained for the system. For simplicity, we focus on a scenario in which the system is optically thin. Cloud sizes range from – kpc in a one–phase model, though they could be smaller for larger metallicities.
An alternative input spectrum, with the inclusion of radiation from star–forming galaxies, was also explored. For the one–phase scenario, / is slightly lower for the same ionization parameters, due to the softer stellar spectrum between – Ryd. This results in an increase in ionization parameter by dex.
4.2.2 Discussion
The kinematics of multiple–cloud, weak Mgii systems can be cast into two distinct sub–categories. The systems in the first category, “kinematically spread”, have one or more dominant Mgii cloud(s) and several weaker ones spread over a wider range (for example, the system toward PG which we will discuss in § 4.5). The systems in the second category, known as “kinematically compact”, are characterized by multiple weak clouds (with comparable equivalent widths) blended together and spread over less than km s-1 in velocity space (for example, the system toward PG in Zonak et al. (2004)). The difference in kinematics between the two types of multiple–cloud, weak Mgii absorbers suggests two distinct origins of the absorbing gas. Specifically, the “kinematically spread” systems are found to resemble classic, strong Mgii absorbers in their physical properties and thought to arise in giant, luminous galaxies. Perhaps the weakness of the Mgii absorption is a result of the line of sight passing through a relatively sparse region of a galaxy, at a large impact parameter, or of a relatively gas–free galaxy. On the other hand, it has been argued that the “kinematically compact” systems could be associated with dwarf galaxies instead.
The system at toward PG is a typical example of the “kinematically compact”, multiple–cloud, weak Mgii absorbers. We find that a one–phase model is consistent with the absorption seen from this system, in which both Mgii and Civ are produced in the same gas. As discussed earlier, this interpretation is the most straightforward derivation from the observed absorption profiles. Due to the extremely limited number of the transitions covered in the spectrum, there could be additional phases that we are unable to diagnose.
Another example of such “kinematically compact”, multiple–cloud, weak absorbers is the system toward PG , studied by Zonak et al. (2004). This system, which consist of two subsystems ( km s-1 separated from each other in velocity space), have a spectral coverage of Ly and various metal lines, ranging from Mgii to Civ, Nv, and Ovi. The profiles of the Ovi doublets in both subsystems are km s-1 offset from the lower–ionization transitions. In addition, this offset, broad high–ionization phase is found to have a higher metallicity than the metal–poor Mgii clouds. It is argued that this system may either be produced in a pair of dwarf galaxies whose halo components are offset in velocity space from their central regions, or in two opposite sides of a superwind around a dwarf that is undergoing a starburst phase (Zonak et al., 2004). Given the similarity in kinematics as well as in ionization state of the Mgii phase between this system and our system at , it seems that the two systems could have similar phase structure and could arise in similar environments. In particular, the system could be produced in the line of sight that passes through a dwarf galaxy since a nearby luminous counterpart has not yet been found (Churchill et al., 1996). In a superwind model, this system would be an example of passing through high–density concentrations on only one side of the wind, while the subsystems imply passage through two sides.
We also cannot rule out the possibility that a more highly ionized phase, potentially traced by Ovi, is present in the system. Similar to the system, an offset, broad Ovi phase is also present in the and systems toward PG , both of which are “kinematically spread” multiple–cloud, weak Mgii absorbers. Furthermore, the diffuse Ovi phase in the system requires a higher metallicity than the Mgii phase (Masiero et al., 2004). If such an offset, more metal–rich phase was to exist also in the system, then it would be a statistically significant increase in our sample of multiple–cloud, weak Mgii absorbers. This presence of this phase could potentially be one major clue to the difference in the physical properties between multiple–cloud, weak and classic strong Mgii systems. In this sense, it would be of particular significance if the spectral coverage for Ovi was available, even at low resolution.
In the absence of detected Feii in the spectrum of the absorber, it is plausible that the Mgii and Civ absorption in system is produced in the same phase of gas. In fact, this is also the case for the system toward PG , in which Civ is produced in the Mgii clouds (Zonak et al., 2004). Despite this possibility, it also would not be surprising if Mgii and Civ actually arise in two separate phases of gas. For example, Civ absorption could instead either originate in an Ovi phase (as in the system toward PG (Masiero et al., 2004)) or in an additional intermediate phase (for example as in the collisionally ionized phase in system toward PG (Masiero et al., 2004)). Lacking the spectral coverage of Siiii, Siiv, and Nv, which usually place additional limits on kinematics, ionization state, and ionizing mechanism of individual Civ clouds, it is hard to tell whether the Civ phase is composed of multiple narrow structures or a single broad component. However, if the Ovi phase is offset as the one in the system, then Civ cannot be produced in the same phase as the Ovi in this case. Again, we would be in a better position to constrain the Civ phase if the spectral coverage for Ovi was available.
4.3 The System Toward PG
4.3.1 Results
As shown in Figure 3, the system at is a strong Mgii absorber, with Mgi, Feii, and Caii 3970 detected in the Keck spectrum as well. The Keck spectrum does not cover Caii 3935 at its velocity centroid where the absorption occurs (it only covers the spectrum at v km s-1). Aligned with the strongest Mgii absorption in velocity space, is relatively strong Mgi and Feii absorption, both transitions having profile shapes similar to that of the Mgii doublet. Caii also has detected absorption at km s-1, though it is much weaker in strength. The Civ doublet displays broad absorption features that are distinctly different from those seen in the low–ionization transitions. Hence, a multi–phase model is certainly required for this system.
A Voigt profile fit to the Mgii doublet yielded four separate clouds at v, , , and km s-1. Their redshifts, column densities, and Doppler parameters are listed in Table 6. The two stronger clouds at v km s-1 (with and km s-1) and v km s-1 (with and km s-1) combine to produce the saturated absorption in Mgii at the system velocity zero–point. A solar abundance pattern and a QSO–only ionizing spectrum are initially assumed. For the two strongest clouds at v and km s-1, Mgi, Caii , and Feii were all used to constrain physical parameters. Because the system is optically thick, the production of , , and depend on both ionization parameter and metallicity. For example, if the metallicity is of the solar value, the ionization parameter is constrained by / to be ; when the metallicity is one tenth of solar, the ionization parameter is , as required by /. A metallicity of underproduces Mgi regardless of . The ionization parameters derived for both solar and one tenth metallicity are both consistent with the observed /, but both severely overproduce Caii. It seems that an abundance pattern adjustment with calcium decreased by dex relative to magnesium is necessary for the strongest Mgii cloud.
An alternative approach is to create an additional phase which gives rise to the observed Mgi and raise the ionization parameter of the Mgii cloud such that it gives rise to less Feii and Caii. A Voigt profile fit to Mgi yields one single component, with and km s-1, at v km s-1. At one tenth solar metallicity, the ionization parameter of this phase is constrained to be , so that Caii is not significantly produced. For the dominant Mgii cloud at the same velocity, the ionization parameter is constrained by / to be , so that Caii is not overproduced. However, this ionization state range underproduces Feii. The observed / requires . Therefore, an abundance pattern adjustment with either an elevation of iron by dex or a decrease of calcium by dex is needed for the strongest Mgii cloud.
From the two weak, more offset Mgii clouds at v and km s-1 (see Figure 3), Mgi, Caii, and Feii is not detected. No stringent constraint on ionization parameter or metallicity can be obtained for the relative production of these transitions either. Hence, for simplicity, we tabulate the same ionization parameter and metallicity as the other stronger Mgii clouds.
Regardless of whether an even lower–ionization Mgi phase is included or not, only a small fraction of the observed Civ absorption could be produced in the Mgii phase (or Mgi plus Mgii phases). A separate high–ionization phase is required to produce the absorption seen in Civ. A Voigt profile fit to the Civ doublet gave six distinct clouds (see Table 6). With lack of coverage of other high–ionization transitions and the Lyman series lines, the ionization state and metallicity of this phase are poorly constrained. For simplicity, we assume that the six clouds have identical physical properties (i.e. ionization state and metallicity). In addition, this phase is assumed to have the same metallicity as the Mgii phase. Either photoionization or collisional ionization could be the dominant ionizing mechanism for the six clouds. For the case of photoionization, a lower limit of is placed on the ionization parameter such that absorption is not significantly produced in any of the low–ionization transitions. For the case of collisional ionization, with the assumption of a uniform temperature, the temperature is constrained to be in order not to overproduce low–ionization transitions.
A background spectrum, with the inclusion of star–forming galaxies, is also considered for the two–phase model. The ionization parameter of the Mgii phase would need to be decreased by dex so that Mgi would not be underproduced. The Civ phase ionization parameter does not undergo significant change, since it was poorly constrained in the first place. An abundance decrement of dex in calcium is still needed for the strongest Mgii cloud for a model without an additional Mgii phase.
4.3.2 Discussion
The system at is a “classic” strong Mgii absorber. Its low– and high–ionization transitions have such distinctively different kinematics that this system is by all means a multi–phase absorber.
The system has a nearby galaxy candidate (at an impact parameter of kpc). The galaxy has a B and K band luminosities of and , respectively, and the rest–frame B-K color of (Churchill et al., 1996). The galaxy properties are listed in Table 2.
The Mgi absorption in the system is particularly strong. This provides a hint that Mgi could arise in a separate phase with lower ionization than that of the Mgii clouds. In fact, such a model could consistently reproduce the observed absorption profiles, provided the ionization parameter of the Mgii phase is elevated as in comparison to a one–phase model. Such an additional Mgi phase is found to exist in the DLA system at toward PG , with a density of – cm-3 and a temperature of ’s of Kelvin (Masiero et al., 2004), similar to our hypothesized Mgi phase. In addition, such cold, dense Mgi pockets (with a density of cm-3 and a temperature on the scale of s of K) were also implied by models of a Lyman limit system (LLS) at toward PG . These tiny concentrations of gas are believed to be analogous to small–scale structure which is observed in the Milky Way ISM (Ding et al., 2003a).
Another interesting point concerning the low–ionization gas in the system is the relative abundance of various metal species. As shown in the spectrum, the Caii absorption is very weak in comparison to that of Mgi, Mgii, and Feii. Regardless of the phase structure of the low–ionization gas, a decrease of the calcium abundance by either or dex (depending on the scenario) is needed. However, in the scenario with the inclusion of the additional Mgi phase, this decrease of calcium could instead be replaced by an elevation of iron by dex, with regard to magnesium and calcium. Interestingly, a similar abundance pattern adjustment (the elevation of iron) was reported to be necessary in both the low– and the very low–ionization phases in the system at toward PG (Masiero et al., 2004). This also suggests that the low–ionization gas in the two systems is of similar origin.
A third common feature between the system and system toward PG is that the Civ absorption cannot be produced in the Mgii phase. Lacking spectral coverage of Siiv, Nv, or Ovi, the physical conditions of the Civ phase in neither system can be well constrained. For the system at , however, the narrow, resolved components apparent in the Civ profiles indicate that the high–ionization gas is unlikely to arise in a coronal structure similar to that of the Milky Way. The system at toward PG has similar narrow components resolved in its Civ and Nv profiles. This absorber is part of a double Mgii system and is thought to arise from a patchy distribution of gas in the outskirts of a warped spiral disk at an impact parameter of kpc (Ding et al., 2003b).
A broadband image of the PG field, in combination with follow–up spectroscopic study, confirmed a host galaxy for the system at an impact parameter of kpc (Steidel, Dickinson, & Persson, 1994; Steidel & Dickinson, 1995). The galaxy has a B and K band luminosities of and , respectively. With the rest–frame B-K color of , this galaxy is likely to be a spiral (see Table 2). Therefore, it follows that the high–ionization gas in the system could also be produced in the patchy corona of a mid–type spiral galaxy that does not have too much on–going star formation activity. Resolved structures in the high–ionization gas are not rare for strong Mgii absorbers. For example, the system at toward PG is a classic, strong Mgii system. Although its Civ absorption is saturated, there are resolved structures discerned in its Siiv profiles. This system also has a known host galaxy, with the rest–frame B-K color of and an impact parameter of kpc (Churchill et al., 1996). Therefore, it could originate in a galaxy environment similar to that responsible for the absorber.
The majority of the ionized gas in the ISM of the Milky Way exists in a vertically extended layer, known as the Reynolds layer. This warm ionized medium (WIM) of our Galaxy, with a local midplane density of cm-3 and a scale height of kpc, fills more than of the entire ISM volume (Reynolds, 1993). Such layers have also been confirmed to exist in many other spiral galaxies by various observing techniques, such as narrow–band emission line imaging, long–slit spectroscopy, and Fabry–Perot observations (Walterbos & Braun, 1994; Hoopes, Walterbos, & Greenwalt, 1996; Ferguson, Wyse, & Gallagher, 1996). They are more commonly referred to as diffuse ionized gas (DIG) in external spiral galaxies. It is believed that radiation from OB stars within the galaxies is the primary ionization source. Therefore, the thickness of the DIG is dictated by the amount of star formation in the individual galaxy. A study of four edge–on spiral galaxies by Collins & Rand (2001) and Collins et al. (2000) indicates that the production of this layer could be consistent with galactic fountain model, in which the dynamic halos result from materials pushed from the midplane by the violent star formation in the disk. It is highly possible that the patchy corona we discussed earlier is in fact part of the DIG.
4.4 The System Toward PG
4.4.1 Results
As shown in Figure 4, the system at is a multiple–cloud, strong Mgii system. The Mgii absorption spreads over the velocity range km s-1, with a high–velocity cloud located at km s-1. The strongest absorption seen in most low–ionization transitions, such as Mgi, Feii, and Cii, is aligned with that of Mgii in velocity space. The high–ionization transitions Siiv and Civ show strong absorption at similar velocities, including a component centered on the high–velocity cloud. However, the absorption in both transitions extend further to the blue ( km s-1) in the spectrum. The absorption seen in the Civ doublet is strong and saturated.
A simultaneous Voigt profile fit to the Mgii 2796, 2803 doublet, Mgi, and Feii yields eight separate clouds. Their individual column densities and Doppler parameters are listed in Table 7. An extragalactic ionizing background due to quasars is assumed to be the dominant ionizing source initially, while an alternative with the inclusion of starburst galaxies will be discussed later on. With the assumption that the eight clouds have the same metallicity, the ionization parameter of each cloud is constrained by / and /. Specifically, the clouds have ionization parameters in the range . The only exception is the cloud at v km s-1, which has weak and blended absorption in Mgi and Feii and therefore cannot be well constrained using / and /. However, an upper limit of is placed on the ionization parameter of this cloud so that it does not overproduce Cii. Although the ionization parameter ranges derived above are based on one tenth solar metallicity, they are valid, within 0.5 dex, for both solar metallicity and one hundredth solar metallicity. Lacking coverage of the Lyman series lines, the metallicity cannot be robustly constrained.
Regardless of the choice of metallicity, the ionization parameters of the Mgii phase are so low that they produce only a small fraction of the Siiv or Civ absorption at similar velocities. In addition, both Siiv and Civ display strong absorption at velocities blueward of the Mgii clouds. Therefore, a more highly ionized phase is required. Because the profiles of Civ are saturated, a Voigt profile fit was performed on the Siiv . Five clouds were obtained, with their individual redshifts, column densities, and Doppler parameters listed in Table 7. These clouds are initially assumed to have the same metallicity as that of the Mgii phase.
Both photoionization and collisional ionization have been explored, with / and / constraining the range for ionization parameters and kinetic temperatures. For the case of photoionization, at , Mgii and Cii are both overproduced over the range of reasonable ionization parameters . At , Civ is overproduced as well. Alternatively, at solar metallicity, a reasonable fit could be obtained for most transitions when the ionization parameter was , though Cii and Civ are both overproduced at v and km s-1. An alpha–enhancement of dex would be needed for these two clouds.
For the case of collisional ionization, no temperature range that reconciles this discrepancy could be found consistent with the data for one tenth solar metallicity. At , Cii is overproduced while at , Civ is overproduced. A change of metallicity does not allow us to find a consistent temperature either. Given the significant overproduction of Cii and Civ (as compared to the photoionization case), a much greater alpha–enhancement would be required in order for the model to reproduce the observed profiles. Therefore, photoionization is favored over collisional ionization for the high–ionization transitions in this system.
We also consider the case where stellar sources make a significant contribution to the extragalactic background radiation. The stellar spectrum, which is softer than the extragalactic radiation at – Ryd, is less effective in ionizing Ciii to Civ which requires an ionizing energy of eV. Therefore, for the high–ionization phase, this leads to the production of less Civ with similar ionization parameters. Due to the saturation of the Civ absorption between km s-1, this change in the input spectrum noticeably affects only the high–velocity cloud at v km s-1. Specifically, with a solar abundance pattern and the same ionization parameter, Civ is no longer overproduced as it would be using the QSO–only background. However, since Cii is still slightly overproduced, the ionization parameter needs to be increased by dex. Still, an alpha–enhancement of dex is needed due to the overproduction of Cii and Civ. For the low–ionization phase, the alternative input spectrum has little influence, given that the ionizing energies of the low–ionization transitions fall in the energy range where the contribution from O and B stars do not make a significant difference. Therefore, the derived ranges for the ionization parameters are still valid for these clouds.
4.4.2 Discussion
This system is a “classic” strong Mgii absorber with a two–phase structure. The low–ionization clouds have a typical density of cm-2 and sizes between and pc. The high–ionization phase, which overlaps the low–ionization clouds in velocity, has a typical density of cm-2 and cloud sizes between and kpc. This system has a galaxy with a redshift consistent with the absorber at an impact parameter of kpc from the quasar. The host galaxy has the absolute B and K magnitudes of and , respectively, and the rest–frame B-K color of (Churchill et al., 1996) (see Table 2).
The Siiv and Civ profiles have strong absorption extending further to the blue in the spectrum than the majority of the low–ionization transitions. A similar offset of the more highly ionized transitions from the low–ionization ones is seen in another strong Mgii system at z= toward PG (Ding et al., 2003a). In this system, the clouds offset to the red in the spectrum have higher ionization parameters than the others in the low–ionization phase and hence give rise to stronger Siiv and Civ, but weaker Mgii. This gradient in the ionization parameter was interpreted to be the result of a density variation in the disk of the host galaxy (with a range of cm-3 to cm-3). However, in the z= system, the absorption in the low–ionization transitions is so weak at the offset velocity that the ionization parameters of the offset clouds have to be much higher than the rest of the low–ionization clouds. This leads to the density of the offset clouds being cm-2, roughly times higher than those of the clouds in the low–ionization phase. Therefore, it is likely that the Mgii clouds arise in a medium similar to the warm, ionized inter–cloud medium in the Milky Way (McKee & Ostriker, 1977), probably the disk ISM of the luminous galaxy candidate, while the offset clouds are produced in a separate, more diffuse phase, together with the other clouds that are responsible for absorption seen in Siiv and Civ. This is consistent with the conclusion in Churchill et al. (1999), where the existence and global dynamics of smaller, kinematic ”outliers” are found to be intimately linked to the presence and physical conditions of a higher ionization phase.
Resolved structures, superimposed on the Mgii clouds, are seen in the profiles of Siiv. The absorption in Civ, on the other hand, is much stronger and saturated, but aligned with that of Siiv. This high–ionization phase has a solar metallicity. For comparison, the system at z= toward PG has a broad, smooth profile for high–ionization transitions and is likely to be produced in a spiral galaxy similar to Milky Way. On the other hand, the system at z= has resolved high–ionization, narrow components superimposed on the low–ionization clouds, indicating that it is likely to arise from a patchy distribution of gas in the outskirts of the warped spiral disk (Ding et al., 2003b). In the case of this system, due to the saturation of the Civ absorption as well as lack of the coverage of Nv in the spectrum, it is hard to rule out either possibility.
The cloud at v km s-1 is a typical satellite cloud of a strong Mgii system (a weaker component found within hundreds of km s-1 of the strong, dominant absorption). Absorption separate from that related to the dominant, low–ionization component, is also seen in Civ at similar velocity. This velocity overlap is found in most satellite cloud systems at z (Churchill & Charlton, 1999). However, with only low–resolution HST/FOS spectra () available, Churchill & Charlton (1999) were not able to determine whether the offset Civ absorption was produced in a common halo encompassing the main galaxy and the HVC or in kinematically distinct gas. The Siiv absorption in this system is stronger than what would be expected from an ionizing source that is dominated by the extragalactic background radiation, with the assumption of a solar abundance pattern. This could be solved by a change in the abundance pattern, in particular, an alpha–enhancement of for this cloud. This would imply an origin of the gas in Type II supernovae. If more satellite clouds at z are found to have a similar abundance pattern, then it could suggest a more homogeneous origin of this type of HVC satellite at this redshift, as opposed to a diverse production of the Milky Way HVCs (Sembach et al., 1999). On the other hand, an ionizing source with the inclusion of significant ionizing radiation from stellar sources could somewhat reduce the absorption in Cii and Civ and hence reduce the amount of increment needed for the alpha–elements. The relatively blue, luminous galaxy, detected within an impact parameter of kpc from the absorber in the quasar field, could have escaping radiation. The decrease in the extragalactic ionizing background since z could result in a general difference in the relative absorption between the low– and high–ionization transitions in high–velocity clouds between the two epochs (Haardt & Madau, 2001).
4.5 The System Toward PG
4.5.1 Results
As shown in Figure 5, the system at is a multiple–cloud, weak Mgii system. The absorption in the Mgii doublet spreads between and km s-1 in velocity space. At the system’s velocity zero point, where the strongest Mgii absorption occurs, absorption is also apparent in various low– and high–ionization transitions, such as Feii, Siii, Cii, Siiv, Civ, and Nv. The only exceptions are Mgi and Oi, which do not have detected absorption in their spectra. In addition to having narrow components, aligned in velocity space with low–ionization transitions, Civ also appears to require a broad, strong absorption feature, centered at v km s-1, to fit its profiles.
Eight clouds were obtained from a simultaneous Voigt profile fit to the spectra of Mgii, Mgi, and Feii. Individual redshifts, column densities, and Doppler parameters of these clouds are listed in Table 8. An extragalactic background, with radiation from quasars only, was used as the incident spectrum. Assuming that all eight clouds have the same metallicity, the metallicity was initially set to one tenth solar value. The ionization parameters of the individual cloud are all constrained by / to be in the range . At , Feii is underproduced, while at , both Feii and Oi are overproduced.
Without coverage of the Lyman series lines, the system’s metallicity cannot be constrained. Both solar and one hundredth solar metallicities have been explored in addition to the initial value of one tenth solar metallicity. It follows that when the metallicity decreases, the ionization parameter needs to increase and has a narrower range. At , the ionization parameter is stringently constrained by / to be , within a dex of uncertainty. On the other hand, when the metallicity increases to the solar value, the range for ionization parameter is very similar to the one derived for . This is because when , the clouds are optically thin and the ratio of the column densities of metal transitions varies only with ionization parameter. For , cloud sizes range from – pc.
Regardless of the choice of metallicity, the derived ionization parameter range gives rise to most of absorption seen in the low–ionization transitions Siii and Cii. Cii appears to be contaminated by an known blend, since the absorption at km s-1 (see Figure 5) is unmatched in any other transitions. However, very little Siiv and none of the Civ or Nv absorption could be produced in these clouds. Therefore, an additional, more highly ionized phase is needed to give rise to these high–ionization transitions.
Due to blending and noise in the spectra of Siiv (blended with Galactic Feii ) and Siiv , a Voigt profile fit was performed on the Civ doublet, as well as on the Nv doublet. Four clouds were obtained and their individual redshifts, column densities, and Doppler parameters are listed in Table 8. In addition to the broad absorption profile, the two clouds at km s-1 and km s-1 are narrow and aligned with the low–ionization components in velocity space. Clearly these fits are only approximate, but they still provide a guide to the physical conditions of the high–ionization phase.
The high–ionization phase is assumed to have the same metallicity as that of the Mgii phase. The two narrower clouds at km s-1 and km s-1 cannot be produced by collisional ionization due to their small Doppler parameters. A lower limit of is placed on their ionization parameters so that they give rise to enough Nv and do not overproduce Siiv and Cii as well. For the two broader clouds at km s-1 and km s-1, both photoionization and collisional ionization are explored. For the case of photoionization, an upper limit of is placed on the ionization parameter so that enough Siii and Cii can be produced. For the case of collisional ionization, the temperature is constrained within dex of uncertainty of , where Civ peaks. At , Nv will be overproduced, while at , Cii and Siii will be overproduced. Since the clouds are optically thin, even at , the derived ionization parameter and temperature ranges are consistent with metallicities within a reasonable range. For , the high–ionization cloud sizes are quite large, a few tens to a few hundreds of kpc. They could be smaller for higher metallicity or for alternative fits to the CIV.
If, alternatively, a contribution from star–forming galaxies is included in the extragalactic background radiation, the ionization parameter would need to be increased by dex for the high–ionization phase in order to fit all the transitions.
4.5.2 Discussion
The system at is a multiple–cloud, weak Mgii absorber, with low–ionization kinematics similar to that of many strong Mgii systems. In the formal multi–variate classification system of Churchill et al. (2000), it was classified as a “classic” absorber. As discussed in § 4.2.2, such absorbers, with one or more dominant Mgii clouds and several weaker ones spread over a wider range in velocity space, are classified as “kinematically spread” systems. They are often found to have physical conditions similar to those of classic, strong Mgii absorbers such that they could arise in the outskirts of giant, luminous galaxies. Other examples of “kinematically spread” multiple–cloud, weak Mgii absorbers include the systems at and toward PG . In both of these systems, the high–ionization gas, traced by Ovi, is found to be kinematically distinct and offset from the low–ionization phase. In fact, it is suggested in Masiero et al. (2004) that this difference in kinematics could be used to discriminate a difference in origin between multiple–cloud, strong and multiple–cloud, weak absorbers, with the latter arising in dwarf galaxies or in superwinds. However, such kinematic distinction does not appear in the system. On the contrary, the high–ionization phase, traced by both narrow structures and broad components in the Civ absorption, is found to be centered on the low–ionization Mgii clouds. In fact, with the rest–frame equivalent width ) Å, the system at is just below the cutoff for a strong Mgii absorber. Thus, this system could be considered as a strong Mgii absorber, only with somewhat weaker Mgii absorption. This “blending of classes” should not be surprising since the Å boundary between strong and weak Mgii absorbers is only historical (Steidel & Sargent, 1992).
The most interesting and striking feature of the low–ionization gas in the system is probably the three pairs of lines seen at and km s-1, and km s-1, and and km s-1, in the Mgii absorption. These paired clouds, with v, , and km s-1, respectively, could arise in the shell of a superbubble. Various previous studies have provided evidence for a connection between paired absorption lines and superbubbles. For example, in Bond et al. (2001), multiple pairs of lines, each with v km s-1, are detected in the system toward MC . These line pairs are believed to arise in the oppositely expanding sides of the cold superbubble shell which intersects the line of sight. Similarly, a pair of lines split by km s-1 is observed by Savage, Sembach, & Howk (2001) in the Scutum supershell. The kinematics of the Civ in the system are consistent with the superbubble hypothesis as well. Particularly for the reddest pair, Civ is centered in between the two Mgii clouds in velocity space (at km s-1) and has a broader ( km s-1), unresolved absorption profile. Although not as obvious, the other two pairs could have similar Civ structures within the uncertainties of our modeling of the high–ionization phase. High–ionization absorption could arise in the hotter, more diffuse medium that exists in the interior of the shell which gives rise to the paired Mgii absorption lines.
The kinematic structure of most strong Mgii systems is consistent with a rotating disk in combination with radial infall from the halo (Lanzetta & Bowen, 1992; Charlton & Churchill, 1998; Churchill & Vogt, 2001). It is common for these absorbers to have the high–ionization gas grouped with the low–ionization clouds. In the system, the Civ absorption, with both narrow components and a broader, smooth structure in its profiles, is centered on the Mgii clouds. The broad Civ component, with a Doppler parameter of km s-1, could be comparable to the high–ionization phase in system B of the double system at toward PG . However, in contrast to the strong, smooth Nv profiles in system B, which resemble the “Galactic corona”, the Nv absorption in the system only has weak and resolved structures. On the other hand, the high–ionization gas in system A of the same double system has high–ionization components centered on low–ionization groupings similar to those seen in the Civ and Nv profiles in the system. Furthermore, like the system at , system A has Mgii equivalent width ) Å, just below the threshold for strong Mgii absorption (Ding et al., 2003b). Similar narrow Civ clouds are also present in the strong Mgii system at toward PG , as described in § 4.3.2. It is inferred that both system A toward PG and that system at could arise in a patchy distribution of gas in the outskirts of a giant galaxy (see § 4.3.2).
Another system along the same line of sight toward PG is a classic, strong Mgii absorber at . Similar to the system, it has very strong Civ absorption. In addition, it also has an offset satellite Mgii cloud at km s-1 (though in this case, it is not paired absorption). As discussed in Churchill et al. (1999), the physical conditions of the Civ gas are closely related to the presence of the kinematically outlying Mgii clouds. In particular, the two could be governed by the same physical processes. The balance between the outflow energetics from supernovae in the galaxy and the galactic gravitational potential well could result in a high–ionization Galactic–like “corona” in proportion to the kinematics of gravitationally bound, cooling material (Churchill et al., 1999). The system at is another good example in support of this conclusion.
In this case the most appealing comprehensive model would have superbubbles giving rise to pairs of Mgii components with broad surrounding Civ. The superbubbles and the resulting satellite clouds could also be related to production of a broader Civ “corona” component.
4.6 The System Toward PG
4.6.1 Results
As shown in Figure 6, the system at toward PG 1317+274 (also known as CSO 873) is a multiple–cloud, strong Mgii absorber. The absorption in Mgi, Mgii, and Feii spreads between and km s-1 in velocity space and these transitions all display a similar profile shape. The STIS spectrum has coverage of the low–ionization tracers Alii, Siii , and the high–ionization tracers, Siiv and Civ. The Siiv is not detected in a noisy region of the spectra. Only a small amount of Civ absorption is detected at velocities consistent with the Mgii clouds. However, strong Civ absorption is detected at v km s-1. The high–ionization transitions, Nv and Ovi, are not covered.
A simultaneous Voigt profile fit was performed on Mgii, Mgi, and Feii. Eight clouds were obtained, with their individual redshifts, column densities, and Doppler parameters listed in Table 9. The clouds are assumed to all have the same metallicity, with the value initially set to one tenth the solar value. The ionization parameter of each cloud is constrained by /, wherever Feii is detected. The clouds at , , , , and km s-1 have detected Feii and their ionization parameters are roughly determined to be . Within this ionization parameter range, the observed / can be produced as well. At , , and km s-1, neither Mgi nor Feii is detected. Therefore, only very limited constraints can be placed on their ionization parameters. For simplicity, we assume the clouds at these velocities to have ionization parameters in a similar range, , as the others.
Lacking the coverage of the Lyman series lines, metallicity cannot be constrained. In addition to our initial assumption of one tenth solar metallicity, both solar and one hundredth solar metallicities have been considered. We found a general trend that when the metallicity increased, a slightly higher ionization parameter was required to give rise to the observed Feii and Mgi; and when the metallicity decreased, a lower ionization parameter was needed instead. However, this adjustment is usually within or dex. Therefore, the ionization ranges that are derived using a tenth solar metallicity are applicable for a wide metallicity range.
Because , based upon detected Feii absorption, Civ is not significantly produced by the Mgii clouds. Furthermore, there is an additional Civ component at km s-1. Therefore, a high–ionization phase is needed. A Voigt profile fit to the Civ yielded four components (see Table 9). We assume the same metallicity, , as we used for the low–ionization phases. The ionization parameters were constrained by the low–ionization transitions. A lower limit of applies for the clouds at , , and km s-1 in order that Siii and Alii are not overproduced. Constrained by the same transitions, for the cloud at km s-1.
An alternative input spectrum, with the inclusion of the stellar contribution escaping from galaxies, was also superimposed on the test models. It has been shown that there is little difference in the derived ranges for the ionization parameter. This is because at the energies relevant to photoionization of the low–ionization transitions, the two input spectra have very similar shapes. For the high–ionization phase, the limits on would be somewhat larger due to the change in input spectral shape.
4.6.2 Discussion
The system at z= toward PG is a strong Mgii absorber that has been classified as “Civ–deficient” because its Civ absorption is weak relative to Mgii (Churchill et al., 2000). In fact, there are only small amounts of Civ absorption detected in the STIS spectrum at the velocities of the Mgii components. However, there is a strong “Civ high–velocity cloud” at km s-1. All of the Civ clouds required a separate high–ionization phase, with , since the low–ionization clouds were constrained to have in order that they would produce the detected Feii absorption.
A galaxy is found within an impact parameter of kpc of the line of sight toward PG in the HST/WFPC2 F702W image of the quasar field (see Table 2. This galaxy is at a redshift consistent with that of the absorber. It is a reddish spiral (B-K (Churchill et al., 1996)) with a rotation curve that extrapolates to the velocity of the observed Mgii absorption (Steidel et al., 2002). Because of the large impact parameter, even in projection, this would imply what is perhaps an unrealistically large rotating disk, leading Steidel et al. (2002) to the conclusion that the halo is rotating. Also, due to its large impact parameter, its identification as the galaxy responsible for the absorption is somewhat tentative, though it seems that then a dwarf companion galaxy would be responsible. It may be an important clue to the nature of this system that the strong Civ absorption component is at a velocity only slightly redward ( km s-1) of the galaxy systemic velocity (Churchill & Steidel, 2003).
The system at z= toward PG is also a Civ–deficient system. In that case the relatively weak Civ absorption is mostly produced in the low–ionization phase which gives rise to Mgii (Ding et al., 2003a). The diffuse phase in the system, required by the broad Ly absorption profile, has a very low metallicity (less than solar). Other Civ–deficient absorbers include the z= and z= systems toward PG (Masiero et al., 2004). In both of those systems, Civ absorption was not even detected in STIS spectra. In none of these three Civ–deficient systems was an additional high–ionization phase required. Our system toward PG , at first glance, differs since even the Civ at the same velocities as Mgii requires a separate phase. However, it is also possible that there is a very–low ionization phase, as we discussed in § 4.3.1 for the case of the absorber toward PG and in Ding et al. (2003a) for the absorber toward PG . In this case, the Feii absorption could arise from the very–low ionization phase and the ionization parameter of the Mgii clouds could be higher in order to produce some Civ absorption. Higher resolution data would be required to distinguish these cases. In any case, for none of these Civ–deficient systems is there a strong and/or broad high–ionization component indicative of a corona.
It seems that Civ–deficient systems could have a various types of galaxy hosts, including elliptical galaxies, quiescent disk galaxies, and even star–forming disk galaxies. The key factor is that the coronal phase that gives rise to the Civ absorption is either absent or too highly ionized. In the case of this absorber, we hypothesize that the corona is absent at the high impact parameter in a relatively red spiral. This explanation also requires the unusual circumstance of passing through a dense region of a rotating disk or rotating halo that would produce strong (and not just weak) Mgii absorption.
For the case of this systems, the km s-1 can be viewed somewhat independently of the Civ–deficient nature of the system. It is quite reminiscent of the “Civ high–velocity clouds” found by Sembach et al. (1995) along the Galactic line of sight toward Markarian 509. It does not seem unusual that such a high velocity cloud could be within km s-1 of the galaxy systemic velocity. It is this high velocity component that gives this system relatively strong Civ absorption for a Civ–deficient system.
5 Summary and Conclusion
In this paper we present the modeling results of six Mgii–selected absorption systems, in the redshift interval of to , along the lines of sight toward three quasars. These six absorption systems sample a variety of types of absorbers and are therefore representative of a larger population in this redshift interval. Due to lack of coverage of the Lyman series lines in five of the systems, we were unable to obtain constraints on metallicities for them. However, we were able to constrain the number of phases of gas along the line of sight and their densities and kinematic structures. Here we summarize these results and their implications:
The system at toward PG is a single–cloud, weak Mgii absorber. This is the only system in this paper that has spectral coverage of Ly. Due to the slight offset of the Mgii absorption from the other transitions, this system could arise in either a one–phase or a two–phase model. Although the Civ absorption is produced by gas that has a solar metallicity, lower than what is usually found in single–cloud, weak Mgii absorbers (Rigby et al., 2002; Charlton et al., 2003), the Mgii absorption in this system could still arise in gas with a near–solar metallicity for the case of a two–phase scenario. Alternatively, this system could simply have a trace of Mgii absorption detected from a lone Civ cloud, a situation that would be more common at lower redshift due to a decreasing extragalactic background radiation (Narayanan et al., 2004).
The system at toward PG is a kinematically compact, multiple–cloud, weak Mgii absorber. It has been suggested that systems in this classification arise in dwarf galaxies based upon low metallicity and distinctive kinematic offsets ( km s-1) between low– and high–ionization components (Zonak et al., 2004). With spectral coverage of only limited transitions (Mgii, Alii, Aliii, and Civ), we cannot constrain the physical properties of this system too well. Civ can arise in the same phase as the Mgii, but in the absence of coverage of Ovi, the presence of “offset phases” cannot be considered. In the absence of Hi coverage, neither can metallicity, though properties of the low–ionization phases are similar between this system and the system toward PG (Zonak et al., 2004). An answer to the question of whether kinematically compact, multiple–cloud, weak Mgii absorption is a distinctive signature of dwarfs or whether it arises in a variety of circumstances awaits data on additional systems with large spectral coverage.
The system at toward PG is a kinematically spread, multiple–cloud, weak Mgii absorber. It has absorption features similar to those seen in classic strong Mgii absorbers. Three pairs of Mgii absorption features are seen in the profiles, suggesting that this system may arise in the cold shells of a series of expanding superbubbles (Bond et al., 2001). Since there has been no host galaxy identification, we suggest that this system could arise in the outskirts of a luminous galaxy. A broad high–ionization phase, consistent with a corona, is also apparent.
The systems at toward PG and at toward PG are both classic strong Mgii absorbers. Like other classic strong Mgii absorbers, both low– and high–ionization phases, with some kinematic association with each other, are needed to account for absorption seen in various transitions. Strong Mgii absorption systems at are known to be associated with luminous galaxies with a variety of morphology types (Steidel, 1995; Churchill et al., 1996; Steidel et al., 2002). While the resolved structures in the high–ionization transitions in the system at toward PG indicate a patchy corona, the saturated Civ absorption in the system at toward PG could arise in a traditional Milky Way–like corona. Both systems have identified galaxy hosts in their vicinity.
The system at toward PG is a Civ–deficient absorber. There are multiple causes for a system to be Civ–deficient, for example, an early–type galaxy host (Ding et al., 2003a), a low–metallicity corona (Churchill et al., 2000), or a corona that is too highly ionized. The identification of a spiral galaxy at an impact parameter of kpc host suggests that the “Civ–deficiency” in this system could result from suppressed or patchy coronal structure at a large impact parameter in the host galaxy. The strongest Civ absorption component for this system is at a velocity of km s-1 and is not coincident with the Mgii absorption. We propose that this component, which is at close to the systemic velocity of the candidate absorbing galaxy, is an analog to the Milky Way “Civ high–velocity clouds” (Sembach et al., 1995).
Through this detailed study of these six systems, we have learned of the varied relationships between low and high–ionization gas in Mgii absorption line systems. We have discussed the implications with respect to the absorption signatures of galactic coronae. We have also added examples of single–cloud and multiple–cloud, weak Mgii absorbers to the handful of such systems studied at this level of detail. The next step in reaching a global understanding of absorption properties is to combine the modeling results of this study, with those on other systems that were described in previous papers 1634,1206,weak1634,zonak,masiero. Using inferred physical properties, it should be possible to make quantitative comparisons of the gas properties across the range of gaseous structures sampled by Mgii absorption at intermediate redshifts.
This research was funded by NASA under grants NAG –, NNGGEG, and HST–GO––A, the latter from the Space Telescope Science Institute, which is operated by AURA, Inc., under NASA contract NAS –; and by NSF under grant AST––. JRM was partially funded by the NSF REU program.
References
- Bergeron & Boissé (1991) Bergeron, J., & Boissé, P. 1991, A&A, 243, 344
- Bergeron et al. (1992) Bergeron, J., Cristiani, S., & Shaver, P. A. 1992, A&A, 257, 417
- Bond et al. (2001) Bond, N. A., Churchill, C. W., Charlton C. C., & Vogt, S. S. 2001a, ApJ, 562, 641
- Bond et al. (2001) Bond, N. A., Churchill, C. W., Charlton C. C., & Vogt, S. S. 2001b, ApJ, 557, 761
- Brown et al. (2002) Brown, T. et al. 2002, HST STIS Data Handbook, version 4.0, ed.. Mobasher, Baltimore, STScI
- Charlton & Churchill (1998) Charlton, J. C., & Churchill, C. W. 1998, ApJ, 499, 181
- Charlton et al. (2003) Charlton, J. C., Ding, J., Zonak, S. G., Churchill, C. W., Bond, N. A., & Rigby, J. R. 2003, ApJ, 589, 311
- Churchill (1997) Churchill, C. W. 1997, Ph.D. Thesis, University of California, Santa Cruz
- Churchill & Charlton (1999) Churchill, C. W., & Charlton, J. C. 1999, AJ, 118, 59
- Churchill et al. (2000) Churchill, C. W., Mellon, R. R., Charlton, J. C., Jannuzi, B. T., Kirhakos, S., Steidel, C. C., & Schneider, D. 2000, ApJ, 543, 577
- Churchill et al. (1999) Churchill, C. W., Mellon, R. R., Charlton, J. C., Jannuzi, B. T., Kirhakos, S., Steidel, C. C., & Schneider, D. 1999, ApJ, 519, L43
- Churchill et al. (1999) Churchill, C. W., Rigby, J. R., Charlton, J. C., & Vogt, S. S. 1999, ApJS, 120, 51
- Churchill & Steidel (2003) Churchill, C. W., & Steidel, C. C. 2003, in The IGM/Galaxy Connection: The Distribution of Baryons at z=0, ed. J. L. Rosenberg & M. E. Putman (Kluwer, Dordrecht), 149
- Churchill et al. (1996) Churchill, C. W., Steidel, C. C., & Vogt, S. S. 1996, ApJ, 471, 164
- Churchill & Vogt (2001) Churchill, C. W., & Vogt, S. S. 2001, AJ, 122, 679
- Collins et al. (2000) Collins, J. A., Rand, R. J., Duric, N., & Walterbos, R. A. M. 2000, ApJ, 536, 645
- Collins & Rand (2001) Collins, J. A., & Rand, R. J. 2001, ApJ, 551, 57
- Ding et al. (2003a) Ding, J., Charlton, J. C., Zonak, S. G., & Churchill, C. W. 2003a, ApJ, 587, 551
- Ding et al. (2003b) Ding, J., Charlton, J. C., Churchill, C. W., & Palma, C. 2003b, ApJ, 590, 746
- Ferguson, Wyse, & Gallagher (1996) Ferguson, A. M. N., Wyse, R. F., & Gallagher, J. S. 1996, AJ, 112, 2567
- Ferland (2001) Ferland, G. 2001, Hazy, A Brief Introduction to Cloudy 96.00
- Giroux, Sutherland, & Shull (1994) Giroux, M. L., Sutherland, R. S., & Shull, J. M. 1994, ApJ, 435, L97
- Haardt & Madau (1996) Haardt, F., & Madau, P. 1996, ApJ, 461, 20
- Henry (1986) Horne, K. 1986, PASP, 98, 609
- Hoopes, Walterbos, & Greenwalt (1996) Hoopes, C. G., Walterbos, R. A. M., & Greenwalt, R. E. 1996, AJ, 112, 1429
- Lanzetta & Bowen (1992) Lanzetta, K. M., & Bowen, D. V. 1992, ApJ, 391, 48
- Le Brun et al. (1993) Le Brun, V., Bergeron, J., Boissé, P., & Christian, C. 1993, A&A, 279, 33
- Haardt & Madau (2001) Haardt, F., & Madau, P. 2001, in Clusters of Galaxies and the High Redshift Universe Observed in X-Rays, ed. D. M. Neumann & J.T.T. Van (Savoie, France), 64
- Marsh (1989) Marsh, T. 1989, PASP, 101, 1032
- Masiero et al. (2004) Masiero, J. , Charlton, J. C., Ding, J., & Churchill, C. W. 2004, ApJ, submitted
- McKee & Ostriker (1977) Mckee, C. F., & Ostriker, J. P. 1977, ApJ, 218, 148
- Narayanan et al. (2004) Narayanan, A., Charlton, J. C., Masiero, J. R., & Lynch, R. 2004, ApJ, submitted
- Reynolds (1993) Reynolds, R. J. 1993, in AIP Conf. Proc. 278, Back to the Galaxy, ed. S. S. Holt & F. Verter (New York: AIP), 156
- Rigby et al. (2002) Rigby, J. R., Charlton, J. C. & Churchill, C. W. 2002, ApJ, 565, 743
- Savage, Sembach, & Howk (2001) Savage, B. D., Sembach, K. R., & Howk, J. C. 2001, ApJ, 547, 907
- Sembach et al. (1995) Sembach, K. R., Savage, B. D., Lu, L. & Murphy, E. M. 1995, ApJ, 451, 616
- Sembach et al. (1999) Sembach, K. R., Savage, B. D., Lu, L. & Murphy, E. M. 1999, ApJ, 515, 108
- Simcoe, Sargent, & Rauch (2002) Simcoe, R. A., Sargent, W. L. W., & Rauch, M. 2002, ApJS 578, 737
- Steidel (1995) Steidel, C.C. 1995, in QSO Absorption Lines, ed. G. Meylan (Garching : Springer Verlag), 139
- Steidel et al. (1997) Steidel. C. C., Dickinson, M., Meyer, D. M., Adelberger, K. L., & Sembach, K. R. 1997, ApJ, 480, 568
- Steidel & Dickinson (1995) Steidel, C. C., & Dickinson, M. 1995, in Wide Field Spectroscopy and the Distant Universe, ed. S. Maddox & A. Aragon-Salamanca (Singapore: World Scientific), 349
- Steidel, Dickinson, & Persson (1994) Steidel, C. C., Dickinson, M. & Persson, E. 1994, ApJ, 437, L75
- Steidel et al. (2002) Steidel, C. C., Kollmeier, J. A., Shapley, A. E., Churchill, C. W., Dickinson, M., & Pettini, M. 2002, ApJ, 570, 526
- Steidel & Sargent (1992) Steidel, C. C., & Sargent, W. L. W. 1992, ApJS, 80, 1
- Stocke et al. (2004) Stocke, J. T., Keeney, B. A., McLin, K. M., & Rosenberg, J. L. 2004, ApJ, 609, 94
- Tripp et al. (2002) Tripp, T. M., et al. 2002, ApJ, 575, 697
- Walterbos & Braun (1994) Walterbos, R. A. M., & Braun, R. 1994, ApJ, 431, 156
- Zonak et al. (2004) Zonak, S. G., Charlton, J. C., Ding, J., & Churchill, C. W. 2004, ApJ, 606, 196
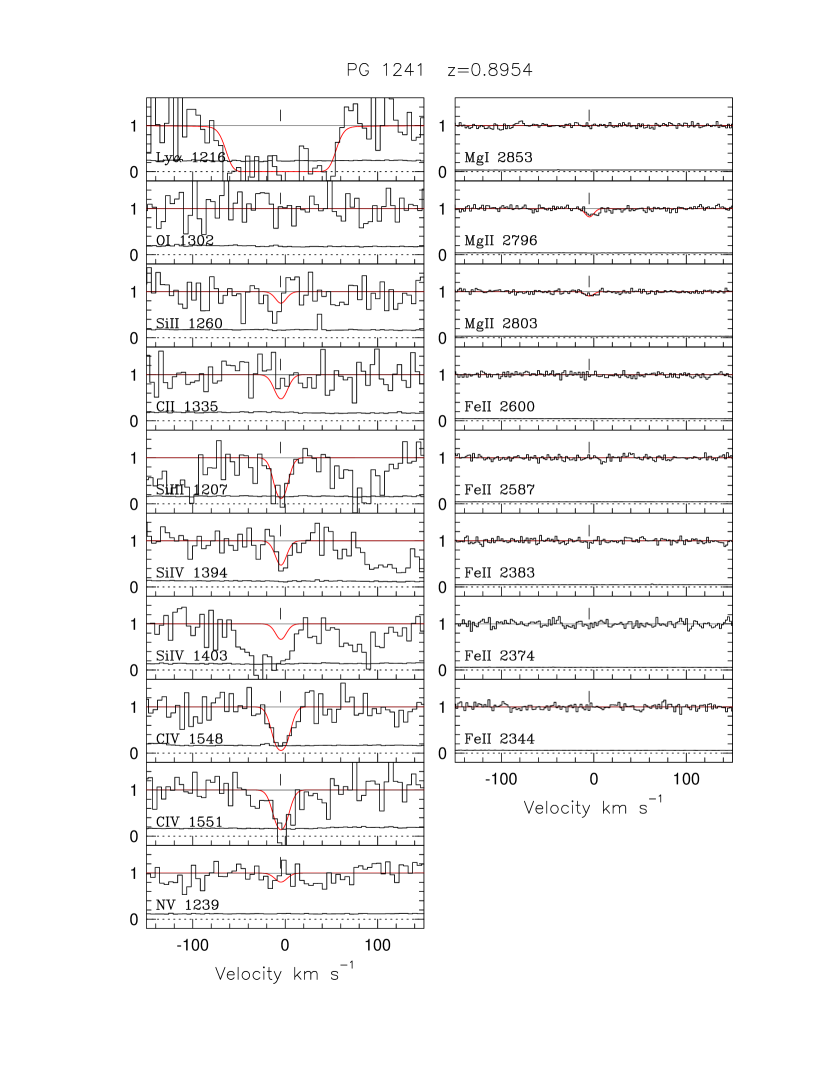

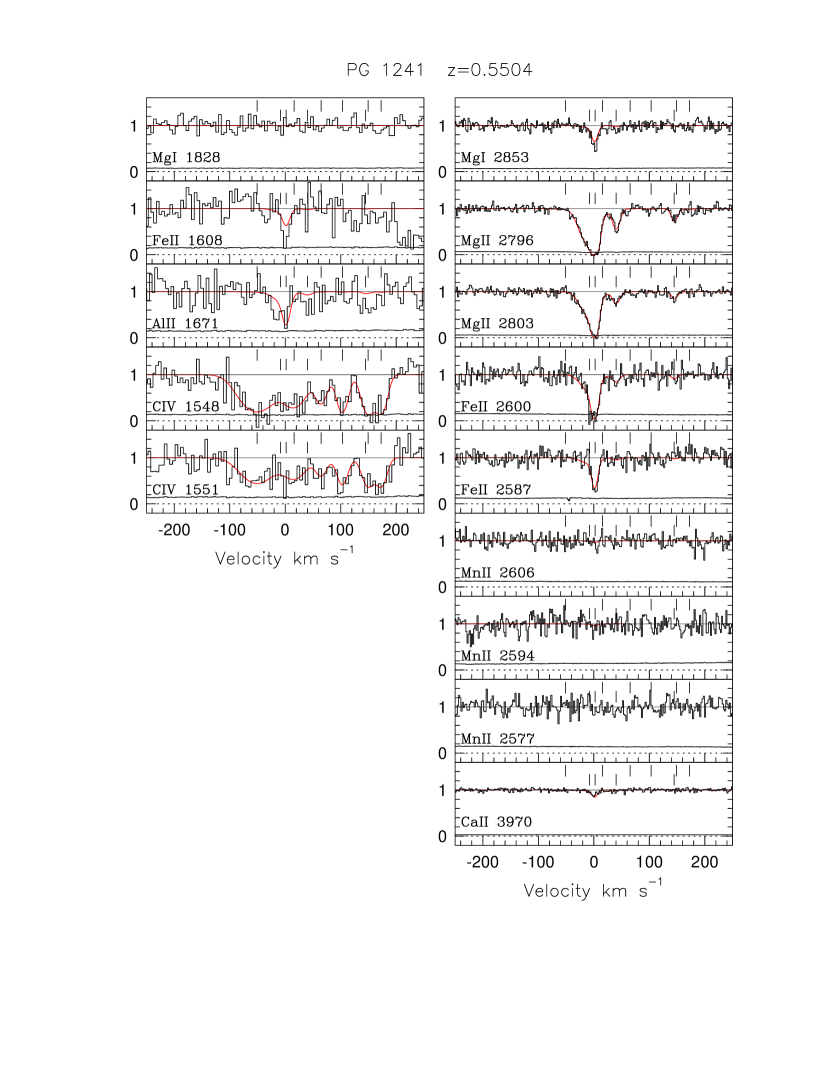
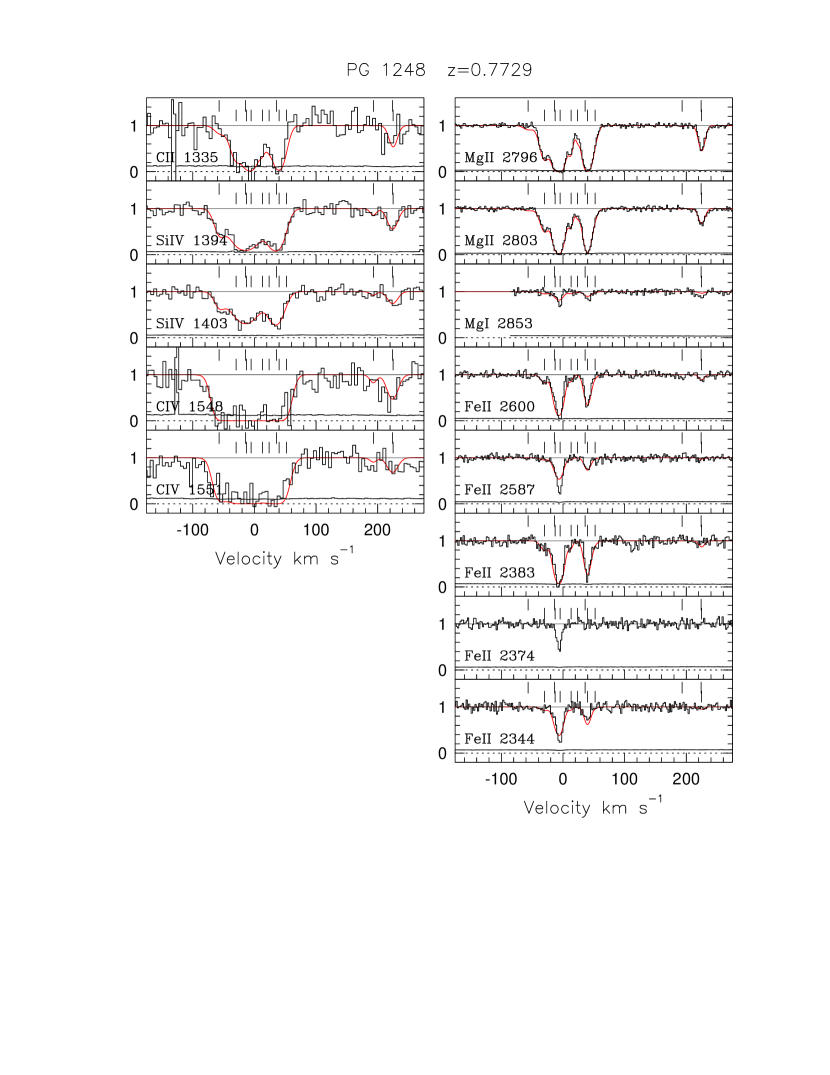
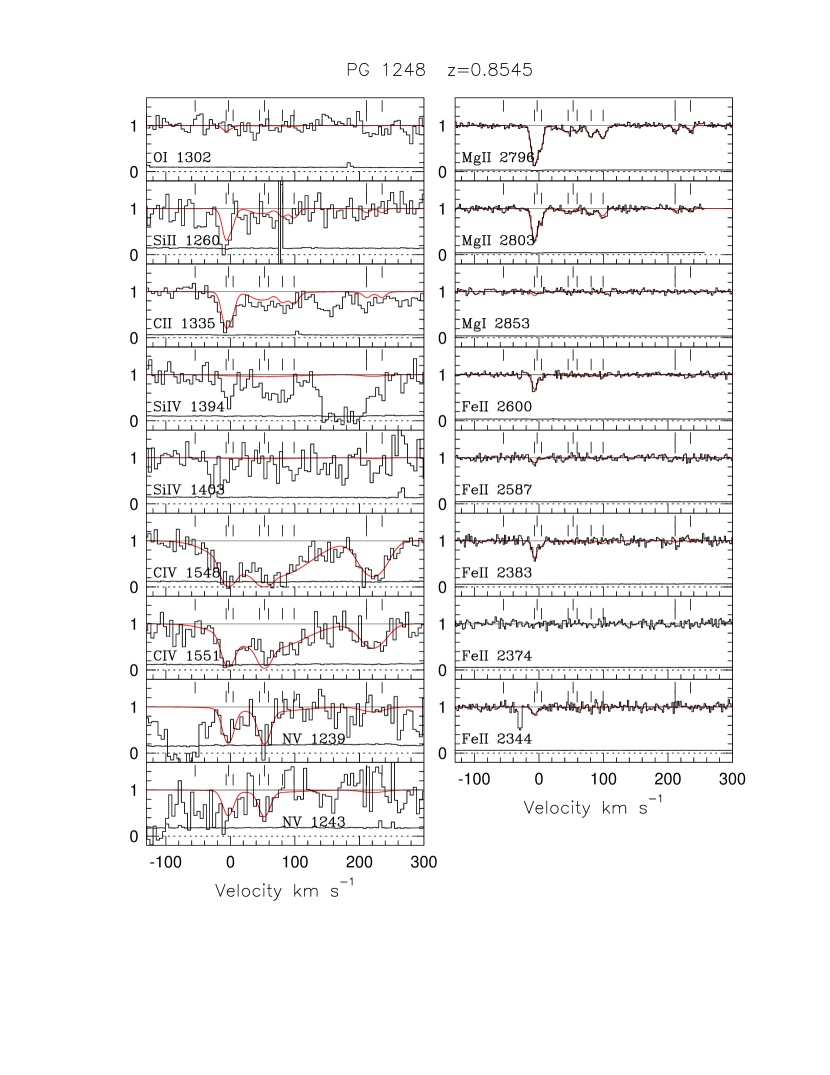
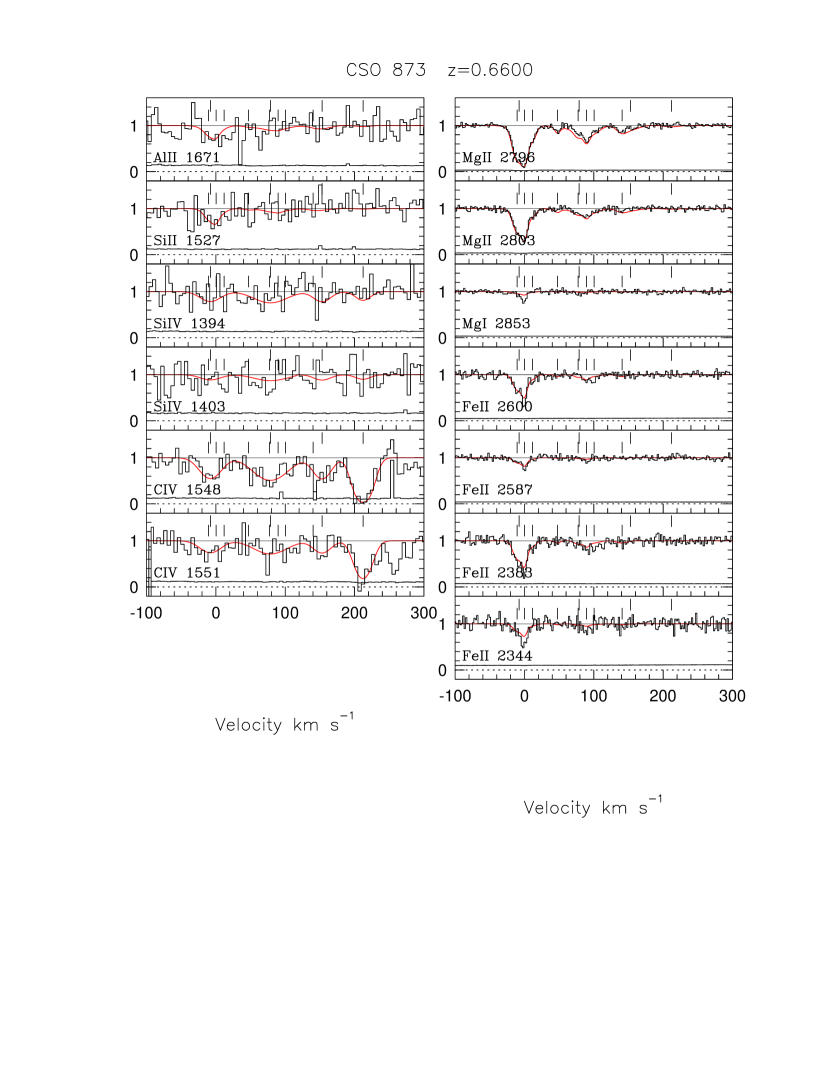
| Quasar | Date | Wavelength | Exposure | Date | Wavelength | Exposure |
|---|---|---|---|---|---|---|
| Å | s | Å | s | |||
| PG | June | – | January | – | ||
| PG | July | – | January | – | ||
| PG | January ; June | – | ; | January | – |
Note. — Detailed observing information is listed in the table. Ultraviolet and optical spectra are obtained with HST/STIS () and Keck/HIRES (), respectively. The date, wavelength coverage, and total exposure time of HST/STIS observation are listed in columns , , . The Keck/HIRES information is listed in columns , , .
| Quasar | B-K | Impact Parameter | Morphology | |||
|---|---|---|---|---|---|---|
| [] | [] | [ kpc] | ||||
| PG | ||||||
| PG | ||||||
| PG | spiral |
Note. — The B–band and K–band luminosities, rest–frame B-K color, and the impact parameter are listed for individual galaxies that are detected in the quasar field, along with the redshift of the corresponding absorption systems. All galaxy information is taken from Churchill et al. (1996), except for morphology which is taken from Steidel et al. (2002).
| Quasar | System | Mgii (Å) | Mgi (Å) | Feii (Å) | Civ (Å) |
|---|---|---|---|---|---|
| PG | |||||
| PG | |||||
| PG |
Note. — This table lists the rest–frame equivalent widths for Mgii , Mgi , Feii , and Civ in all 6 systems, with the value for each measurement included. If the transition is not detected, then a level limit is given.
| Cloud | Optimized | Velocity | b | Z | T | Size | Density | ||||
|---|---|---|---|---|---|---|---|---|---|---|---|
| Number | Transition | [km s-1] | [cm-2] | [km s-1] | [Z☉] | [cm-2] | [cm-2] | [K] | [kpc] | [cm-3] | |
| One–Phase Model | |||||||||||
| Civ | |||||||||||
| Two–Phase Model | |||||||||||
| Mgii | |||||||||||
| Civ | |||||||||||
Note. — Model parameters for the system at . A fit of this model is superimposed on the data in Fig. 1. Column densities are listed in logarithmic units.
| Cloud | Optimized | Velocity | b | Z | T | Size | Density | ||||
|---|---|---|---|---|---|---|---|---|---|---|---|
| Number | Transition | [km s-1] | [cm-2] | [km s-1] | [cm-2] | [cm-2] | [Z☉] | [K] | [kpc] | [cm-3] | |
| Mgii | |||||||||||
| Mgii | |||||||||||
| Mgii | |||||||||||
| Mgii |
Note. — The same as Table 4, except for the system at .
| Cloud | Optimized | Velocity | b | Z | T | Size | Density | ||||
|---|---|---|---|---|---|---|---|---|---|---|---|
| Number | Transition | [km s-1] | [cm-2] | [km s-1] | [cm-2] | [cm-2] | [Z☉] | [K] | [kpc] | [cm-3] | |
| Mgii | |||||||||||
| Mgii | |||||||||||
| Mgii | |||||||||||
| Mgii | |||||||||||
| Civ | |||||||||||
| Civ | |||||||||||
| Civ | |||||||||||
| Civ | |||||||||||
| Civ | |||||||||||
| Civ |
Note. — The same as Table 4, except for the system at . An abundance pattern adjustment of Ca by dex has been applied to Mgii cloud .
| Cloud | Optimized | Velocity | b | Z | T | Size | Density | ||||
|---|---|---|---|---|---|---|---|---|---|---|---|
| Number | Transition | [km s-1] | [cm-2] | [km s-1] | [cm-2] | [cm-2] | [Z☉] | [K] | [kpc] | [cm-3] | |
| Mgii | |||||||||||
| Mgii | |||||||||||
| Mgii | |||||||||||
| Mgii | |||||||||||
| Mgii | |||||||||||
| Mgii | |||||||||||
| Mgii | |||||||||||
| Mgii | |||||||||||
| Siiv | |||||||||||
| Siiv | |||||||||||
| Siiv | |||||||||||
| Siiv | |||||||||||
| Siiv |
Note. — The same as Table 4, except for the system at . An –enhancement of dex was applied to Siiv clouds and .
| Cloud | Optimized | Velocity | b | Z | T | Size | Density | ||||
|---|---|---|---|---|---|---|---|---|---|---|---|
| Number | Transition | [km s-1] | [cm-2] | [km s-1] | [cm-2] | [cm-2] | [Z☉] | [K] | [kpc] | [cm-3] | |
| Mgii | |||||||||||
| Mgii | |||||||||||
| Mgii | |||||||||||
| Mgii | |||||||||||
| Mgii | |||||||||||
| Mgii | |||||||||||
| Mgii | |||||||||||
| Mgii | |||||||||||
| Civ | |||||||||||
| Civ | |||||||||||
| Civ | |||||||||||
| Nv |
Note. — The same as Table 4, except for the system at .
| Cloud | Optimized | Velocity | b | Z | T | Size | Density | ||||
|---|---|---|---|---|---|---|---|---|---|---|---|
| Number | Transition | [km s-1] | [cm-2] | [km s-1] | [cm-2] | [cm-2] | [Z☉] | [K] | [kpc] | [cm-3] | |
| Mgii | |||||||||||
| Mgii | |||||||||||
| Mgii | |||||||||||
| Mgii | |||||||||||
| Mgii | |||||||||||
| Mgii | |||||||||||
| Mgii | |||||||||||
| Mgii | |||||||||||
| Civ | |||||||||||
| Civ | |||||||||||
| Civ | |||||||||||
| Civ |
Note. — The same as Table 4, except for the system at .