Models of Accreting Gas Giant Protoplanets in Protostellar Disks
We present evolutionary models of gas giant planets forming in protoplanetary disks. We first consider protoplanet models that consist of solid cores surrounded by hydrostatically supported gaseous envelopes that are in contact with the boundaries of their Hill spheres, and accrete gas from the surrounding disk. We neglect planetesimal accretion, and suppose that the luminosity arises from gas accretion alone. This generally occurs on a long time scale which may be comparable to the protostellar disk lifetime. We classify these models as being of type A, and follow their quasi static evolution until the point of rapid gas accretion is reached.
We consider a second class of protoplanet models that have not hitherto been considered. These models have a free surface, their energy supply is determined by gravitational contraction, and mass accretion from the protostellar disk that is assumed to pass through a circumplanetary disk. An evolutionary sequence is obtained by specifying the accretion rate that the protostellar disk is able to supply. We refer to these models as being of type B. An important result is that these protoplanet models contract quickly to a radius and are able to accrete gas from the disk at any reasonable rate that may be supplied without any consequent expansion (e.g. a Jupiter mass in few years, or more slowly if so constrained by the disk model). We speculate that the early stages of gas giant planet formation proceed along evolutionary paths described by models of type A, but at the onset of rapid gas accretion the protoplanet contracts interior to its Hill sphere, making a transition to an evolutionary path described by models of type B, receiving gas through a circumplanetary disk that forms within its Hill sphere, which is in turn fed by the surrounding protostellar disk.
We consider planet models with solid core masses of 5 and 15 M⊕, and consider evolutionary sequences assuming different amounts of dust opacity in the gaseous envelope. The initial protoplanet mass doubling time scale is very approximately inversely proportional to the magnitude of this opacity. Protoplanets with 5 M⊕ cores, and standard dust opacity require years to grow to a Jupiter mass, longer than reasonable disk life-times. A model with 1 % of standard dust opacity requires years. Rapid gas accretion in both these cases ensues once the planet mass exceeds M with substantial time spent in that mass range.
Protoplanets with 15 M⊕ cores grow to a Jupiter mass in years if standard dust opacity is assumed, and in years if 1 % of standard dust opacity is adopted. In these cases , the planet spends substantial time with mass between 30 – 40 M⊕ before making the transition to rapid gas accretion. We emphasize that these growth times apply to the gas accretion phase and not to the prior core formation phase.
According to the usual theory of protoplanet migration, although there is some dependence on disk parameters, migration in standard model disks is most effective in the mass range where the transition from type A to type B occurs. This is also the transitional regime between type I and type II migration. If a mechanism prevents the type I migration of low mass protoplanets, they could then undergo a rapid inward migration at around the transitional mass regime. Such protoplanets would end up in the inner regions of the disk undergoing type II migration and further accretion potentially becoming sub Jovian close orbiting planets. Noting that more dusty and higher mass cores spend more time at a larger transitional mass that in general favours more rapid migration, such planets are more likely to become close orbiters.
We find that the luminosity of the forming protoplanets during the later stages of gas accretion is dominated by the circumplanetary disk and protoplanet-disk boundary layer. For final accretion times for one Jupiter mass in the range the luminosities are in the range and the characteristic temperatures are in the range However, the luminosity may reach for shorter time periods at the faster rates of accretion that could be delivered by the protoplanetary disk.
Key Words.:
accretion, accretion disks — solar system: formation — planetary systems1 Introduction
Planets are believed to form out of protostellar disks by either gravitational instability (Cameron 1978; Boss 1998) or by a process of growth through planetesimal accumulation followed, in the giant planet case, by gas accretion (Safronov 1969; Wetherill & Stewart 1989; Mizuno 1980). It is the latter mechanism that we consider in this paper.
The process is presumed to begin with the accumulation of the solid cores by the accretion of planetesimals typically exceeding a kilometer in radius which have been formed through the collisional growth and sedimentation of dust grains in the protoplanetary disk (see Lissauer 1993 and references therein). Once the solid core becomes massive enough a significant gaseous atmosphere forms. The mass required depends to some extent on physical conditions in the disk, the rate of planetesimal accretion and the dust opacity but is typically several earth masses (eg. Mizuno 1980; Stevenson 1982; Bodenheimer & Pollack 1986). This is consistent with models of Jupiter which indicate that it has a solid core typically of this magnitude (Podolak et al. 1993). We note, however, that more recent models suggest that Jupiter’s core may be less massive than previously thought (Saumon & Guillot 2004). Models of Saturn still indicate a core mass of M⊕.
During the early build up of the core the luminosity is due to the liberation of gravitational energy by accreting planetesimals. However, once the mass of the gaseous envelope starts to become significant the gravitational settling of the gas becomes important and at some cross over point becomes dominant (Pollack et al. 1996). At this point models assuming strict thermal equilibrium break down. This is manifest through the fact that for fixed luminosity due to planetesimal accretion, there is a maximum or critical core mass for which a strict thermal equilibrium model can be constructed (see eg. Papaloizou & Terquem 1999). Beyond this point the evolution is no longer in thermal equilibrium and if the protoplanet remains in contact with adequate disk material, gas accretion may ensue.
The purpose of this paper is to examine the protoplanet models subsequent to the attainment of the critical core mass in the context of the protoplanetary disk environment and disk planet interactions. We assume that the core becomes isolated from further planetesimal accretion so that settling of accreted gas is the only energy source. The rationale for this assumption is discussed in section 4.2. We consider two types of model. The first type, which we denote as type A, is fully embedded in the protostellar disk and hence has an effective radius equal to that of the Roche lobe or Hill sphere. This is the correct radius to use rather than the Bondi radius which is never significantly smaller for any of the models we study. At some mass, these models tend to enter a rapid accretion phase. This occurs when the planet mass denoting a Jupiter mass, and is similar to that for which either significant perturbation to the protoplanetary disk through local mass accretion or disk–planet interaction begins (e.g. Nelson et al. 2000). These processes eventually lead to gap formation. Accordingly we consider models of a second type , type B, which are no longer enveloped at the Roche lobe but are assumed to have a free surface and accrete from a circumplanetary disk at a rate determined by the external throughput from the protostellar disk. We find that these can be constructed for a wide range of accretion rates indicating that during the later stages a forming protoplanet can comfortably accrete at any rate reasonably supplied by the protostellar disk.
We supplement these models of protoplanet evolution with hydrodynamical simulations of the interaction between low mass protoplanets and protostellar disks. The purpose of these models is to establish plausible accretion times scales for the freely accreting protoplanet models of type B.
This paper is organised as follows. We present the basic equations for the protoplanet models in section 2, and discuss the appropriate boundary conditions in section 3. In section 4 we describe how evolutionary sequences are constructed for protoplanet models of type A and B, accounting for gas accretion from the protostellar disk. We discuss the numerical procedure adopted for the hydrodynamic simulations of disk-planet interactions in section 5. The results of our calculations are presented in section 6, and their implications are discussed in section 7. Finally we draw our conclusions in section 8.
2 Basic Equations for the Protoplanet Models
We adopt the approach of previous workers (eg. Bodenheimer & Pollack 1986; Pollack et al. 1996) and approximate the protoplanetary structure as being spherically symmetric, the approach being similar to that followed in modeling stellar structure. Many of the details are given in Papaloizou & Terquem (1999).
The interior state variables at any point in a model are functions only of the distance to the centre, also characterized as the spherical polar radius. We assume the models are in hydrostatic equilibrium and neglect rotation. The equation of hydrostatic equilibrium is
| (1) |
Here, the pressure is the local acceleration due to gravity is with being the mass, including that of any solid core, interior to radius and is the gravitational constant. The mass interior to radius satisfies
| (2) |
where is the density.


For the calculations presented here, we adopt the equation of state for a hydrogen and helium mixture given by Chabrier et al. (1992). The mass fractions of hydrogen and helium are taken to be 0.7 and 0.28, respectively. The luminosity transported by radiation satisfies
| (3) |
where and are the radiation constant, the speed of light, the temperature and the opacity respectively. The calculations reported here are based on the opacities given by Bell & Lin (1994). These, being functions of density and temperature, include contributions from molecules, atoms, ions and dust grains. The latter produce an increase in the opacity amounting to several orders of magnitude for
2.1 Inner Convective Regions
Most of the gas mass within the models is unstable to convection so a theory of energy transport by convection is needed. We adopt the conventional mixing length theory (eg. Cox & Giuli 1968).
The radiative and adiabatic temperature gradients and are defined through
| (4) |
and
| (5) |
with the subscript denoting evaluation at constant entropy. is a quantity determined directly from the thermodynamics of the equation of state alone.
The total luminosity is During the phase of solid core growth it is expected that this is produced by the gravitational energy of accreting planetesimals (e.g., Mizuno 1980; Bodenheimer & Pollack 1986). However, for the later phases considered here, the source of energy is primarily settling and accretion of gas (see section 4.2).
When , the gas is convectively stable and the energy is transported entirely by radiation. On the other hand when the medium is convectively unstable and some of the energy is transported by convection. We write the total luminosity passing through a sphere of radius as , where is the luminosity associated with convection. Adopting the mixing length theory (Cox & Giuli 1968) we have
| (6) | |||||
where is the mixing length, being a constant parameter expected to be of order unity, , and the subscript denotes evaluation at constant pressure. We adopt the mixing length parameter .
3 Boundary Conditions
3.1 The Inner Boundary
We assume that there is a solid core of mass with a uniform mass density g cm-3 (eg. Papaloizou & Terquem 1999). The boundary condition the models that calculate the structure of the gaseous envelope must satisfy is that the total mass when
| (7) |
For models with no source of accretion energy at the core surface, such as those considered here, we also require However, the model interiors are convective with radiation making negligible contribution to the heat transport, accordingly adiabatic stratification is a good approximation near the inner boundary independently of any reasonable value for with the consequence that we do not actually need to enforce the condition there.
3.2 The Outer Boundary
We here consider two different classes of model which have differing boundary conditions. We consider each of these in turn.
3.2.1 Enveloped Models in Contact with the Roche Lobe
For these models, subsequently denoted as of type A, we assume the structure extends to the Roche lobe or boundary of the Hill sphere beyond which material must be gravitationally unbound from the protoplanet. For this radius we adopt
| (8) |
where is the total planet mass including gas and solid core and is the orbital radius or distance of the protoplanet, assumed in circular orbit, from the central star. The structure state variables are assumed to eventually join smoothly to those associated with the enveloping protoplanetary disk where and , respectively.
Thus the boundary conditions are that at , and the temperature is given by
| (9) |
where with denoting the total luminosity escaping from the surface.
Here we approximate the additional optical depth above the protoplanet atmosphere, through which radiation passes, by (Papaloizou & Terquem 1999)
| (10) |
This expresses the fact that must exceed at in order that the luminosity be radiated away from the protoplanet into the surrounding disk. In practice it is found for the models here that always only slightly exceeds – i.e. is effectively small at (see figures 3 and 4 below ).
For most models we adopt disk parameters appropriate to 5AU from the disk model of Papaloizou & Terquem (1999) with Shakura & Sunyaev (1973) and steady state accretion rate of Accordingly and dyn cm-2.
3.2.2 Models with Free Boundary Accreting from the Protostellar Disk
In contrast to embedded models of type A, we can consider models that have boundaries detatched from and interior to the Roche lobe which still accrete material from the external protoplanetary disk that orbits the central star. This is expected as numerical simulations of disk planet interactions have shown that once it becomes massive enough a protoplanet forms a gap in the disk but is still able to accrete from it through a circumplanetary disk (see eg. Kley 1999; Nelson et al. 2000; Lubow, Siebert & Artymowicz 1999). We thus consider models with free boundaries which are able to increase their mass and liberate gravitational energy through its settling. We subsequently refer to such models as type B.


For these models, in contrast to those of type A, the effect of the exterior disk material on the surface boundaries is small. Thus for the boundary condition on we again adopt equation (9) but with . We note for these models is in general significantly larger than For the boundary condition on we adopt
| (11) |
which is the conventional stellar structure boundary condition (eg. Schwarzschild 1958) but with the addition of the background pressure which in fact for these models makes only a small contribution.
In order to have a complete system for which the evolution can be calculated equations (1)- (6) need to be supplemented by an equation governing internal energy production and the internal luminosity, normally the first law of thermodynamics. Here we simplify matters by using the fact that most of the internal energy of the models is contained within a deep convection zone. The thermal time scale associated with relaxation of the exterior layers is expected to be much shorter than the thermal relaxation time scale associated with the model as a whole. Under these conditions, if the model evolution time scale is on the global Kelvin-Helmholtz time scale or longer, it is a reasonable assumption that is constant in the outer layers. Because of efficient convection the inner convection zone is unaffected by the distribution of Accordingly we make the assumption that is constant in the outer layers. This is expected to hold during the longest lasting evolutionary phases for all masses and and at all times for the larger masses which tend to have only a very thin surface radiative shell, but we bear in mind that it may fail when the evolution time becomes very short. With the above assumption we obtain a complete system for which the evolution may be calculated.
4 Accretion, Settling and Evolutionary Sequences
The models we consider here provide an evolutionary sequence with their mass increasing through accretion from the protoplanetary disk. This material also liberates gravitational energy as it settles. To describe their evolution we consider the total energy of the protoplanet within the Roche lobe
| (12) |
Here is the internal energy per unit mass and we neglect the energy involved in bringing material from to the Roche lobe. This is justified because most of the mass is concentrated well inside it where the specific energies are much higher.
4.1 Models of Type A
We now consider models of type A. From the theory of stellar structure, if the source of energy was specified, a model would be uniquely determined once is specified. Not specifying the source of energy leaves one free parameter. However, because the radius is specified as a function of through the Roche lobe condition, this freedom is lost so that the models do form a one parameter family specified by Accordingly we may write
When such a model increases its mass slightly so that the change of energy content is If the energy change balances losses by radiation in time dt, then conservation of energy requires that
| (13) |
with being the luminosity at the surface. This determines the evolution of models of type A.
4.2 Models of Type B
In contrast to models of type A, for an assumed externally supplied accretion rate, models of type B form a two parameter family in that, without specification of the energy source, and given their freedom to determine their own radius, they require specification of both and in order for a model to be constructed. Thus Accordingly for small changes in mass, and luminosity the change in is
| (14) |
Now for these models, matter is presumed to join the protoplanet on its equator after having accreted through a circumplanetary disk. In this case we assume the accretion rate to be prescribed by the dynamics of the disk–planet interaction while gap formation is taking place. This is found to be the case from simulations of disk–planet interactions where it is found that an amount of material comparable to that flowing through the disk may be supplied to the protoplanet (Kley 1999; Nelson et al. 2000; Lubow Siebert & Artymowicz 1999; and simulations presented in section 6.2).
In arriving there all available gravitational binding energy of per unit mass, being the surface radius, has been liberated and so an amount of energy must be subtracted from in order to obtain the energy available to replace radiation losses.
Therefore if the changes occur over an interval we must have
Thus total energy conservation for models of type B enables the calculation of evolutionary tracks through.
| (15) |
Note that as we regard the accretion rate as specified for these models, equation (15) enables the evolution of to be calculated.
Thus equations (13) and (15) constitute the basic equations governing the evolution of models of type A and type B respectively.
Note that we neglect any input from planetesimal accretion during and after the phase when the core becomes critical. The primary reason for doing this is that we are interested in examining the fastest time scales possible for giant planet formation via the core instability scenario. The inclusion of planetesimal accretion and the associated accretion luminosity will have the effect of lengthening the time scale of formation, provided that the core mass itself does not increase significantly. However, there are also uncertainties about how large the planetesimal accretion rate ought to be.
Previous work on the formation of gas giant planets via the core instability model assumed that core formation can proceed through runaway growth in which a protoplanetary core can grow by accreting essentially all planetesimals in its feeding zone (e.g. Pollack et al. 1996). This resulted in a core formation time of few years. Simulations by Ida & Makino (1993) indicate, however, that runaway growth slows down prior to the completion of core formation, and proceeds through a more orderly mode of planetesimal accretion known as oligarchic growth. This arises because neighbouring planetary embryos stir up the random motions of the planetesimal swarm, reducing the effectiveness of gravitational focusing. N-body simulations of protoplanetary core formation indicate that obtaining cores of the necessary mass is not an easy task to achieve during the oligarchic growth phase, in part due to planetary cores of a few M⊕ repelling the surrounding planetesimals and opening gaps in the planetesimal disk, and in part due to the excitation of planetesimal eccentricities and inclinations by the ‘oligarchs’ (e.g. Thommes, Duncan & Levison [2003]).
After core formation, and during the longest phase of evolution involving gas settling onto the core, the calculations of Pollack et al. (1996) result in planetesimal accretion rates that are a factor of times smaller than those of the gas accretion rate, and this planetesimal accretion results in significant accretion luminosity. This planetesimal accretion arises because the feeding zone expands as the planet mass increases due to gas accretion, and depends on the strict assumption that planetesimals are not allowed to enter or leave the feeding zone. Thus the possibility of gap formation in the planetesimal disk, as found by Thommes et al. (2003), is not accounted for in these models, although one may reasonably expect its effect to be increasingly important as the planet mass increases.
The generation of significant luminosity from planetesimal accretion depends on where it is assumed the energy is deposited within the protoplanet. Large (100 km) planetesimals are able to penetrate deep into the planetary interior, and so provide a significant source of energy by virtue of descending deep into the gravitational potential well. Smaller planetesimals or fragments are more likely to dissolve higher up in the planet atmosphere, and so will contribute less accretion luminosity. A possible resolution of the long time scales of formation for planetary cores reported by Thommes et al. (2003) is that collisions between planetesimals result in fragmentation when their random motions are excited by the forming planetary embryos (e.g. Rafikov 2004). This possible generation of smaller planetesimals results in increased efficiency of gas drag by the nebula in damping random motions, thus speeding up planetesimal accretion by planetary embryos. This potential modification of the size distribution will also have an impact on the accretion luminosity generated by accreted planetesimals.
In the light of these uncertainties in the radial distribution and size distribution of planetesimals, and its effect on planetesimal accretion rates during the gas settling, and rapid gas accretion phase of giant planet formation, we believe it is justified to treat the planetesimal accretion rate and its associated luminosity generation as a free parameter of the problem. A similar approach has been argued for by Ikoma, Nakazawa & Emori (2000). As we are interested in examining the shortest possible time scales for giant planet formation, we neglect the effects of planetesimal accretion in this study.


5 Disk–Planet Simulations
In order to estimate the rate at which an accreting protoplanet can accrete gas from a protoplanetary disk, we performed hydrodynamic simulations of low mass protoplanetary cores embedded in viscous disk models. These simulations were performed with a modified version of the grid based hydrodynamics code NIRVANA (Ziegler & Yorke 1996).
5.1 Initial Setup and Boundary Conditions
The disk models are simple 2-D models with the initial surface density given by a power law . We set such that there are 0.02 interior to 40 AU, similar to the minimum mass solar nebula model. We assume a locally isothermal equation of state, and specify that the disk vertical thickness to radius ratio have a constant value . We model the angular momentum transport processes in the disk using a simple ‘alpha’ prescription for the disk viscosity in the Navier–Stokes equation – i.e. the kinematic viscosity is given by where is a parameter, is the sound speed, and is the local disk thickness. We consider values of and .
The number of grid cells used was . The inner boundary of the computational domain was placed at and the outer boundary at . Reflecting boundary conditions were used at both radial boundaries, and linear viscosity was used between and to reduce reflection of waves excited by the planet. The gravitational potential of the planet was softened using a softening parameter – i.e. half of the local disk semi–thickness.
Simulations were initiated by placing a low mass planet (either 15 or 30 Earth masses) at a radius in the disk. The planet was assumed to accrete gas that entered its Hill sphere. This was achieved by removing gas from any cells that lay within half of the planet Hill sphere. The e-folding time of this gas removal was , where . Thus this corresponds to the extreme case when the planet accretes material within the Hill sphere on the dynamical time scale. The gas that was removed from the Hill sphere was added to the planet at each time step, such that the planet mass is a function of time. Similar models are described in Nelson et al. (2000).
6 Protoplanet Model Calculations
We solve equations (1-6) with the boundary conditions described above to get the structure of the protoplanet models.
For a fixed accretion rate onto a core at a given radius, there is a critical core mass above which no solution can be found in hydrostatic and thermal equilibrium that joins on to the protoplanetary disk model assumed at the Roche lobe.
In this paper we consider cores with and Our evolutionary calculations commence close to the state when the cores are critical, that is no further gas can be added in strict hydrostatic equilibrium. At this stage the evolution is slowest and we compute a type A model sequence by use of equation (13). These models are in contact with the Roche lobe.
We also construct type B model sequences. These satisfy the free surface boundary conditions given by equations (9) and (11). Because the surface is free, these form a two parameter sequence in that evolutionary tracks for a given mass can be started for a range of radii (or equivalently the luminosity may be used as a parameter). This the same situation as in standard pre–main sequence contraction where a stellar model of a given mass can be started at different points on an evolutionary track corresponding to different radii.
We have considered models using the Bell & Lin (1994) opacities hereafter referred to as standard. These have a very large contribution from dust grains for and because there is clearly some uncertainty about the disposition of the dust particularly under circumstances where the protoplanet is assumed isolated from further planetesimal accretion, we have explored the effect of reducing this contribution to the opacity by factors of up to for both models of type A and B. We have done this, by making the reduction for the opacity as a whole, for only, and with a reduction factor that is constant for and which then decreases linearly to unity at In practice we find that the results are essentially independent of whether such a linear join is made or not. The uncertainty in the magnitude of the surface opacity as well as its important role in controlling the evolutionary time scale of an embedded protoplanet has been pointed out by Ikoma Nakazawa & Emori (2000).
6.1 Models of Type A
We begin by describing some typical models of type A. In figure 1, state variables are plotted for a protoplanet model with which has a total mass As expected the deep interior of this model is convective with little energy transported by radiation. However, there are two convective regions which occur for and Approximately ninety eight percent of the mass is in the inner convective zone. This means that most of the thermal inertia is contained within the deep convection zone rendering the assumption of little spatial variation of the luminosity in the upper layers a reasonable approximation. The existence of two separate convective regions is in contrast to what we find for models of type B that approach In those cases we find a single interior convection zone for with negligible mass in the outer radiative region.


In figure 2, we illustrate the behaviour of the state variables for a protoplanet model with the smaller core mass. The total mass is This has similar properties to the previous case regardless of the fact that the core mass is three times smaller. Convective heat transport occurs when and when The inner eighty percent of the mass is convective.
In figure 3 we illustrate the evolution of models of type A for Cases with standard opacities and with opacity reductions of three, ten and one hundred made globally and for are shown. In all cases as the models gain in mass from the protoplanetary disk their luminosity increases and their evolutionary time measured through their accretion time decreases. In the standard opacity case the accretion time is very long, exceeding However, this time reduces by the opacity reduction factor independently of where this is applied even though the situation might have appeared to have been complicated by the existence of two convective regions. Thus times are attained for reduction factors of one hundred.
The evolutionary time scale of the models begins to decrease rapidly once , becoming less that even for the standard opacity case. This phenomenon, which is sensitive to relatively minor model details, can be traced to the fact that becomes small or that less and less binding energy is liberated as the mass increases. This is likely to indicate the onset of a rapid collapse and possible detachment from the Roche lobe. As the effect of disk planet interactions and local gas depletion are likely to become important, we have not tried to follow such rapid evolution with the simplistic models adopted here. Rather we have considered evolutionary sequences of type B which are likely to be the outcome. Although the position where such a sequence is joined cannot of course be determined without considering the above rapid phase of evolution.
Figure 3 also shows that the effective temperature needed to supply the luminosity of the model, is always small when compared to the surrounding protostellar disk temperature. This indicates negligible thermal perturbation of the protostellar disk.
In figure 4 we illustrate the evolution of models of type A for but for two models with standard opacity For these models the longest evolutionary times are in the range. The attainment of short evolutionary times likely leading to detachment from the Roche lobe occurs for in this case. The two models illustrated differ in surface boundary conditions. The model illustrated with dotted curves is embedded in a disk with the same temperature but with a density ten times larger than usual. Except during the beginning of the rapid evolution phase the models show very similar behaviour.
In figure 4 we also plot evolutionary tracks for which the opacity was reduced by factors of ten and one hundred in the surface layers for which with a linear transition to standard opacities occurring for For these sequences the transition mass is unaffected but the evolutionary time scales are factors of three and thirty faster respectively. This means that the formation time scale is reduced to in the latter case.
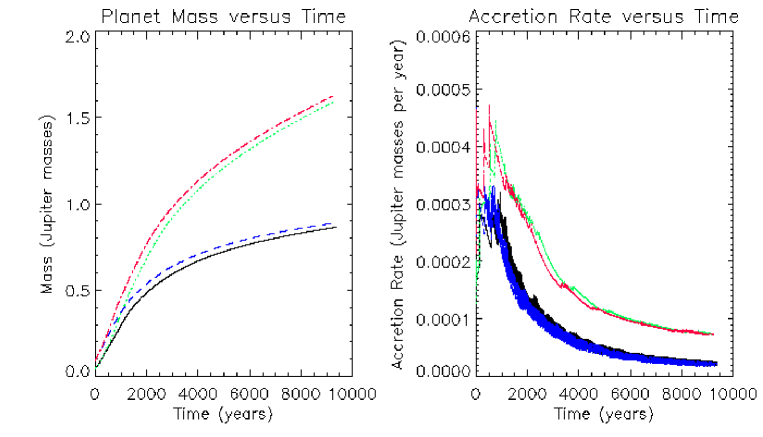
6.2 Planet Accretion Rates
As described in section 4.2, the planetary models that we construct with a free surface require a gas accretion rate to be specified. We have performed simulations of low mass protoplanets embedded in protoplanetary disks to estimate the accretion rate onto a protoplanet that may be supplied by a protoplanetary disk, using different assumptions about the initial planet mass and disk viscosity. The results of these simulations are presented in figure 5. The left hand panel shows the evolution of the planet mass, and the right hand panel shows the accretion rate as a function of time. We considered initial protoplanet masses of and 30 Earth masses, and viscosities with and . The solid line in figure 5 shows the model with M⊕ and . The dashed line shows the model with M⊕ and . The dotted line shows the model with M⊕ and , and the dot-dashed line shows the model with M⊕ and . It is clear that the initial mass assumed for the protoplanet is unimportant as the models quickly converge. However, quite differing evolutionary sequences are obtained as a function of disk viscosity. For higher viscosity, a protoplanet that is thermodynamically permitted to accrete gas rapidly from a disk can grow to become a Jupiter mass in around 3000 years. For lower viscosity the growth time can be extended considerably, with an requiring a time years for a Jupiter mass planet to form. The simulations presented here are too low in resolution to model the circumplanetary disk that is expected to form around the accreting protoplanet or its interaction with it, and in principle the requirement that material accrete through this circumplanetary disk before reaching the planet surface could act as a bottle neck and significantly extend these accretion time scales. However, simple estimates of the accretion time through such a circumplanetary disk, and the accretion rates obtained from high resolution 3-D simulations (e.g. D’Angelo, Kley & Henning 2003) suggest that this is not the case. These high resolution simulations indicate that the circumplanetary disk that forms within the planetary Hill sphere has a radius where is the Hill sphere radius. The viscous evolution time through a disk of such radius is
where is the kinematic viscosity, being the sound speed at the outer edge of the circumplanetary disk, and being the disk semi–thickness there. The viscous time scale may be expressed in units of the planet orbital period as
We note that , where is the Mach number of the flow in the outer regions of the circumplanetary disk. Simulations by D’Angelo, Henning, & Kley (2003), that account for heating and cooling of the circumplanetary disks, results in Mach numbers of in their outer parts, indicating that these disks are rather thick. If we adopt the values of used in the numerical simulations, we estimate ‘that the accretion time through the circumplanetary disk is yr for , and yr for . These time scales should be compared with the mass accretion times presented in figure 5. For the runs the mass doubling time scale is found to be yr. For this accretion time is yr. This suggests that the simple prescription for modeling mass accretion in the simulations does not significantly affect the long term accretion times presented, as the protostellar disk supplies mass to the protoplanet on time scales longer than reasonable accretion times through the circumplanetary disk. We note, however, that more detailed 3D simulations including a proper account of the thermodynamic evolution of the gas will be required to definitively settle this question.
The accretion times obtained in figure 5 range from a few thousand years to a few tens of thousands of years, and show that the actual accretion time obtained is sensitive to the disk viscosity assumed. In the planet models of type B presented below, we consider accretion times of between to years. These cover the accretion times obtained for a protoplanet on short time scales in the extreme case when it is immersed ab initio into an unperturbed disk as in the above simulations. They also allow for the situation where there is gas depletion such that the protoplanet can only accrete for longer time scales at an assumed mass flow rate through the protostellar disk of
6.3 Models of Type B
Figure 6 illustrates the evolution of protoplanet models which accrete from the protoplanetary disk at an assumed fixed rate of in This accretion rate corresponds to which is typical of T Tauri disks, but it leads to a rapid final accretion time for a Jupiter mass if most of this is accreted by the protoplanet as is indicated by the simulations of disk–planet interaction presented in section 6.2 (see also Kley [1999]). The models have For these models the duration of the evolution is determined by the accretion rate and is terminated when the protoplanet reaches The four models shown correspond to different starting masses and luminosities. For a given mass is it is possible to start with a range of luminosities or for the same luminosity it is possible to start with a range of masses. Here the dashed and dot–dashed curves correspond to models which start with almost the same mass but very different luminosities while the dotted and dashed curves start with the same luminosity but differ in mass by a factor of The resulting evolutionary tracks tend to show convergence as time progresses especially in the case of the radius which ends up in the range after The models attain for most of the evolution. However the luminosity expected from circumplanetary disk accretion erg s-1 is only approached by the most luminous model.

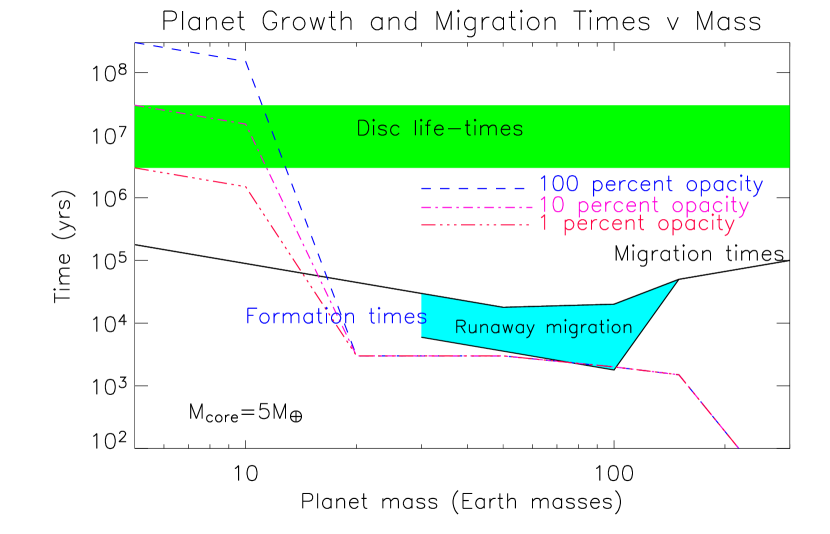
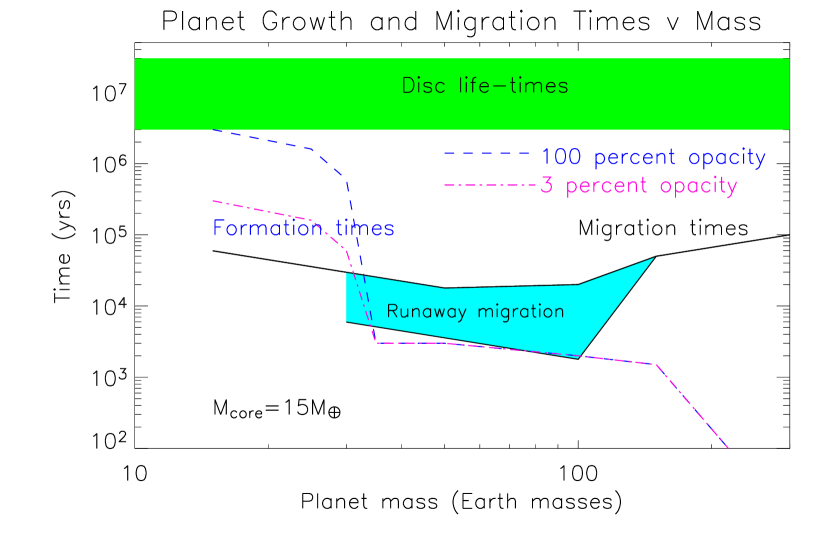
Figure 7 illustrates evolutionary tracks for a fixed assumed accretion rate that is ten times slower. As a consequence of this the evolution times are ten times longer. The convergence of the evolutionary tracks is greater in this case with all radii being close to after The indication is that values of for these models are sustained for However, the luminosity expected from circumplanetary disk accretion at the later phases erg s-1 (calculated adopting a radius of cm for the protoplanet) is only exceeded at early times by the most luminous model which then becomes fainter at later times. But note that for this sequence of models and others presented later, models accreting from the disk can exist which have small luminosities the circumplanetary disk luminosity and also that due to the protoplanet disk boundary layer, equal to (see eg. Lynden-Bell & Pringle 1974).
In figure 8 we show tracks for an accretion rate of in for models with The behaviour is similar to that in the higher core mass case. In figure 9 we show models with with the same accretion rate which have opacities globally reduced by a factor of three and in figure 10 the reduction is by a factor of ten. In all of these cases there is a tendency of the tracks to converge especially the radii of different models to a value of about with the lower opacity models being slightly smaller. In all cases the protoplanet luminosities is exceeded at late stages by the circumplanetary disk luminosity.
In figure 11 we illustrate models with and standard opacities accreting from the disk at a rate that is ten times slower while in figure 12 the opacity is globally reduced by a factor of three at that accretion rate. In these cases the evolution is prolonged by a factor of These models are again similar to the previous ones and indicate that a model starting from one Saturn mass and radius could sustain effective temperatures for times approaching
Finally in figures 13 and 14 we explore models with subjected to a very high accretion rate from the disk at a rate of in with an opacity reduction by a factor of ten applied globally in the former case and applied only for in the latter. Paradoxically (see the discussion in section 7) these models may appear somewhat cooler and less intrinsically luminous than those calculated for lower accretion rates. However, convergence of model radii towards again occurs.
7 Discussion
7.1 Planetary Growth and Migration
In this section we discuss the evolutionary sequences associated with planetary models of type A and B in the context of disk–planet interactions and planetary migration.
7.1.1 5 M⊕ core models
In figure 15 we have plotted a schematic diagram showing the variation of planetary growth times as a function of planet mass for models with cores of 5 M⊕. Here we emphasize that the growth time referred to here and below apply to the gas accretion phase and not to the time required for the solid core to form. Also plotted in this diagram is a shaded region which shows the range of T Tauri disk life–times as inferred from infrared observations ( eg. Beckwith, Sargent, Chini & Guesten 1990; Sicilia - Aguilar et al. 2004) ranging between to years. We have also plotted migration times appropriate to a standard quiescent disk as a function of planet mass, where the migration rates are taken from Tanaka, Tacheuchi, & Ward (2002). We assume that the disk surface density scales as , that the disk surface density at 5 AU (assumed to be the planet semi major axis) is g cm-2, and that (in other words the model is similar to the minimum mass solar nebula model). In plotting this diagram we also take account of the fact that more massive planets begin to open gaps, and make a transition to type II migration (Ward 1997) , for which Jovian mass planets migrate on the viscous time scale (here assumed to be years). Also included is a shaded area for masses between 30 and 100 M⊕ that takes account the possibility of fast or runaway migration for this mass range (Masset & Papaloizou 2003). This can only occur for disk masses greater than the minimum mass solar nebula model. We make a rough estimate of the migration rate associated with runaway migration as being the type I rate for a disk surface density 5 times larger than the minimum mass model. We also assume that during runaway migration planets up to Saturn’s mass undergo migration at the appropriate type I rate, which is implied approximately by the results of Masset & Papaloizou (2003).
We plot the growth times for three different evolutionary models in figure 15. The dashed line represents the model with standard opacity, the dashed-dotted line the model with one tenth the standard opacity, and the dashed-dot-dot-dotted line the model with opacity reduced by a factor of 100. During the earliest phases of evolution the growth times of these models are , and years respectively. The two models with largest opacity are thus unable to form giant planets within the disk life–time. Such systems will result in rock and ice cores forming that are unable to accrete significant gas envelopes.
The lowest opacity model has a sufficiently low growth time that it will be able to form a giant planet before disk dispersal. However, figure 15 shows that during the early stages of evolution, while the planet mass is below M⊕, the growth time is significantly longer than the type I migration time scale, implying that the protoplanet will migrate into the central star before forming a gas giant. This is a problem for all reasonable core instability models of gas giant formation, since there exists a bottle neck for gas accretion while the planet mass is relatively small, but massive enough to undergo quite rapid migration. If the core instability model is correct, then we are inevitably led to the conclusion that some process must operate to prevent type I migration in a standard quiescent disk for at least some protoplanets in order that gas giant planets can form.
Although many issues remain outstanding, a number of processes may operate to prevent type I migration. Being the result of a linear disk response it depends on the temperature and density structure of the disk and special features such as rapid spatial variation of opacity may slow or stop migration (eg. Menou & Goodman 2004). Recent simulations by Nelson & Papaloizou (2004) and Nelson (2004) show that low mass planets migrating in magnetised, turbulent accretion disks undergo stochastic migration rather than monotonic inward migration. This leads to a distribution of migration rates for embedded planets, with some undergoing rapid inward migration, and others perhaps migrating outward or not at all. A well defined direction of migration is likely to occur when the planet mass is large enough to dominate over turbulent fluctuations, with simulations indicating that this is likely to arise for planet masses exceeding M⊕. The occurrence of global disk structures such as eccentric modes are also capable of disrupting both type I (Papaloizou 2002) and type II (Nelson 2003) migration, and if established within a disk are likely to be long lived entities. Finally, low mass planets on eccentric orbits may undergo type I torque reversal (Papaloizou & Larwood 2000). For an isolated planet the eccentricity is quickly damped, but a system of mutually interacting planetary cores may be able to maintain eccentric orbits and hence reduce or even prevent type I migration.
In light of these (and perhaps other) mechanisms for overcoming type I migration, which may operate in tandem rather than in isolation, we make the assumption that for masses below M⊕, type I migration is essentially ineffective for at least some protoplanets below that mass range, such that a population of giant planet can form. It seems likely that for planet masses larger than this, where the disk–planet interaction starts to become non linear, the ability of the planet to impose itself on the disk will lead to inward migration being re-established. When it does so figure 15 indicates it will be at near the maximum rate. The transition from type A to type B models is near to where Note that is likely to depend on location and parameters in the disk making it uncertain whether the protoplanet undergoes some rapid inward migration.
Returning to our discussion of the low opacity planet model in figure 15, we can see that once the planet mass reaches 20 M⊕ and moves to a type B track, the growth time of the planet decreases dramatically down to a value that is determined by the rate at which the protostellar disk can supply mass to the planet. It is at this stage that we suppose that the protoplanet undergoes a transition from being an extended structure in contact with its Roche lobe, and accreting slowly from the disk, to a more compact protoplanet with a free surface that accretes rapidly from the protostellar disk via a circumplanetary accretion disk. The type B models presented in figures 13 and 14 suggest that these compact models can accrete rapidly from the disk, and we specify a growth time of years for this stage of growth in figure 15, corresponding to the more rapid growth rates presented in figure 7. Such a rate ensures that the planet can grow to become a Jovian mass gas giant on a time scale shorter than any likely migration time.
7.1.2 15 M⊕ core models
In figure 16 we present a schematic diagram of growth and migration times for planet models with 15 M⊕ cores. This figure is very similar to figure 15. We have plotted evolutionary sequences for just two planet models in figure 16, one with standard opacity (dashed line) and one with three percent of the standard opacity (dashed-dotted line). During the earliest stages of accretion, these models have growth times of and years, respectively, which are comfortably within or below the range of expected disk life-times. In the latter case, the formation is very rapid, and illustrates the crucial role played by the opacity. However, the estimated quiescent disk migration time for an object with a mass of 15 – 20 M⊕ is below years, such that even the lower opacity model is unable to form within the expected type I migration time. We are again required to assume that type I migration is inoperative for some planets with masses below M⊕.
As shown in figure 4, the growth time for the standard opacity model presented in figure 16 remains larger than the corresponding migration time for planet masses up to M⊕, at which stage rapid gas accretion can ensue. Because such planet models spend longer time at these higher masses they may be more susceptible to undergoing a period of rapid migration either prior to or during the early stages of rapid gas accretion than are the models with lower core masses. This may be related to an indication that extrasolar planets in systems with high metallicity tend to be found at shorter periods commented on by Santos et al. (2003). However, because of the small numbers involved, the statistical significance of such a trend is not yet established.
The result of a rapid inward migration is that the planet will move into the inner regions of the disk where: (i) the local reservoir of disk material is reduced relative to larger radii; (ii) the disk aspect ratio decreases making gap formation and a transition to type II migration easier (Papaloizou & Terquem 1999). The result is likely to be a tendency for larger and more dusty cores to produce a distribution of planets with a greater bias toward low mass, short period objects.
7.2 Final Protoplanet and Circumplanetary Disk Luminosity
We have seen that for model sequences of type B, the protoplanet luminosities are in general smaller and at best comparable to those expected from the circumplanetary disk. In the cases with the most rapid accretion rate the difference is most marked indicating that the accreting matter in general fails to supply energy to the protoplanet. This feature causes the radius to attain and remain near cm in most cases. It also means that it is appropriate to regard protoplanets as undergoing disk accretion and able to accept all supplied material at reasonable accretion rates once they cease to be enveloped by the disk as in the type A case. The evolutionary time scales of type A models are sensitive to the dust opacity, being directly proportional and smaller for lower opacities.
The reason for the behaviour of type B models where they fail to expand even at high accretion rates can be related to some simple properties of barotropic stellar models that would apply in the completely degenerate limit. For these is a specified function of and is related to the internal energy per unit mass, through Although the protoplanet models are not of this type, they are similar enough to make the discussion relevant.
The total energy is given by equation (12). For polytropes of index and it is well known that (Chandrasekhar 1939)
| (16) |
while the mass radius relation is From this if we consider a small mass increment we get But this change represents the energy lost through disk and boundary layer accretion, leaving no input for the polytrope explaining why it can remain of low luminosity. In fact the result is valid for any barotropic model and can be shown to follow from the fact that at equilibrium the change of energy is zero to first order in perturbations (the system can be thought of as being perturbed from equilibrium at a slightly larger mass once added material is brought to the surface). In this way we can understand why models of type B can remain of low luminosity, when compared to the fiducial value of under rapid accretion.
The expected circumplanetary disk or disk/protoplanet boundary layer luminosity for a Jovian mass with radius and final accretion times in the range lies in the range and the characteristic temperatures are expected to be in the range
8 Summary & Conclusion
We have presented evolutionary models of giant protoplanets forming in protoplanetary disk. First, we have considered planet models (type A) consisting of solid rock-ice cores surrounded by gaseous envelopes whose surface coincides with the planet Hill sphere, and which accrete quasi-statically from the surrounding protostellar disk. We have considered models with 5 and 15 M⊕ cores, and have varied the dust opacity in the envelope. For models with a 5 M⊕ core and standard opacity, the time required for the planet to undergo rapid gas accretion is yr. This is longer than reasonable disk life-times ranging between 3 – 30 Myr. Reductions in the dust opacity by factors of 10 and 100 lead to models that require and yr, respectively, before rapid gas accretion ensues. Rapid gas accretion occurs once these planets reach M⊕. A 15 M⊕ core planet model with standard opacity takes yr before rapid gas accretion ensues. Models with dust opacity reduced by factors of 10 and 100 require and yr before rapid gas accretion occurs. This arises once the planet mass exceeds M⊕.
We present a second class of planet models (type B) where the planet has a free surface, and accretes gas from a circumplanetary disk that is fed by the surrounding protostellar disk at a specified rate. We find that these models can accrete gas at any reasonable rate that may be supplied by the protostellar disk without expansion.
We suggest that the earliest stages of giant planet formation are described by models of type A. For all such models, the standard type I migration time is shorter than the accretion time prior to rapid gas accretion. We suggest that type I migration is inoperative for at least some protoplanets with masses below those for which disk-planet interactions becomes non-linear (i.e. M⊕), beyond which planets are more likely to undergo rapid inward migration. In such a scenario planets with low mass cores and low opacity envelopes will have a greater tendency to remain at larger radii up to the point of rapid gas accretion. Those with more massive cores will tend to undergo more rapid inward migration prior to or during rapid gas accretion.
At the point of rapid gas accretion, we suppose that planets contract within their Hill sphere, and are described by type B models. The planets may now accrete at any rate supplied by the protostellar disk, and can undergo rapid growth on a time scale shorter than the migration time. If planets with low mass cores tend to exist at larger radii during this stage, they may make a rapid transition to Jovian mass objects, forming gaps and entering a phase of slower type II migration. If planets with larger mass cores have a tendency to undergo more rapid inward migration, they may exist at smaller radii during the rapid gas accretion phase. The disk is thinner here – such that it is easier to form gaps, and the local reservoir of gas is smaller. Such objects are more likely to end up with sub-Jovian masses.
We note that this general picture is likely to be blurred by variations in disk parameters and life-times. But we also note that the current extrasolar planet data shows a mass-period correlation in line with the simple ideas presented here (Zucker & Mazeh 2002). Furthermore there is a hint of a correlation between host star metallicity and period such that higher metallicity stars appear to host shorter period planets (e.g. Santos et al 2003). Such a correlation, while not statistically significant in the data at present, may turn out to be as more data is accumulated and is accordingly a topic for scientific consideration (eg. Sozzetti, 2004). We comment that a correlation of this type might be expected if planetary core mass and envelope opacity scale with the metallicity of the protoplanetary environment.
Acknowledgements.
The hydrodynamic simulations performed here were carried out using the QMUL HPC facility funded by the SRIF initiative.References
- (1)
- (2) Beckwith, S. V. W., Sargent, A. I., Chini, R. S., & Guesten, R. 1990, AJ, 99, 924
- (3) Bell, K. R., & Lin, D. N. C. 1994, ApJ, 427, 987
- (4) Bodenheimer, P., & Pollack, J. B. 1986, Icarus, 67, 391
- (5) Boss, A. P. 1998, ApJ, 503, 923
- (6) Cameron, A. G. W. 1978, Moon Planets, 18, 5
- (7) Chabrier, G., Saumon, D., Hubbard, W. B., & Lunine, J. I. 1992, ApJ, 391, 817
- (8) Chandrasekhar, 1939, An Introduction to the Study of Stellar Structure, (New York: Dover Publications, Inc.)
- (9) Cox, J. P., & Giuli, R. T. 1968, Principles of Stellar Structure: Physical Principles (New York: Gordon & Breach)
- (10) D’Angelo, G., Henning, T., Kley, W. 2003, ApJ, 548, 599
- (11) D’Angelo, G., Kley, W.; Henning, T. 2003, ApJ, 586, 540
- (12) Ikoma, M., Nakazawa, K., Emori, H., 2000, ApJ, 537, 10103
- (13) Ida, S., Makino, J., 1993, Icarus, 106, 210
- (14) Kley, W., 1999, MNRAS, 303, 696
- (15) Lissauer, J. J. 1993, ARA&A, 31, 129
- (16) Lubow, S., Siebert, M., Artymowicz, P., 1999, ApJ, 526, 1001
- (17) Lynden–Bell, D., & Pringle, J. E. 1974, MNRAS, 168, 60
- (18) Masset, F.S., Papaloizou, J.C.B., 2003, Ap.J., 588, 494
- (19) Menou, K., & Goodman, J., 2004, ApJ, 606, 520
- (20) Mizuno, H. 1980, Prog. Theor. Phys., 64, 544
- (21) Nelson, R.P., Papaloizou, J.C.B., Masset, F.S., Kley, W., 2000, MNRAS, 318, 18
- (22) Nelson, R.P., 2003, MNRAS, 345, 233
- (23) Nelson, R.P., Papaloizou, J.C.B., 2004, MNRAS, 350, 849
- (24) Nelson, R.P., 2004, In Preparation
- (25) Papaloizou, J.C.B., Terquem, C., 1999, Ap.J., 521, 823
- (26) Papaloizou, J.C.B., Larwood, J.D., 2000, MNRAS, 315, 823
- (27) Papaloizou, J.C.B., 2002, A & A, 388, 615
- (28) Podolak, M., Hubbard, W. B., & Pollack, J. B. 1993, in Protostars and planets III, ed. E. H. Levy & J. Lunine (Tucson: Univ. Arizona Press), 1109
- (29) Pollack, J. B., Hubickyj, O., Bodenheimer, P., Lissauer, J. J., Podolak, M., & Greenzweig, Y. 1996 Icarus, 124, 62
- (30) Rafikov, R.R., 2004, AJ., 128, 1348
- (31) Safronov, V. S. 1969, in Evoliutsiia doplanetnogo oblaka, Moscow
- (32) Santos, N. C., Israelian, G., Mayor, M., Rebolo, R., Udry, S., 2003, A&A, 398, 363
- (33) Saumon, D., Guillot, T., 2004, Ap.J., 609, 1170
- (34) Schwarzschild, M. 1958, Structure and Evolution of the Stars (Princeton: Princeton Univ. Press)
- (35) Shakura, N. I., & Sunyaev, R. A. 1973, AAP, 24, 337
- (36) Sicilia-Aguilar, A., Hartmann, L.W., Briceno, C., Muzerolle, J., Calvet, N., 2004, A.J., 128, 805
- (37) Sozzetti, A., 2004, MNRAS, 354, 1194
- (38) Stevenson, D. J. 1982, Plan. Space. Sc., 30, 755
- (39) Tanaka, H., Takeuchi, T., Ward, W.R., 2002, Ap.J., 565, 1257
- (40) Thommes, E.W., Duncan, M.J., Levison, H.F., 2003, Icarus, 161, 431
- (41) Ward, W. R. 1997, Icarus, 126, 261
- (42) Wetherill, G. W., & Stewart, G. R. 1989, Icarus, 77, 330
- (43) Ziegler, U., Yorke, H. W., Kaisig, M., 1996, A & A, 305, 114
- (44) Zucker, S., Mazeh, T., 2002, ApJ, 568, 113