The XMM-Newton spectrum of the high-z optically-obscured
QSO RX
J1343.4+0001: a classic radio quiet QSO††thanks: Based on observations
with XMM-Newton, an ESA Science Mission with instruments and
contributions directly funded by ESA Member states and the USA
(NASA)
We present a 30 ks XMM–Newton observation of the = 2.35 Type II radio quiet quasar RX J1343.40001. These data provide the first good quality X–ray spectrum for this object. We measured a continuum slope = 1.850.10 with only an upper limit on the column density of the absorbing material of N 1022 cm-2 as well as an Fe K emission line at the 3 confidence level. We do not find therefore a highly absorbed object nor a truly flat spectrum as suggested on the basis of previous less sensitive ROSAT and ASCA measurements. The N upper limit is fully consistent with the optical extinction 310 inferred from IR observations. The Fe K line is consistent with fluorescence from neutral iron and, noteworthy, is one of the most distant observed so far. The X–ray spectral properties of RX J1343.40001 agree well with the steep continuum slope ( 1.9) being independent of increasing redshift and luminosity as inferred by X–ray studies of large samples of RQ QSOs.
Key Words.:
Galaxies: individual: RX J1343.4+0001 – Galaxies: active – Quasar: general – X-ray: galaxies1 Introduction
In the framework of unified models, the differences between Type I and Type II Seyferts are explained by the existence of an obscuring screen (the so-called “torus”), which prevents us from observing the inner regions around the black hole (i.e. the accretion disk and the broad line region), if our line of sight intersects it (Antonucci 1993). This picture (which is thought to hold also for QSOs) implies that Type I and II AGNs are essentially the same objects viewed at different inclination angles. Nonetheless, the existence of high–luminosity analogues of Seyfert IIs (i.e. with only narrow emission lines in their optical spectra) has been hotly debated during the last decade, and only with the advent of new generation X-ray telescopes XMM–Newton and Chandra has a handful of these objects been unambiguously detected in the optical follow–up of deep X–ray surveys (e.g. Norman et al. 2002; Padovani et al. 2004; Fabian et al. 2003 for a review).
Most of the studies carried out so far on the X-ray spectral properties of QSOs concern optically-selected (i.e. not obscured) samples at 1 (see e.g. Zamorani et al. 1981; Williams et al. 1992; Fiore et al. 1998). At higher redshifts (i.e. 1) the situation is more uncertain because of the limited number of sources accounted for so far. Moreover, since at a given optical luminosity “radio quiet” (RQ) QSOs are 3 times less X-ray luminous than “radio loud” (RL) QSOs, most of the spectroscopically analyzed QSOs at higher redshifts were RL. So the average spectral properties observed for RL QSOs at low ( 1.6 and intrinsic NH exceeding the Galactic value) were confirmed to persist up to 3-4 by ASCA and ROSAT observations (Cappi et al. 1997; Reeves & Turner 2000, hereafter RT00).
On the contrary, spectral properties of high- RQ QSOs were poorly
constrained before the launch of XMM–Newton and Chandra. Early ASCA
results (Vignali et al. 1999), which suggested a flattening of the
average slope with increasing redshifts, have been recently revised after
the results of individual spectral analysis of QSOs at 2
detected in a shallow XMM–Newton survey (Piconcelli et al. 2003, hereafter P03) and
stacked-spectra analysis of very high- (i.e. z 5–6)
objects (Vignali et al. 2003).
These findings indicate that no change in the X–ray continuum slope with redshift occurs.
Such a trend is also confirmed by recent optical surveys (Fan et al. 2004) which find no significant evolution in the
average emission line and continuum properties of 6 QSOs compared to those of lower redshift
samples of QSOs.
It is worth stressing that these results are based on samples of broad line QSOs. The X-ray spectral properties of type II QSOs, however, remain almost unexplored owing to their very faint X-ray fluxes. Furthermore the existence of such a large population of high-luminosity ( 1044 erg cm-2 s-1) obscured objects is also required in all the synthesis models of the cosmic X-ray background in order to reproduce the source counts in the 2–10 keV band (Gilli et al. 2001).
In this paper we report on the XMM–Newton observation of RX J1343.40001 ( = 2.35; Almaini et al. 1995, hereafter A95). Its relative brightness ( 2 10-13 erg cm-2 s-1) makes RX J1343.40001 an excellent candidate to get better insight in the X–ray spectral properties of high- RQ QSOs.
2 RX J1343.40001
RX J1343.40001 was discovered during the optical follow-up of a deep ROSAT survey and classified as a Type II QSO because of its high luminosity ( 2 1045 erg s-1) and the lack of any broad lines (i.e. with 900 km/s) in its optical spectrum (A95). The ROSAT 0.1-2 keV low-statistics spectrum was fitted by A95 with an unabsorbed power law model with 1.5.
Georgantopoulos et al. (1999, hereafter G99) presented the results of near-IR and ASCA observations of this QSO. They detected a broad H emission line redshifted at 2.2 m: therefore this object is not a pure QSO 2, but, more properly, a “Type 1.9” QSO, i.e. a luminous analogue of a Seyfert 1.9 galaxy, considering the source–frame optical spectra. The ASCA spectrum is hard and either a flat ( 1.3) or a steeper ( 1.9) absorbed (NH 1023 cm-2) power-law model yielded acceptable fits. The limited photon statistics prevented a firm conclusion on the spectral shape of this source. Similar conclusions were reached by G99 who also added ROSAT data in their analysis. RX J1343.40001 was also included in the ASCA QSOs survey presented by RT00. These authors reported the detection (at 90% confidence level) of a Fe K line at 6.4 keV with a rest–frame equivalent width EW = 432 eV.
3 XMM–Newton observation and data reduction
RX J1343.40001 was observed by XMM–Newton (Jansen et al. 2001 and references therein) on January 29, 2004 for 35.4 ks. The EPIC PN (Turner et al. 2001) and MOS (Struder et al. 2001) observations were carried out in the full frame mode using the Thin filter. XMM–Newton data were processed with SAS v6.0. We used the EPCHAIN and EMCHAIN tasks for processing the raw PN and MOS data files, respectively, in order to generate the relative linearized event files. X–ray events corresponding to patterns 0–12(0–4) for the MOS(PN) cameras were selected. We employed the most updated calibration files at the time the reduction was performed (June 2004). Flickering and bad pixels were removed. The event lists were furthermore filtered to ignore periods of high background flaring according to the method presented in Piconcelli et al. (2004a) based on the cumulative distribution function of background lightcurve count-rates. After this data cleaning, we obtained as net exposure time 24.9, 27.8, 32.4 ks for PN, MOS1 andMOS2, respectively. Given the current calibration uncertainties, we discarded PN(MOS) events below 0.3(0.6) keV and above 12(10) keV. EPIC spectra were binned to a minimum of 20 counts/bin to facilitate the use of the minimization technique in the spectral fitting. All fits were performed using the XSPEC package (v11.3). PN and MOS data were then fitted simultaneously. The quoted errors in the model parameters correspond to a 90% confidence level for one interesting parameter ( = 2.71; Avni 1976). All luminosities are calculated assuming a CDM cosmology with (,) = (0.3,0.7) and a Hubble constant of 70 km s-1 Mpc-1 (Bennett et al. 2003).
4 The X–ray spectrum
We initially fitted the EPIC spectrum with a power law model modified by Galactic absorption (N =2.6 1020 cm-2; A95). This fit (PL hereafter) turned out a photon index = 1.82 with an associated =41(47).
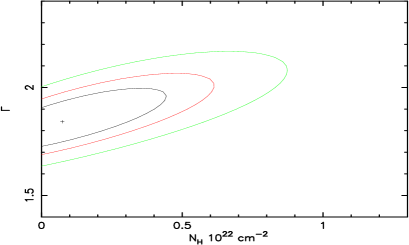
In order to test the presence of heavy intrinsic obscuration in RX J1343.40001 as claimed by previous X–ray studies, we added an additional absorption component due to neutral gas to the PL model. No intrinsic absorption was significantly detected and the upper limit on the column density in the QSO rest–frame ( = 2.35) was N 5 1021 cm-2. In Fig. 1 the two–dimensional contour plot in the parameter space N– is shown. Our EPIC data place tighter than ever limits on the slope of the primary continuum as well as on the amount of the absorption in RX J1343.40001. Note that assuming the RT00 best fit model (i.e. = 1.90.4 and N 4.8 1022 cm-2) yields 4.2. We also tested the possibility that the obscuration occurs in an ‘warm’ (i.e. ionized) material. Even if the X–ray opacity of such a gas is lower than neutral, a warm absorber with internal dust could, however, significantly obscure the optical/UV band (as suggested in Komossa & Fink (1997) for the Seyfert 1.8 NGC3786). This fit, performed using the ABSORI model in XSPEC, yielded no statistical improvement with respect to the model with cold absorption. The resulting column density of the warm gas was NH 1 1022 cm-2, while its ionization parameter remained unconstrained with a best-fit value 0 erg cm-2 s-1.
Visual inspection of the data–to–model ratio residuals (see
Fig. 2) suggests the presence of an emission feature at 2
keV (i.e. 6.4 keV in the QSO rest–frame). This spectral
feature was already marginally detected by ASCA (RT00) and it is
associated to fluorescence emission from the K–shell of iron. Thus
we introduced a narrow Gaussian line in the fitting model to account
for it. The fit gave a rest–frame energy of the line at E =
6.42 keV (EW = 460 eV in the QSO–frame) with a statistical
improvement significant at 98.5% confidence level. The centroid of
the line corresponds to low ionization states, i.e. Fe I–XVIII
(Makishima 1986). The resulting slope of the underlying continuum was = 1.850.10.
Furthermore we checked (and ruled out) the possibility that background subtraction affects the detection and/or the strength of this line
by a visual inspection of the source and background superposed spectra.
We also fitted the line leaving the
parameter free to vary, which yielded a value of
0 (with an upper limit of
1.3 keV) and no statistical improvement in the
goodness of fit. The velocity width of the line is not well
constrained because of the limited number of photons collected
from this faint QSO. Further investigations on the possible “broadness” of this line
require better data quality.

We measured a 2–10 (0.5–2) keV observed flux of 6.50.1(4.00.2) 10-14 erg cm-2 s-1, which corresponds to a luminosity of 2.2 (1.1) 1045 erg s-1 once corrected for Galactic absorption. During this XMM–Newton observation the 0.5–10 keV flux of RX J1343.40001 was therefore a factor of 40% lower than measured by ASCA on 1996. Assuming that the black hole produces X–rays with an efficiency of 0.01 (Norman et al. 2002) we can estimate a M 3 109 M⊙ which lies in the typical range inferred for high– QSOs (Dietrich & Hamann 2004).

5 Discussion
5.1 X–ray continuum and absorption
The EPIC observation presented here provides the first good–quality
X–ray spectrum of this “Type 1.9 QSO” as it allows us to
strongly constrain both the slope of the primary continuum and the
column density of the absorbing material, = 1.850.10 and N 1022
cm-2, respectively. Thanks to the
unprecedented large collecting area of XMM–Newton, it is therefore possible
to rule out both hypotheses about the X–ray nature of
RX J1343.40001 suggested on the basis of low–sensitivity ROSAT and ASCA measurements, i.e. a truly flat or a highly
obscured spectrum (e.g. Sect. 2). Note that Georgantopoulos et al. (2004) derived similar values for
these spectral parameters (i.e = 1.77 0.36 and N 6 1022 cm-2)
from an off-axis shallow EPIC exposure of RX J1343.40001. We also performed a hardness ratio (HR) analysis of a 10 ks Chandra observation of this QSO.
The HR for this source is slightly lower than the corresponding one calculated using = 1.9 and N = 1022 cm-2.
This finding implies that a column density value larger than 1022 cm-2 is also ruled out on the basis of these Chandra data,
taken when the source was at a similar flux level as the present EPIC observation.
Previous ASCA claims (G99; RT00) for a large amount of N ( 1023 cm-2) appear to be due to the limited sensitivity and the narrower energy range affecting these measurements. We rule out a possible contamination due to another source present in the ASCA errorbox: no additional X–ray source lies within the 1 arcmin box centered on the QSO.
Some recent works based on XMM–Newton observations (Ferrero & Brinkmann 2003; Grupe et al. 2004) also do not confirm earlier ASCA results about the presence of a strong absorption toward high– QSOs. Nevertheless, even though affected by large errors, the results found by A95 (i.e. a 95% upper limit of 1.98 and a value of N 1022 cm-2) for the ROSAT spectrum are consistent with ours. Furthermore, the value obtained for the photon index is similar to the canonical one measured for RQ QSOs at 0.01 2 (e.g. RT00). This result is in agreement with the observational evidence that the mean X–ray spectral shape of QSOs does not show any variation over (P03; Vignali et al. 2003).
The upper limit on the column density (N 1022 cm-2) is fully consistent with the optical extinction. On the basis of the results from an IR observation (i.e. = 5.4 and presence(absence) of the broad H(H) line), G99 concluded that this QSO is obscured by a moderate amount of dust, with a lower limit of the photoelectric extinction of 3 (excluding, however, a reddening much higher than this value i.e. 10 as suggested by Georgantopolous et al. 2003). Such a limit on the reddening to the BLR implies a range for the column density of 5 1021 N 2 1022 cm-2 according to the formula NH/ = 1.79 1021 cm-2 mag-1 (Predehl & Schmitt 1995). On the one hand, this suggests that X–ray and optical/UV obscuration likely occur in the same matter (e.g. the putative torus invoked in the AGN Unified models); on the other hand, it rules out the hypothesis of a gas-to-dust ratio along the line of sight several times larger than that of the Milky Way (G99). RX J1343.40001 therefore poses a notable exception among intermediate type 1.8-1.9 AGNs which usually have a low /NH as pointed out by Maiolino et al. (2001) and Granato et al. (1997). Such a possibility has also been proposed to explain the existence of X-ray absorbed broad line QSOs (Akyiama et al. 2000). However, recent XMM–Newton results (P03; Akylas et al. 2004) do not yield a large population of these objects and, moreover, there is growing evidence that obscuration in broad line QSOs is basically due to ionized (instead of “cold”) material (Porquet et al. 2004; Piconcelli et al. 2004b; Schartel et al. 2004).
Alternatively, the change in the spectral properties between the ASCA and the XMM–Newton observation could be explained in terms of a temporal variation of the column density in the absorbing material as seen in some local AGNs (e.g. Akylas et al. 2002; Risaliti et al. 2002; Lamer et al. 2003). This spectral behaviour suggests the presence of clouds with different NH drifting across our line of sight responsible of the observed NH variations.
5.2 Fe K emission line
The Fe K emission line detected at 3 in RX J1343.40001 is the most distant in a unlensed QSO observed so far (Chartas et al. 2004). Even more interesting is the fact that it has been observed in a Type II QSO, an elusive class of objects whose X–ray spectral properties are not well known. Bearing in mind the large errors affecting both the measurements, the value of EW = 460 eV obtained by the XMM–Newton observation agrees well with that reported in RT00. It appears, therefore, that the strength of the iron line did not change between the two observations. This indicates that the Fe emitting material traces the variability of the nuclear flux and that the fluorescence originates near the nucleus. Given the temporal difference between the two observations we infer an upper limit of 2.45 pc on the distance nucleus/Fe emitter. The value of the EW is unusually large if compared with the results of Page et al. (2004) who reported a decrement of the mean EW with increasing . In particular they predict an EW 100 eV at 1045 erg s-1 i.e. the luminosity measured for RX J1343.40001. The energy of the line indicates that it emerges from cold matter, therefore an origin in the X–ray/optical absorbing material appears likely. However, the best-fit value of the EW is too large to be accounted by the amount of the absorption (few 1021 cm-2) estimated for RX J1343.40001. A plausible explanation for such an EW value could be a combination of different processes such as fluorescence in transmission along the obscuring material plus reflection off the inner walls of the optically thick torus and/or the accretion disk into our line of sight. The detection of a continuum Compton-reflection component in the EPIC spectrum is very marginal and we could only obtain an upper limit of (=/2) 2 for the covering factor of the material irradiated by the X-ray source, which is still consistent with observed Fe K line EW. Since the latter is consistent at 2 with a value (EW 700 eV) typically observed in Compton–thick AGNs (Levenson et al. 2002; Guainazzi et al. 2004) we also calculated the ratio = , which is an indicator of the “thickness” of the absorbing matter (Bassani et al. 1999) using the IR data in G99. The resulting value of 1 rules out this hypothesis that the observed X–ray continuum is entirely due to reflection scattering.
In conclusion, the X–ray spectral properties of RX J1343.40001 obtained by this XMM–Newton observation agree well with the predictions of the AGN Unified Models concerning absorption. They also follow the trend of X–ray spectral slopes being constant with redshift or luminosity, as recently inferred for large samples of RQ QSOs (e.g. P03; Vignali et al. 2003; Piconcelli et al. 2004b).
Acknowledgements.
We thank the anonymous referee for her/his interesting suggestions. We gratefully acknowledge Marcus Kirsch and Pedro Rodriguez-Pascual for helpful comments. We would like to thank the staff of the XMM–Newton Science Operations Center for their support.References
- (1) Akylas, A., Geogakakis, A., & Georgantopolous, I., 2004, MNRAS, in press
- (2) Akiyama, M., Ohta, K., & Yamada, T., et al., 2000, ApJ, 532, 700
- (3) Almaini, O., Boyle, B. J., Griffiths, R. E., et al., 1995, MNRAS, 277, L31 (A95)
- (4) Antonucci, R., 1993, ARA&A, 31, 473
- (5) Bassani, L., Dadina, M., Maiolino, R., et al., 1999, ApJS, 121, 473
- (6) Bennett, C. L., Halpern, M., Hinshaw, G., et al., 2003, ApJS, 148, 1
- (7) Cappi, M., Matsuoka, M., Comastri, A., et al., 1997, ApJ, 478, 492
- (8) Chartas, G., Eracleous, M., Agol, E., & Gallagher, S. C., 2004, ApJ, 606, 78
- (9) Dietrich, M., & Hamann, F., 2004, ApJ, 611,
- (10) Fabian, A. C., 2003, Proc. of ”Carnegie Observatories Astrophysics Series, Vol. 1: Coevolution of Black Holes and Galaxies,” ed. L.C. Ho (Cambridge Univ. Press)
- (11) Fan, X., Hennawi, J. F., Richards, G. T., et al., 2004, ApJ, in press(astro-ph/0405138)
- (12) Ferrero, E., & Brinkmann, W., 2003, A&A, 402, 465
- (13) Fiore, F., Elvis, M., Giommi, P., & Padovani, P., 1998, ApJ, 429, 79
- (14) Georgantopoulos, I., Almaini, O., Shanks, T., et al. 1999, MNRAS, 305, 125 (G99)
- (15) Georgantopoulos, I., Georgakakis, A., Stewart, G. C., et al., 2003, MNRAS, 342, 321
- (16) Georgantopoulos, I., Georgakakis, A., Akylas, A., et al., 2004, MNRAS, 352, 91
- (17) Gilli, R., Salvati, M., & Hasinger, G., 2001, A&A 366, 407
- (18) Granato, L., Danese, L., & Franceschini, A., 1997, ApJ, 486, 147
- (19) Grupe, D., Mathur, S., Wilkes, B., & Elvis, M., 2004, ApJ, 127, 1
- (20) Guainazzi, M., Fabian, A. C., Iwasawa, K., Matt, G., & Fiore, F., 2004, MNRAS, (astro-ph/0409689)
- (21) Jansen, F., Lumb, D., Altieri, B., et al., 2001, A&A, 365, L1
- (22) Komossa, S., & Fink, H., 1997, A&A, 327, 555
- (23) Lamer, G., Uttley, P., & McHardy, I. M., 2003, MNRAS 342, L41
- (24) Levenson, N. A., Krolik, J. H., Zycki, P. T., et al., 2002, ApJ 573, 81
- (25) Makishima, K., 1986, Lecture Notes in Physics, 266, 246
- (26) Norman, C., Hasinger, G., Giacconi R., et al., 2002, ApJ, 571, 218
- (27) Padovani, P., Allen, M. G., Rosati, P., & Walton, A., 2004, A&A, in press (astro-ph/0406056)
- (28) Page, K. L., O’Brien, P. T., Reeves, J. N., & Turner, M. J., 2004, MNRAS, 347, 316
- (29) Piconcelli, E., Cappi, M., Bassani, L., Di Cocco, G., Dadina, M., 2003, A&A, 412, 689 (P03)
- (30) Piconcelli, E., Jimenez-Bailon, E., Guainazzi, M., et al., 2004a, MNRAS, 351, 161
- (31) Piconcelli, E., Jimenez-Bailon, E., Guainazzi, M., et al., 2004b, A&A in press, (astro–ph/0411051)
- (32) Predehl, P., & Schmitt, J. H. M. M., 1995, A&A 293, 889
- (33) Porquet, D., Reeves, J.N., O’Brien, P., & Brinkmann, W., 2004, A&A, 422, 85
- (34) Reeves, J. N., Turner, M. J. L., 2000, MNRAS, 316, 234 (RT00)
- (35) Schartel, N., Rodriguez-Pascual, P. M., Santos-Lleo, M., et al., 2004, A&A, in press
- (36) Struder, L., Briel, U., Dennerl, K., et al., 2001, A&A 365, L18
- (37) Turner, M. J. L., Abbey, A., Arnaud, M., et al., 2001, A&A, 365, L27
- (38) Vignali, C., Comastri, A., Cappi, M., et al., 1999, ApJ, 516, 582
- (39) Vignali, C., Brandt, W. N., Schneider, D. P., et al., 2003, AJ, 125, 2876
- (40) Williams, O.R., Turner, M. J. L., Stewart, G. C., et al., 1992, ApJ, 389, 157
- (41) Zamorani, G., Henry, J.P., Maccacaro, T., et al., 1981, ApJ, 245, 357