Specific Star Formation Rates to Redshift 1.5
Abstract
We present a study to determine how star formation contributes to galaxy growth since over five decades in galaxy stellar mass. We investigate the specific star formation rate (SSFR; star formation rate [SFR] per unit galaxy stellar mass) as a function of galaxy stellar mass and redshift. A sample of 175 -band selected galaxies from the MUnich Near-Infrared Cluster Survey spectroscopic dataset provide intermediate to high mass galaxies (mostly ) to . The FORS Deep Field provides 168 low mass galaxies (mostly ) to . We use a Sloan Digital Sky Survey galaxy sample to test the compatibility of our results with data drawn from a larger volume. We find that at all redshifts, the SSFR decreases with increasing galaxy stellar mass suggesting that star formation contributes more to the growth of low mass galaxies than to the growth of high mass galaxies, and that high mass galaxies formed the bulk of their stellar content before . At each epoch we find a ridge in SSFR versus stellar mass that is parallel to lines of constant SFR and evolves independently of galaxy stellar mass to a particular turnover mass. Galaxies above this turnover mass show a sharp decrease in the SFR compared to the average at each epoch and the turnover mass increases with redshift. The SFR along the SSFR ridge decreases by roughly a factor of 10, from 10 yr-1 at to 1 yr-1 at . High mass galaxies could sustain the observed rates of star formation over the 10 Gyr observed, but low mass galaxies likely undergo episodic starbursts.
1 Introduction
In an effort to study galaxy assembly, we look at the contribution of star formation to the growth of stellar mass in galaxies as a function of time. Several groups have determined stellar masses of galaxies from redshift surveys with multiwavelength observations in the local universe (2dF, Cole et al., 2001; SDSS Kauffmann et al., 2003; SDSS & 2MASS, Bell et al., 2003; Drory et al., 2004) and at high redshift (Brinchmann & Ellis, 2000; Drory et al., 2001a; Cohen, 2002; Rudnick et al., 2003; Dickinson et al., 2003; Fontana et al., 2004; Drory et al., 2004).
Here we investigate the specific star formation rate (SSFR), which measures the star formation rate (SFR) per unit galaxy stellar mass, to study explicitly how star formation contributes to galaxy growth for galaxies of different masses at different times in the history of the universe.
The SSFR has been studied at low redshifts (Pérez-González et al., 2003; Brinchmann et al., 2004) and intermediate redshifts (Cowie et al., 1996; Guzman et al., 1997; Brinchmann & Ellis, 2000; Fontana et al., 2003) but no significant study of SSFR evolution over a wide range of galaxy masses and redshift has been undertaken. High mass galaxies at high redshifts are just now beginning to be studied (Juneau et al., 2004). Cowie et al. (1996) used rest-frame -band (2.2m) luminosities and [OII] equivalent widths to show that galaxies with rapid star formation decrease in luminosity, and therefore mass, with decreasing redshift. Brinchmann & Ellis (2000) inferred stellar masses of galaxies and pointed out a generally increasing SSFR with redshift and a trend for low mass galaxies to exhibit larger SSFRs.
We combine two complementary redshift surveys to broaden the mass and redshift range that we can probe. The wide-area, medium deep MUNICS (Drory et al., 2001b; Feulner et al., 2003) spectroscopic dataset provides intermediate to high mass galaxies typically in the mass range of . The FORS Deep Field (Heidt et al., 2003; Noll et al., 2004) covers a small portion of the sky very deeply, contributing galaxies to the sample.
We discuss the samples used and the methodology for determining SFRs and galaxy masses in Section 2. We describe the results of this study, possible selection effects and complete a comparison to the local universe in Section 3. In Section 4 we present a discussion of the physical implications of our results as well as a comparison to the literature.
Throughout this Letter we adopt an , , cosmology.
2 Galaxy Data
The MUNICS project is a wide-area, medium-deep, photometric and spectroscopic survey selected in the -band and reaching . It covers nearly one square degree in the and bands with follow-up imaging in the and bands over 0.5 square degrees (Drory et al., 2001b). Spectroscopy is complete to over 0.25 square degrees and reaches for 100 square arcmins. The spectra cover a wide wavelength range of at (FWHM) resolution, sampling galaxies in the redshift range of (Feulner et al., 2003). Our MUNICS sample contains 175 objects, which are mostly massive () field galaxies with detectable [OII]3727 emission.

The FORS Deep Field (FDF) spectroscopic survey provides low-resolution spectra with detectable [OII] in the spectral window ( at (FWHM) resolution) to (Noll et al., 2004). The FDF survey is -band selected reaching with spectroscopy to . The FDF covers x in eight bands: UBgRIzJK (Heidt et al., 2003). Our FDF sample includes 168 galaxies with detectable star formation, and masses of mostly .
Stellar masses of galaxies are determined, as described in Drory et al. (2004), by fitting a grid of composite stellar population models of varying age, star formation history, and dust extinction to multi-wavelength photometry to determine mass-to-light () ratios. The total systematic uncertainty in the ratio is about 25% Drory et al. (2004).
We have developed a program to automatically measure emission line fluxes, equivalent widths and continuum breaks from flux calibrated spectra. To each rest-frame emission line region of interest, we fit a Gaussian profile plus a polynomial continuum, using the spectral resolution as a first guess at the line width. Errors in measurements are determined by fitting spectral regions multiple times with different continuum estimates. This program gives us a consistent flux measurement between the galaxy samples measured in this study.
As an SFR indicator, we use the flux of the [OII] emission feature which remains in the spectral window from low redshift to . We use the Kennicutt (1998, Equation 3) conversion from [OII] line luminosity to SFR in units of solar masses per year.
3 Specific Star Formation Rates
Fig. 1 demonstrates the similarity between the redshift distributions of the full spectroscopic samples (dashed lines) and star forming sub-samples (solid lines) used in this study from MUNICS (Fig. 1a) and FDF (Fig. 1b). The majority of galaxies in the full samples have detectable star formation and the distributions match very well, indicating little redshift bias in making this selection of objects. There are fewer star forming galaxies in the MUNICS sample at the lowest redshifts with only six low redshift MUNICS galaxies excluded because of the [OII]3727 emission line being blueward of the spectral coverage. For MUNICS, 52% of the spectroscopic sample shows star formation.
For the FDF galaxy sample, 75% of all galaxies with show detectable star formation via the [OII] emission feature. The higher fraction of star forming galaxies in FDF is understandable since the FDF spectroscopic absolute magnitude limit is deeper than MUNICS and fainter galaxies tend to have more star formation (e.g. Kennicutt et al., 1984).
Fig. 1 also shows the distribution of SFRs seen among the two samples of galaxies split into redshift bins. MUNICS galaxies are shown in Figure 1c with the dashed histogram representing and the solid histogram showing the range of . Figure 1d shows the FDF SFR distribution with the same redshift bins in addition to a high redshift bin shown by the dotted histogram for . The maximum SFR increases with redshift, and is consistent between the two samples.
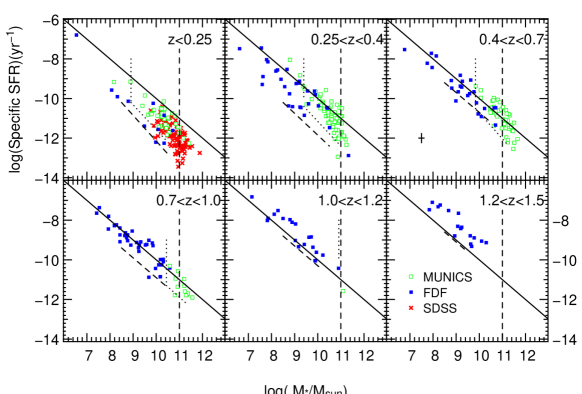
Fig. 2 shows the SSFR versus galaxy stellar mass, as a function of redshift. A sample of SDSS galaxies is shown in the lowest redshift bin as crosses and described in detail below. The solid diagonal line in each panel indicates a constant SFR = 1yr-1. Lines of constant SFR are parallel to this line and SFRs increase to the upper right. The vertical dashed line designates a galaxy with . The short vertical dotted line shows the limiting MUNICS galaxy stellar mass for each redshift bin. The diagonal dotted and dashed lines show limits for detectable SSFR for MUNICS and FDF, respectively, derived from their spectroscopic sensitivity limits.
Several features are evident at each epoch in this plot. Low to intermediate mass galaxies form a “ridge” of SSFR that lies parallel to the solid diagonal line of constant SFR. The ridge remains as mass increases until, at some high mass, there appears to be a turnover mass, above which the SSFR decreases. This turnover mass increases with redshift accompanied by higher mass galaxies showing higher SSFRs at earlier times. This behavior has been termed ’downsizing’ by Cowie et al. (1996).
There exists a general correlation between SSFR and mass at low redshift (e.g. Brinchmann & Ellis, 2000; Brinchmann et al., 2004. We show evidence here for a ridge in SSFR that evolves with redshift independent of galaxy stellar mass for the full range of . The average SSFR at a given mass on the ridge decreases from to so that the average SSFR for a low mass galaxy at is roughly 1 dex higher than the average SSFR of a low mass galaxy at . Galaxies with SFR yr-1, below the SSFR ridge, are increasingly too faint to detect as redshift increases, as shown by the diagonal dashed line in Fig. 2. The region below the SSFR ridge of galaxies in Fig. 2 could also be populated by galaxies that are not forming stars at the time of observation. Galaxies of exist at low SSFR, showing that they form fewer stars compared to the lower mass galaxies. The turnover mass refers to the mass at which the SSFR noticeably decreases from the ridge. We note that, while detecting the lowest values of SFR is affected by incompleteness, more than 50% of the galaxies have detectable star formation and the upper bound of the SSFR ridge has no selection effects.
We make no corrections for extinction to the emission line fluxes in the present study for multiple reasons. We only measure H for those galaxies at , and can only measure a Balmer decrement at low redshift. In addition, we only have H line flux measurements for 10% of the galaxies. For those galaxies with measurements of both H and H we find an average , assuming a case B recombination. Galaxy samples selected at mid and far infrared wavelengths would likely yield some starbursting galaxies with higher SFRs and would be affected by dust extinction. We feel it would be irrelevant to apply a flat, generic low redshift correction to all galaxies here, because while it would increase the global star formation density by 50%, it would not change the differential star formation effects studied here. If we were to apply a mass-dependent extinction correction, the slope of the SSFR ridge would change, but the differential effects with redshift would remain identical.
The trends seen among the FDF and MUNICS galaxy surveys exhibit similar evolution in their overlapping mass range around and are therefore suitable to analyze simultaneously to cover such a large range of galaxy stellar mass.
There are few FDF galaxies present in the lowest redshift bin in Fig. 2 as anticipated since the FDF covers little volume at low redshift. The lack of massive galaxies in the bins also shows the small volume of the FDF in addition to the spectroscopic limit for detecting massive galaxies. In order to verify that the increase in SSFR at higher redshifts is not due to rarer objects being seen as larger volumes are probed, we investigate the trends in SSFR from the SDSS. We gathered SDSS galaxies (Abazajian et al., 2004) selected to match the MUNICS magnitude limits from the sample described in Drory et al. (2004), who determined galaxy stellar masses following the same method as the rest of our sample. We used the [OII]3727 flux as reported by SDSS and followed the Kennicutt (1998) conversion to SFR.
We chose a random sample of SDSS galaxies to match the number of galaxies in the lowest redshift bin from MUNICS and FDF and show them in Fig. 2 as crosses. The SSFRs of the SDSS galaxies are consistent with the MUNICS values in this redshift bin, which we confirmed by repeating the selection multiple times. Out of the whole SDSS sample, only 1.15% lie above the 1 yr-1 constant SFR line. Hence, if the abundance of galaxies above this line at high redshift were only due to the larger volume sampled, we would expect only such a small fraction of objects to lie above this line.
4 Discussion and Conclusions
We present a study of the contribution of star formation to galaxy growth from to the present. We investigate the SSFR as a function of redshift and galaxy stellar mass over five decades in galaxy stellar mass. At all redshifts, the SSFR decreases as stellar mass increases. This indicates a higher contribution of star formation to the growth of low mass galaxies since and suggests that high mass galaxies formed the bulk of their stellar content earlier than . The drop in SSFR for high mass () galaxies above the turnover mass for each epoch seen in Fig. 2 is symptomatic of higher mass galaxies tending to be the early-type, redder population which forms few stars after . This result is compatible with the detection of massive galaxies at (Saracco et al., 2003; Fontana et al., 2004; Glazebrook et al., 2004) and the mass-dependent SFR from to suggested by Heavens et al. (2004).
Fig. 2 shows evidence of a ridge in SSFR that runs parallel to lines of constant SFR. The ridge exists for all galaxy stellar masses and increases uniformly, independent of mass as redshift increases. The first evidence for such a ridge in SSFR was noted by Brinchmann & Ellis (2000). Our work moves beyond that study with a mass limited sample at each redshift bin and a wide range of masses.
The ridge in SSFR shifts downward as redshift decreases indicating a steady decrease in the global SFR by a factor of 10 from to , as widely noted in the literature (e.g. Madau et al., 1996; Lilly et al., 1996; Hammer et al., 1997; Rowan-Robinson et al., 1997; Flores et al., 1999; Tresse et al., 2002). Previous studies have not differentiated whether the decline in the global SFR is experienced by galaxies of all types or specific to a limited galaxy population. Our study shows a uniform change in SFR independent of galaxy stellar mass.
Using nearly 105 SDSS galaxies, Brinchmann et al. (2004) study several properties of star forming galaxies at . They show the observed likelihood distribution of SSFR versus stellar mass in their Figure 24 which demonstrates the existence of a SSFR ridge. This ridge is compatible with the one shown in this work if identical SFR conversions and extinction corrections are applied to the [OII]3727 emission line flux as shown in the low redshift panel of Fig. 2. Our comparison to SDSS galaxies reveals that our findings are not the result of more extreme galaxies being detected as more volume is sampled.
Galaxies exist on Fig. 2 only when the star formation induces detectable amounts of [OII]3727 emission. At any epoch a majority of galaxies () show detectable star formation with SFRs lying on the SSFR ridge. Galaxies with could sustain the observed SFRs for a doubling time of order the Hubble time, without moving significantly on Fig. 2, but the SFR is observed to decrease over time, presumably because of gas depletion.
Galaxies with likely evolve differently. Low mass galaxies sustaining the observed SFRs would significantly evolve on Fig. 2 from to so that we would see more intermediate mass galaxies with SFR yr-1 at , which is not evident. A galaxy of mass, , with constant SFR = 1 yr-1 has a doubling time of the stellar population of yrs. Such a galaxy, with a typical gas fraction of order 1 (Bothun, 1984; Kannappan, 2004), could only sustain this rate of star formation for a short period of time before the gas supply diminishes (if we assume no significant gas infall). Therefore, it is likely that these galaxies exist on Fig. 2 during periodic starbursts. If gas depletes during each burst then subsequent bursts would exhibit progressively lower SFRs, consistent with the observed trend. The duty cycle must be at least 50%, since the majority of the galaxies have detected star formation.
If there exists a transition mass between the two separate modes of star formation (sustained or periodic bursts), then the coherence of the trend of the SSFR ridge decreasing with redshift independent of mass is particularly interesting.
References
- Abazajian et al. (2004) Abazajian, K., et al. 2004, AJ, 128, 502
- Bell et al. (2003) Bell, E. F., McIntosh, D. H., Katz, N., & Weinberg, M. D. 2003, ApJS, 149, 289
- Bothun (1984) Bothun, G. D. 1984, ApJ, 277, 532
- Brinchmann et al. (2004) Brinchmann, J., Charlot, S., White, S. D. M., Tremonti, C., Kauffmann, G., Heckman, T., & Brinkmann, J. 2004, MNRAS, 351, 1151
- Brinchmann & Ellis (2000) Brinchmann, J., & Ellis, R. S. 2000, ApJ, 536, L77
- Cohen (2002) Cohen, J. G. 2002, ApJ, 567, 672
- Cole et al. (2001) Cole, S., et al. 2001, MNRAS, 326, 255
- Cowie et al. (1996) Cowie, L. L., Songaila, A., Hu, E. M., & Cohen, J. G. 1996, AJ, 112, 839
- Dickinson et al. (2003) Dickinson, M., Papovich, C., Ferguson, H. C., & Budavári, T. 2003, ApJ, 587, 25
- Drory et al. (2004) Drory, N., Bender, R., Feulner, G., Hopp, U., Maraston, C., Snigula, J., & Hill, G. J. 2004, ApJ, 608, 742
- Drory et al. (2004) Drory, N., Bender, R., & Hopp, U. 2004, astro-ph/0410084
- Drory et al. (2001a) Drory, N., Bender, R., Snigula, J., Feulner, G., Hopp, U., Maraston, C., Hill, G. J., & de Oliveira, C. M. 2001a, ApJ, 562, L111
- Drory et al. (2001b) Drory, N., Feulner, G., Bender, R., Botzler, C. S., Hopp, U., Maraston, C., Mendes de Oliveira, C., & Snigula, J. 2001b, MNRAS, 325, 550
- Feulner et al. (2003) Feulner, G., Bender, R., Drory, N., Hopp, U., Snigula, J., & Hill, G. J. 2003, MNRAS, 342, 605
- Flores et al. (1999) Flores, H., et al. 1999, ApJ, 517, 148
- Fontana et al. (2003) Fontana, A., et al. 2003, ApJ, 594, L9
- Fontana et al. (2004) Fontana, A., et al. 2004, astro-ph/0405055
- Glazebrook et al. (2004) Glazebrook, K., Abraham, R., McCarthy, P., Savaglio, S., Chen, H., Crampton, D., & Murowinski. 2004, Nature, 430, 181
- Guzman et al. (1997) Guzman, R., Gallego, J., Koo, D. C., Phillips, A. C., Lowenthal, J. D., Faber, S. M., Illingworth, G. D., & Vogt, N. P. 1997, ApJ, 489, 559
- Hammer et al. (1997) Hammer, F., et al. 1997, ApJ, 481, 49
- Heavens et al. (2004) Heavens, A., Panter, B., Jimenez, R., & Dunlop, J. 2004, Nature, 428, 625
- Heidt et al. (2003) Heidt, J., et al. 2003, A&A, 398, 49
- Juneau et al. (2004) Juneau, S., et al. 2004, ApJ
- Kannappan (2004) Kannappan, S. 2004, ApJ, 611, L89
- Kauffmann et al. (2003) Kauffmann, G., et al. 2003, MNRAS, 341, 33
- Kennicutt (1998) Kennicutt, R. C. 1998, ARA&A, 36, 189
- Kennicutt et al. (1984) Kennicutt, R. C., Bothun, G. D., & Schommer, R. A. 1984, AJ, 89, 1279
- Lilly et al. (1996) Lilly, S. J., Le Fèvre, O., Hammer, F., & Crampton, D. 1996, ApJ, 460, L1
- Madau et al. (1996) Madau, P., Ferguson, H. C., Dickinson, M. E., Giavalisco, M., Steidel, C. C., & Fruchter, A. 1996, MNRAS, 283, 1388
- Noll et al. (2004) Noll, S., et al. 2004, A&A, 418, 885
- Pérez-González et al. (2003) Pérez-González, P. G., Gil de Paz, A., Zamorano, J., Gallego, J., Alonso-Herrero, A., & Aragón-Salamanca, A. 2003, MNRAS, 338, 525
- Rowan-Robinson et al. (1997) Rowan-Robinson, M., et al. 1997, MNRAS, 289, 490
- Rudnick et al. (2003) Rudnick, G., et al. 2003, ApJ, 599, 847
- Saracco et al. (2003) Saracco, P., et al. 2003, A&A, 398, 127
- Tresse et al. (2002) Tresse, L., Maddox, S. J., Le Fèvre, O., & Cuby, J.-G. 2002, MNRAS, 337, 369